 ISSN : 1598-2939

ⓒ Korea Institute of Sport Science
Most studies comparing objective measurements of physical activity are carried out on a treadmill or in free living activities and generally at low/moderate intensities. Purpose: To compare energy expenditure, correlation and exercise intensity measured by accelerometer and heart rate (HR) monitor during different exercises. Methods: This is a comparison study testing convergent validity between accelerometer and HR-monitor. A total of 26 participants (15 women) with a mean age of 21.8±2.4 years were included. The ActiGraph GT3X with 60 s epoch length was used to measure the participants’ accelerometer counts. HR was measured using Polar team 2 HR belts during 4x4 min running (four intervals lasting four minutes), 4x4 min spinning and Zumba. Results: Pearson correlation coefficient between mean % HR max and accelerometer counts was 0.69 in Zumba, 0.14 in 4x4 spinning and -0.42 in 4x4 running. Estimated energy expenditure from accelerometer was 2.25±1.69 kcal/min lower, i.e. 18.6 %, than energy expenditure estimated from HR monitor during 4x4 running. The corresponding numbers for 4x4 spinning and Zumba were 6.27±2.18 kcal/min lower, i.e. 55.7% and 2.64±1.78 kcal/min lower, i.e. 23.6%, respectively. A Bland-Altman plot shows that this difference increases with higher activity level in Zumba. For 4x4 min running the HR-monitor and accelerometer classified 76% and 60%, respectively, of the participants’ activity as vigorous intensity. Conclusion: A large instrumental variation in energy estimation across activities was found. Energy expenditure estimated by accelerometer was around 20% lower for 4x4 running and Zumba, and around 50% lower for 4x4 spinning, compared to energy expenditure estimated from HR monitor. The large variation in the correlation coefficients reflects the methodical differences explained in the paper.
Most studies comparing objective measurements of physical activity are carried out on a treadmill or in free living activities and generally at low/moderate intensities. Purpose: To compare energy expenditure, correlation and exercise intensity measured by accelerometer and heart rate (HR) monitor during different exercises. Methods: This is a comparison study testing convergent validity between accelerometer and HR-monitor. A total of 26 participants (15 women) with a mean age of 21.8±2.4 years were included. The ActiGraph GT3X with 60 s epoch length was used to measure the participants’ accelerometer counts. HR was measured using Polar team 2 HR belts during 4x4 min running (four intervals lasting four minutes), 4x4 min spinning and Zumba. Results: Pearson correlation coefficient between mean % HR max and accelerometer counts was 0.69 in Zumba, 0.14 in 4x4 spinning and -0.42 in 4x4 running. Estimated energy expenditure from accelerometer was 2.25±1.69 kcal/min lower, i.e. 18.6 %, than energy expenditure estimated from HR monitor during 4x4 running. The corresponding numbers for 4x4 spinning and Zumba were 6.27±2.18 kcal/min lower, i.e. 55.7% and 2.64±1.78 kcal/min lower, i.e. 23.6%, respectively. A Bland-Altman plot shows that this difference increases with higher activity level in Zumba. For 4x4 min running the HR-monitor and accelerometer classified 76% and 60%, respectively, of the participants’ activity as vigorous intensity. Conclusion: A large instrumental variation in energy estimation across activities was found. Energy expenditure estimated by accelerometer was around 20% lower for 4x4 running and Zumba, and around 50% lower for 4x4 spinning, compared to energy expenditure estimated from HR monitor. The large variation in the correlation coefficients reflects the methodical differences explained in the paper.
Measuring oxygen uptake is a commonly used method to measure energy expenditure (EE) and is regarded as one of the gold standard measurements of EE (Jørgensen et al, 2009). However, this method demands expensive equipment and is often inappropriate since groups of participants cannot be tested simultaneously. During the last 15 years the technologies in accelerometers and heart rate (HR) monitors have improved and are now widely used to estimate EE in physical activity (Garatachea et al, 2010; Halsey et al, 2012; Zhu et al, 2013). However, both instruments have limitations. Accelerometers placed over the hip cannot measure the activity level in e.g. cycling and upper-body movement because of limited hip movement (King et al, 2004; Lee & Shiroma, 2014). It is also demonstrated a phenomenon called the ‘plateau’, i.e. the activity counts level off in most accelerometers, including ActiGraph GT3X, when running speed exceeds 10 km·h-1(Brage et al, 2003; Sasaki et al, 2011). Depending on type of activity, an overall prediction error for EE is reported to be around 20% (Zhu et al, 2013). On the other hand, HR-monitors measure the participants’ HRs which are influenced by fitness level, emotional stress at low intensities and increased body temperature. At start/stop and change of intensity, HR does not reflect the work intensity since the heart needs around three minutes to stabilize to a new intensity level (Freedson & Miller, 2000; Trost, 2007). Depending on activity and the EE equation, the error range of HR is reported to be 10-20% (Charlot et al, 2014). A further review of accelerometers and HR monitors is given in Trost and O'Neil (2014).
Several reviews have addressed the relationship between subjective (e.g. questionnaires) and objective (e.g. accelerometers and HR-monitors) measures for assessing physical activity (Adamo et al, 2009; Prince et al, 2008). Kowalski et al (2012) found that subjective and objective measures of physical activity differed widely in their ability to address frequency, intensity, time and activity type. Most of the objective measures studies they reviewed compared accelerometers, pedometers, and direct observation. Erdogan et al (2010) compared Polar S810i HR-monitor and SenseWear Pro Armband (SWA), and found that at 70% of VO2max, no significant differences in EE were found between the SWA and indirect calorimetry, and between Polar S810i and indirect calorimetry. The Actiheart monitor combines HR and uniaxial accelerometry to estimate EE during activity. While Crouter et al (2008) found that the Actiheart showed promise for being a valid tool for the estimation of EE over a wide range of activities, Nichols et al (2010) found that Actiheart may have limited use in accurately assessing EE in female runners. The only other study we are aware of comparing EE estimated from accelerometers and HR-monitors were carried out during daily free living (mostly at low intensity) or on a treadmill (Macfarlane et al, 2006).
Accelerometer-based EE equations are generally developed from steady-state oxygen consumption data (Sasaki et al, 2011), and developed as square-wave functions to account for the lag period between body motion and true physiological responses to that motion. Usually the equations do not work well across a wide range of activities, and the differences in estimated EE between accelerometers and HR-monitors are not known. Understanding how different tools measure physical activities differently is important in order to compare methods and interpret data correctly.
The primary purpose of this study was to examine the difference in EE estimated from accelerometer and HR in interval running, interval spinning and Zumba. We hypothesized that the differences vary between methods and between different modalities of exercise. These three modalities of exercise were chosen because they were quite different, and we seeked to determine what the differences were. These differences are not known from the literature. Comparing different exercises provides in our view more insight than comparing similar exercises. Two secondary purposes were to study the correlation between accelerometer counts and HR, and to describe exercise intensity categorized by accelerometer and HR monitor. Zumba is a Latin dance-inspired fitness program involving dance and aerobic elements, designed by Alberto "Beto" Perez during the 1990s (Lloyd, 2011). Zumba was chosen due to its current popularity and since it has received virtually no scientific scrutiny. As of March 12 2014, Luettgen et al (2012) and Sanders and Prouty (2012) are the only relevant hits under topic “Zumba” in the Web of Science database.
The 36 participants (22 women) were recruited among university sports students (with one exception, a female 27 year old university graduate). Twenty six participants (15 women), with a mean age of 21.8±2.4 years and a mean BMI of 22.1±2.1, completed all exercise sessions. Body weight was measured using a calibrated, digital scale (Seca model 770, Seca GmbH & Co, Hamburg, Germany). The study information was explained orally and in writing and the volunteers gave their written informed consent. The study was submitted for Institutional Review Board (IRB) approval by the Norwegian Ethics Committee which concluded that the study, which is observational of one physiological variable (HR), does “not require formal IRB approval according to Norwegian laws and regulations in force.” The study was approved by the Norwegian Social Science Data Services AS.
The participants carried out three different training sessions during one week at SiS Sports Center at the University of Stavanger, Norway. We considered habituations to the exercise sessions as irrelevant given the purpose of the study and since the exercise sessions were easily comprehensible by the participants. All participants were familiar with interval running, half of the group had earlier participated in Zumba, while 20 of the participants had participated in indoor interval spinning. For Zumba, the subjects were told to follow the instructor’s instructions with no target HRs. For the two other sessions, the subjects knew their max HR, and followed the instructor’s comments through the intervals to adjust to 70% and 90 - 95% of max HR. Each participant wore an accelerometer and a HR monitor simultaneously during the exercise sessions, and EE was estimated from the two instruments and compared.
Session 1. Monday at 18:00-19:00: Zumba (60 min). First 5 min warm-up, thereafter 50 min of Zumba with four short breaks for drinking, and 5 min cool-down at the end.
Session 2. Thursday at 15:15-16:00: 4x4 running (45 min). First 12 min warm-up, then 4 min running at 90-95% of max HR and 3 min jogging at 70% of max HR, four times, for a total of 28 min, and finally 5 min cool-down.
Session 3. Monday (seven days after session 1) at 15:15-16:00: 4x4 spinning (45 min). Same structure as 4x4 running, replacing running/jogging with spinning.
The participants’ HRs were measured every 5 seconds using Polar team 2 HR belts and RS 100 monitors (Polar Electro Oy, Kempele, Finland). The participants measured their maximal HR indoor or outdoor on their own by the following procedure prior to the first test: First, 20 min with increasing running intensities followed by five min stretching. Second, one uphill running interval (5% treadmill incline) lasting 3 min. This interval was expected to be hard, but not to the point of exertion. Third, a 3-min active break. Fourth, a second 3 min uphill running interval to exhaustion which was the main criterion that HRmax was reached. Fifth, the session ended with a 15-min cool-down run. The highest registered HR was set to HRmax. Resting HR was measured by participants in bed in the morning (HRrest). HR reserve (HRR) is the difference between HRmax and HRrest (Karvonen et al, 1957), and the %HRR is HRrest-(HRexercise/HRmax-HRrest) · 100.
The ActiGraph GT3X (ActiGraph, LLC, Pensacola, FL, USA) was placed over the right hip and used to measure the participants’ accelerometer counts. The accelerometers were initialized and downloaded using the ActiLife 6 software provided by the manufacturer (ActiGraph LLC). The data was collected in 60-second epochs, and normal filter frequency extension (Cain et al, 2013) was used since we studied healthy people during exercise. Activity counts measured as tri-axial vector magnitude was used.
The EE by HR was estimated by Hiillosorpi et al.’s (1999) model 2 equation. This equation was chosen since it is available for scientific scrutiny and widely used:
EE=-1.68+10.84×gender+HR(0.043-0.106×gender) -weight(0.105+0.101×gender)+age(0.095-0.107×gender)+HR×weight(0.00134+0.00119×gender)-HR×age (0.0011-0.00110×gender)
where × means multiplication, weight is measured in kg, and gender is 0 for women and 1 for men.
The EE by accelerometer was estimated by Sasaki et al.’s (2011) and Williams’ (1998) equations, and was chosen since the combination of these equations (named as the “Freedson VM3 Combination” in the ActiLife software) is the newest equation available for the ActiGraph accelerometer:
where VM is the Vector Magnitude combination (accelerometer counts) of the three axes;
The upper row in the equation is from Williams (1998) and prevents negative EE and ensures that EE increases gradually from 0 as participants start to exercise.
A few abnormal HR values were detected due to interference. This data was typically spotted where a single HR- value was much higher/lower than the HRvalues close in time. Such abnormal HR-values were removed and replaced with interpolated data. Since neither accelerometers nor heart rate monitors are the gold standard for measuring energy expenditure, the agreement (convergent validity) between accelerometer and HR-monitor was tested, by using Pearson correlation coefficient, to measure the degree to which the two measures of constructs that theoretically should be related, in fact were related. The Pearson correlation coefficient for mean %HRmax and VM/min for each participant was used to assess the strength of the relationship between HR and accelerometer counts in the three exercise sessions. To further study this correlation, the Pearson correlation between %HRmax and VM/min each minute was analyzed. The number of data points was the number of participants multiplied with the number of minutes in each exercise session. In 4x4 running and 4x4 spinning: n=26 x 45 min= 1170 data points. In Zumba, n=26 x 60 min= 1560 data points. Since the correlation-analysis did not show systematic over/ under-estimations, the strength of agreement between estimated EE by HR-monitor and accelerometer was assessed using the Bland–Altman technique (Bland & Altman, 1986). To measure the differences between EE estimated by the accelerometer and the HR-monitor, a paired sample t-test was used. Data is presented as means ± standard deviation (SD). Statistical significance was set at p<0.05. All statistical analyses were performed using PASW Statistics 20 for Windows (IBM Corporation, Route, Somers, NY, USA).
Pearson correlation coefficients between EE estimated from accelerometer and HRs from Zumba, 4x4 running and 4x4 spinning were 0.76, 0.69 (for both: p<0.001) and 0.40 (p<0.05), respectively.
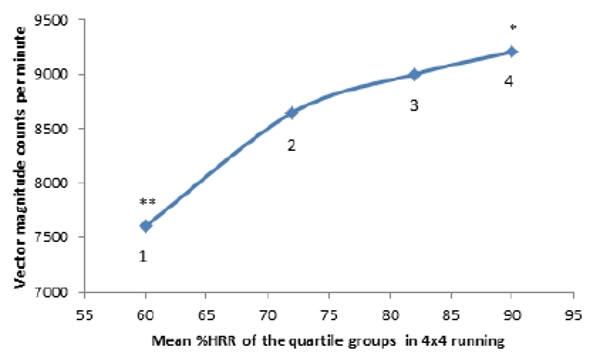
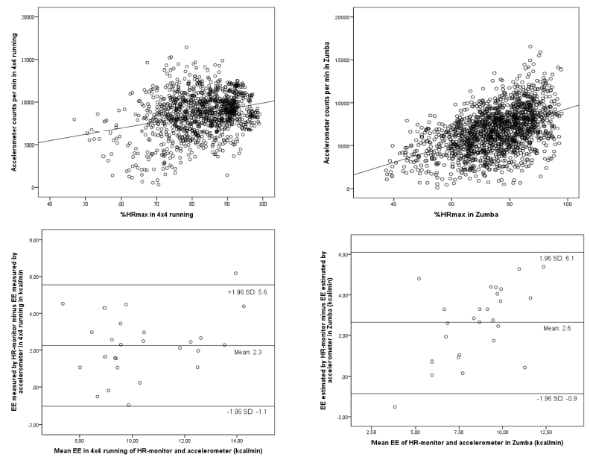
The Bland-Altman plot (Figure 1) illustrates the agreement between the two methods of EE estimation, and shows that the accelerometer on average estimates 2.3 kcal/min lower than the HR-monitor for 4x4 running, and 2.6 kcal/min lower than the HR-monitor for Zumba. The Pearson correlations between mean VM/min and %HRmax for the three exercise sessions are shown in (Table 1) together with the difference in energy expenditure between the two instruments. In 4x4 spinning, large differences in estimated EE from accelerometer and HR-monitor were found. During recovery and activity in 4x4 spinning, estimated EE from accelerometer was 1.86±0.88 kcal/min or 9.41±2.24 kcal/min, i.e. 83.5% lower, and 9.46±3.11 kcal/min or 3.36±3.63 kcal/min, i.e. 26.2% lower, respectively, than EE estimated from HR-monitor (p<0.001 in all analyses). To illustrate how VM/min changed with increased exercise intensity, the mean VM/min in the various quartile groups of %HRR is shown in (Figure 2).
To be able to explain the negative correlation between %HRmax and VM/min in 4x4 running, correlations were analyzed minute by minute and in specific intervals. The Pearson correlation between mean VM/min and %HRmax minute by minute (different from mean correlation in (Table 1)) in 4x4 running was 0.28 (p<0.001; (Figure 1)). The corresponding correlation between VM/min and %HRR was 0.29. To be more specific about the differences between mean correlation (seen in Table 1) and mean minute by minute correlation, we examined the Pearson correlation for VM/min and %HRmax in 4x4 running when VM/min was >12,000; <10,000; and <4000 was -0.45 (p<0.001, n= 71 data points), 0.35 (p<0.001, n= 832 data points) and 0.27 (p=0.044, n= 55 data points), respectively. The correlation between VM/min <10,000 and %HRR was 0.36. The mean %HRmax for the 10% highest VM/min values (above 11,510) in 4x4 running was 83.8±7.2% (n= 117 data points with a mean of 12,500 VM/min). The mean VM/min for the 10% highest %HRmax (above 92.8%) was 9005±1715 cpm (n= 115 data points with a mean of 95.5% of HRmax).
The Pearson correlation between mean %HRmax and VM/min minute by minute in Zumba was 0.47 (p<0.001; (Figure 1)). Higher correlation was not found if VM/min >10.000 counts were excluded. We do not present these more extensive results for 4x4 spinning because the mean correlation was only 0.14, due to accelerometers not registering physical activity without acceleration, common when spinning in sitting position.
The Pearson correlation in 4x4 running between mean VM/min and %HRmax at the first measurement point (i.e. first minute) after the onset of a new period (recovery period or activity period) was -0.28 (p<0.001), while the corresponding correlation at the other measurement points (i.e. all other minute by minute analysis) was 0.31 (p<0.001). The participants in 4x4 running used 4, 34 and 7 min measured by HR-monitor and 7, 27 and 11 min measured by accelerometer in moderate (40-59 of %HRR/ 1952- 5724 cpm), vigorous (60-89 of %HRR or 5725-9498 cpm) and very vigorous (>89 of %HRR or >9498 cpm) exercise intensity, respectively.
The main findings of the study were a far lower estimation of EE when using the accelerometer and Sasaki et al.’s (2011) and Williams’ (1998) equations compared to using the HR-monitor and Hiillosorpi et al.’s (1999) model 2 equation in all exercise sessions. Also found were a large variation in correlation coefficients between mean VM/min and %HRmax in 4x4 running, 4x4 spinning, and Zumba, and that more physical activity was categorized as very vigorous intensity when using the accelerometer compared to using the HR-monitor.
HR measurements and accelerometer counts are different ways to measure physical activity. While HR measurements depend on e.g. the participant’s physical fitness, the accelerometer measures absolute movement independent of the participant’s fitness. The Person correlation coefficients between the VM/min and %HRmax values ranged from 0.69 (Zumba) to -0.42 (running), indicating good correlation (0.69) to moderate negative correlation (-0.42) between the two instruments. The moving pattern is completely different in Zumba compared to 4x4 running. In Zumba, sideways movement and movement in the vertical plane (up and down) come in addition to the forward-backward movement. The acceleration therefore changes continuously and explains a much higher, and positive, correlation between VM/min and %HRmax in Zumba compared with 4x4 running. However, it was surprising to find a negative correlation between VM/min and %HRmax in 4x4 running, indicating that the accelerometer counts decreased when HR increased. Even though the mean VM/min increased through the quartiles 1,2,3,4, the groups’ VM/min did not increase linearly with increased HR (Figure 2). The participants’ mean HR was 84% of HRmax during the 10% highest VM/min values, and mean VM/min was 9005 for the 10% highest %HRmax values. These findings express that the highest count values occurred at 88% of the participants’ highest HR levels during 4x4 running, and the highest HR levels occurred at 78% of the participants’ highest VM/min. Analyzing the data minute by minute in different categories of counts-values, implied that physical activity above 12.000 counts/min resulted in a negative correlation with %HRmax, while physical activity <10.000 counts/min had a positive correlation of %HRmax. These findings support the study of Brage et al (2003) who concluded that accelerometer counts increased linearly with speed in the walking range but not in running, presumably due to relatively constant vertical acceleration in running. Excluding the activity with >10.000 counts/min resulted in a correlation factor between accelerometer and HR-monitor of 0.35 which corresponds to the finding of Macfarlane et al (2006) who reported a correlation factor of 0.36 between accelerometer and HR-monitor in vigorous intensity physical activity during daily life. The Bland-Altman plot in Figure 1 shows that the differences in EE estimation between the two methods increase with higher activity level (in kcal/min) in Zumba. In 4x4 running, the same pattern was not observed, possibly because of a generally higher activity level in 4x4 running compared to Zumba.
Training intensity has a large effect on exercise HR and the accuracy of prediction equations. The 36 participants were reasonably well trained which should be taken into account when comparing the results with other studies.
The rationale for the HRR method is that establishing exercise intensity without taking into account resting HR (as in the %HRmax method) tends to underestimate the training workload. However, the small correlation differences between %HR and VM/min vs. %HRR and VM/min show that the participants’ different resting HRs influence the results negligibly.
The negative correlation between mean VM/min and %HRmax found the first minute after the onset of a new period (recovery period or activity period) in 4x4 running expresses the difference between the two instruments immediately after a change in exercise type and intensity. The moderate and positive correlation between mean VM/min and %HRmax at the other measurement points expresses the increased correspondence between the two instruments at a later point in time when the new exercise intensity has stabilized. This could be related to the finding that the time spent in the different intensity zones differed for the HR-monitor and accelerometer in 4x4 running.
Using the cut points listed at the end of the Results section in 4x4 running, the accelerometer categorized more of the activity as moderate intensity and very vigorous intensity, and thus less of the activity as vigorous intensity, compared with the HR-monitor which categorized more of the activity as vigorous intensity. This is explained by accelerometers reacting instantly to start-stop, while HR needed up to three minutes to stabilize to a new intensity level (McArdle et al, 2010). This finding is in line with a study by Macfarlane et al (2006), who reported that HR-monitors overestimated light activity (20–39.9 of %HRR) and underestimated moderate activity compared to other instruments. Some of the large variation between accelerometer and HR measurements could be explained by the fact that Sasaki et al.’s (2011) equation is based on steady state oxygen consumption. Analyzing interval training when steady- state HR is not achieved therefore poses some challenges, and new accelerometer equations estimating EE in interval exercise sessions are needed. The accelerometer estimated significantly lower EE in all activities compared to the HR-monitor. In Zumba the 23.6% difference between the instruments increases as the intensity increases (Figure 1). An increased intensity in Zumba could be a result of more upper-body movement or a greater bending at the hip joint, not detected by accelerometer.
Due to limited hip movement when sitting, EE measured by accelerometer in cycling is found to be 33-62% of EE measured by oxygen consumption (Campbell et al, 2002; Jakicic et al, 1999; Yokoyama et al, 2002). The large difference in estimated EE between accelerometer and HR-monitor found during 4x4 spinning, is mainly caused by the participants who were always sitting during recovery, with limited hip movement, while most participants were standing during activity.
Some limitations of our study are as follows: First, the two instruments were not compared to a true gold standard for EE such as indirect calorimetry. Therefore, this is a comparison study testing convergent validity. Second, we have relied on one published equation for EE estimation based on HR, by Hiilloskorpi et al (1999), and one published equation for EE estimation based on accelerometer, by Sasaki et al (2011) and Williams (1998). Several EE equations have been published based on accelerometer measurements, but for HR-monitors most such equations are confidential. Confidentiality causes a problem from a scientific point of view since consumers cannot assess the formulas’ validity. Incentives need to be provided so that the industry can find ways of ensuring that the consumer is correctly informed. However, newer equations are developed and published, recently by Charlot et al (2014).
Energy expenditure estimated from the accelerometer was 18.6%, 55.7% and 23.6% lower than for HR monitor in 4x4 running, 4x4 spinning and Zumba, respectively. Since accelerometer is known to underestimate energy expenditure in cycling, a doubling of the energy expenditure estimated from accelerometer seems reasonable. The finding that the highest accelerometer count values (in VM/min) did not occur at the highest HR levels and vice versa suggests that the lower estimation of energy expenditure from accelerometer in 4x4 running could be due to the relatively constant vertical acceleration common in running. Using accelerometers for energy expenditure estimation may therefore be more precise in activities with acceleration changes. In 4x4 spinning and Zumba the lower estimation of energy expenditure from accelerometer could be explained by movement in the hip joint and upper-body movement not detected by the accelerometer.
Since the movement pattern in Zumba varies between forward-backward, sideways, and in the vertical plane (up and down), the acceleration changes continuously which explains a higher correlation between vector magnitude counts per minute and % of HR max in Zumba compared with 4x4 running.
Accelerometers can be used to estimate EE applying the percentage differences documented in this study. Further studies should focus on developing prediction equations for accelerometers in exercises like e.g. interval running. If EE should be estimated from accelerometer, using today’s equations, the movement pattern in running sessions could be designed to optimize the accuracy and precision of the accelerometer measurements by including direction changes and repeated start- stop movements, e.g. as in the shuttle run test. In Zumba, the main work can be carried out by moving the center of gravity. In spinning, participants can cycle in standing position or fasten the accelerometer around the leg.
For 4x4 min running the HR-monitor and accelerometer classified 76% and 60%, respectively, of the participants’ activity as vigorous intensity. Thus the accelerometer classifies more of the activity as moderate or very vigorous intensity compared with the HR-monitor.