 ISSN : 1598-2939

© Korea Institute of Sport Science
Lateral ankle sprain (LAS) is the most common injury in Korean adolescent soccer players. However, intrinsic risk factors for LAS in adolescent soccer players remain unclear. Therefore, this prospective cohort study aimed to identify intrinsic risk factors for LAS in Korean adolescent soccer players. This study included 100 adolescent soccer players (age=13.21±0.95 years, height=1.62±0.09 m, weight=53.37±9.54 kg, BMI-for-age percentile=63.78±20.89%, athletic career=3.95±1.96 years). Baseline measurements were performed in the preseason, and the injury surveillance on LAS was conducted for 1 year. Independent variables included participants’ demographic and anthropometric data, self-reported questionnaire, lower extremity alignments, range of motion, static, and dynamic balance, coordination, and ankle kinematics during running. Independent t-test and Chi-square analysis were used for potential risk factors, which were imported to the binary logistic regression to identify intrinsic risk factors for LAS. Data on intrinsic risk factors identified by the logistic regression were analyzed using the receiver operating characteristic curve analysis to determine a cutoff point of each variable. In this study, age, body mass index, previous LAS history, the number of LAS history, and maximum dorsiflexion and inversion during the stance phase of running were potential risk factors for LAS. Our major findings showed that decreased dorsiflexion and increased inversion at initial contact during running significantly affected LAS occurrence in Korean adolescent soccer players. Considering our major findings, to prevent LAS in adolescent soccer players, gait training must not be overlooked and should be included in warm-up sessions.
Lateral ankle sprain (LAS) is the most common injury in Korean adolescent soccer players. However, intrinsic risk factors for LAS in adolescent soccer players remain unclear. Therefore, this prospective cohort study aimed to identify intrinsic risk factors for LAS in Korean adolescent soccer players. This study included 100 adolescent soccer players (age=13.21±0.95 years, height=1.62±0.09 m, weight=53.37±9.54 kg, BMI-for-age percentile=63.78±20.89%, athletic career=3.95±1.96 years). Baseline measurements were performed in the preseason, and the injury surveillance on LAS was conducted for 1 year. Independent variables included participants’ demographic and anthropometric data, self-reported questionnaire, lower extremity alignments, range of motion, static, and dynamic balance, coordination, and ankle kinematics during running. Independent t-test and Chi-square analysis were used for potential risk factors, which were imported to the binary logistic regression to identify intrinsic risk factors for LAS. Data on intrinsic risk factors identified by the logistic regression were analyzed using the receiver operating characteristic curve analysis to determine a cutoff point of each variable. In this study, age, body mass index, previous LAS history, the number of LAS history, and maximum dorsiflexion and inversion during the stance phase of running were potential risk factors for LAS. Our major findings showed that decreased dorsiflexion and increased inversion at initial contact during running significantly affected LAS occurrence in Korean adolescent soccer players. Considering our major findings, to prevent LAS in adolescent soccer players, gait training must not be overlooked and should be included in warm-up sessions.
In sports medicine and science, adolescents are considered not physically small adults but a population with varying physical characteristics. As adolescents are in the growth spurt period, they may become vulnerable to sports injury (Van Der Sluis et al., 2014). Owing to differences in growth speed between the bones and soft tissues as well as loss of physical balance, growth spurt International Journal of Applied Sports Sciences may predispose adolescent athletes to musculoskeletal injuries (Van Der Sluis et al., 2014). Therefore, researchers in sports medicine should identify approaches for reducing injury incidences among adolescent athletes on the basis of their physical characteristics.
Soccer is one of the most popular sports in Korea. Approximately 25,000 adolescent soccer players aimed to be professional soccer players (Korea Football Association, 2020). A previous study by Lee et al. (2020) reported that Korean adolescent soccer players were trained and played matches on artificial grounds, which predisposed them to sports injuries (Ekstrand et al., 2011). In adolescent soccer, ankle joints, and ligament sprains were the most common injured body part and injury type, respectively (Junge et al., 2004; Lee et al., 2020). Additionally, Doherty et al. (2014) reported that youth experience a higher ankle sprain incidence than adults. The results of previous studies (Doherty et al., 2014; Ekstrand et al., 2011; Junge et al., 2004; Lee et al., 2020; Villwock et al., 2009) implied that Korean adolescent soccer players performed soccer activities with a high risk of lateral ankle sprain (LAS). Therefore, LAS in adolescent soccer players should be prevented and properly treated.
LAS is one of tough problems in sports injuries as it causes several sequelae. LAS tends to deteriorate, resulting in repetitive ankle sprain known as chronic ankle instability (CAI) (Hertel, 2000). A previous study by Lee and Ha (2023), reported that approximately 43% of all LASs were re-injuries of LAS in Korean under 15 years old (U-15) soccer players during a 1-year injury surveillance. Additionally, high re-injury LAS rates were reported in the physically active youth population (Clifton et al., 2017; Pasanen et al., 2017). Recurrent LASs may cause ankle articular degeneration and osteoarthritis (Harrington, 1979), decreased health-related quality of life (Houston et al., 2014; Lee et al., 2021), and altered ankle movement patterns during walking and running gait (Chinn et al., 2013; Lee et al., 2022). The aforementioned problems may create negative effects on the development of adolescent athletes’ career and enhancement of physical and soccer performance. Therefore, age-specific injury prevention programs on LAS are needed for adolescent soccer players. Although the Federation Internationale de Football Association 11+ program was developed to prevent soccer injuries, extrinsic training conditions including weather, culture, and training ground are different between Korea and other countries. Therefore, evidence-based injury prevention programs (EBIPPs) focusing on LAS in Korean adolescent soccer players should be developed. Finch (2006), suggested that the identification of risk factors for a specific injury should precede EBIPP developments. Bahr and Krosshaug (2005), suggested a comprehensive model for injury causation, including joint biomechanics. The EBIPP of LAS in Korean adolescent soccer players should be developed on the basis of these models and theories (Bahr and Krosshaug, 2005; Finch, 2006).
Several researchers have attempted to identify risk factors for LAS. Risk factors are divided into intrinsic and extrinsic risk factors. Intrinsic risk factors are defined as personal risk factors to predispose an athlete to injury such as age, alignment, and strength whereas extrinsic risk factors are external factors to individuals which have effects on the injury risk such as whether, ground condition, and shoe friction. Previous studies investigated intrinsic risk factors for LAS using anthropometric data (Fousekis et al., 2012; Hartley et al., 2018; Willems et al., 2005), alignment (Kobayashi et al., 2013, Saki et al., 2021; Shahi et al., 2020), ankle range of motion (ROM) (Fousekis et al., 2012; Hartley et al., 2018; Kobayashi et al., 2013; Pourkazemi et al., 2018; Shahi et al., 2020), ankle stability (Fousekis et al., 2012; Pourkazemi et al., 2018), balance (Hartley et al., 2018; Ko et al., 2018; Pourkazemi et al., 2018; Shahi et al., 2020; Willems et al., 2005), coordination/ function (Ko et al., 2018; Pourkazemi et al., 2018), a previous LAS history (Fousekis et al., 2012; Hartley et al., 2018; Kobayashi et al., 2013; Pourkazemi et al., 2018; Saki et al., 2021), muscle strength (Fousekis et al., 2012; Willems et al., 2005), power (Pourkazemi et al., 2018; Willems et al., 2005), and proprioception (Fousekis et al., 2012; Pourkazemi et al., 2018). However, as research findings from previous studies are inconsistent with each other, LAS risk factors have not yet been fully clarified. Furthermore, as participants from previous studies were adults and adolescents, males and females, and athletes from various sports, research on EBIPPs for LAS prevention in Korean youth soccer including the effects of biomechanical patterns on LAS is needed. In summary, the EBIPP is needed to prevent LAS in Korean adolescent soccer players. However, most studies have been conducted in adult participants and have not considered differences between sports-specific factors. Additionally, there is a lack of research on biomechanical characteristics that have an important impact on the LAS occurrence, particularly in joint kinematics during running. Therefore, the present study aimed to identify intrinsic risk factors for LAS, including demographic characteristics, anthropometric data, alignments, ankle ROM, coordination, self-reported questionnaires, static, and dynamic balance, and ankle kinematics during running, in Korean adolescent soccer players through a 1-year follow-up.
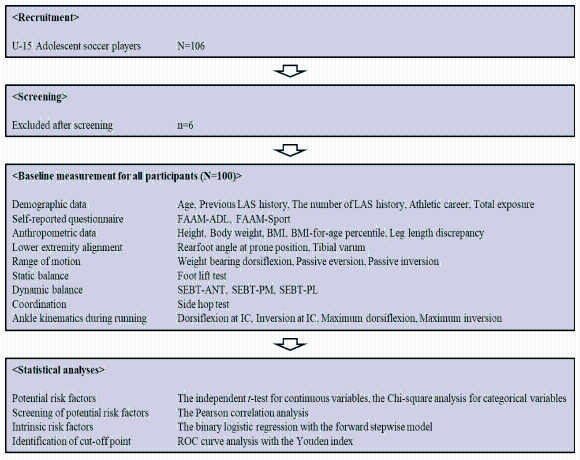
This was a prospective cohort study with 1-year follow-up. All procedures of this study were approved by the Institutional Review Board of Yonsei University (No. 7001988-202011-HR-1045-02). This study was conducted on the basis of the following procedures: recruitment, baseline measurements at preseason, and injury surveillance for 1-year (Figure 1).
A total of 106 male adolescent soccer players aged 12–15 years from two elite U-15 soccer teams were recruited for this prospective cohort study. The sample size was decided on the basis of a previous study suggesting at least 100 participants for logistic regression analysis for exploratory studies (Peat & Barton, 2005). After recruitment, all participants were screened using the following eligibility criteria: (1) should be registered in the Korean Football Association, (2) should have at least three training sessions per week, (3) should voluntarily participate in this study, (4) should have no injury history within 3 months before baseline measurements, (5) should be able to conduct baseline measurements without any difficulties, and (6) should have no history of lower extremity fracture and surgery. Finally, after screening, 100 adolescent soccer players participated in this study. All participants provided written informed consent before baseline measurements. The demographic characteristics of participants are shown in Table 1.
A baseline measurement session was conducted in the early preseason. It consisted of questionnaires for demographic characteristics, anthropometric data, lower extremity alignments (LEAs), ankle ROM, coordination, self-reported questionnaires, static, and dynamic balance, and ankle kinematics during running using two-dimensional (2D) video analyses. Skilled investigators with good and excellent intrarater reliability performed all measurements three times (Table 2).
All participants were provided with a questionnaire for demographic characteristics. It consisted of age, athletic career, dominant leg, previous LAS history for each ankle, and total exposure hours. After filling in the questionnaires, height, body weight, and leg length from the anterior superior iliac spine to the tip of the medial malleolus were measured. Body mass index (BMI) was calculated using the following formula: (body weight [kg]/height [m]2) × 100. Additionally, BMI-for-age percentile was calculated (https://www.cdc.gov/healthyweight/bmi/calculator.html). Data for height, leg length, and body weight were measured using a scale in 1 cm and 0.1 kg, respectively. A coaching staff of each team recorded the total exposure hours on the basis of the method of a previous study (Fuller et al., 2006).
To analyze the effects of LEA on LAS, rearfoot angle at prone position (PRA) (Buchanan & Davis, 2005) and tibial varum (TV) (Tomaro, 1995) were used. A participant lay down in a prone position on a treatment bed with both ankles out of the edge. The investigator identified the subtalar neutral position and instructed a participant to maintain the position. For PRA, the angle between the midline of the Achilles tendon and the bisecting line of the calcaneus was measured, whereas the angle between the bisecting line of the upper two-thirds and the lower one-third of the lower leg was measured for TV.
Weight-bearing dorsiflexion (WBDF) (Kang et al., 2015), passive eversion (PEV) (Menadue et al., 2006), and passive inversion (PIN) (Menadue et al., 2006) were collected as potential risk factors for LAS. For WBDF, a participant stood with the investigated limb forward and the opposite limb backward in a straight line. The second toe and heel of the investigated foot were aligned in a straight line. Subsequently, a participant flexed the knee of the investigated limb as forward as possible without heel lift. A digital inclinometer (iPhone XS, Apple Inc., Cupertino, CA, USA) was placed on the tibial shaft of the investigated limb. The angle between the vertical line and the tibial shaft was recorded as the WBDF value. For PEV and PIN, a participant sat on a treatment bed with the knee and hip at 90° flexion. Both limbs were in the air, and the investigated ankle was in a relaxed position with slight plantar flexion (PF). The following were the landmarks for PEV and PIN: (1) a stationary arm, the midline of the tibial shaft; (2) an axis, the midpoint between the lateral and medial malleoli; and (3) a moving arm, the midline of the dorsal surface of the second ray of the investigated foot. The investigated ankle was passively everted and inverted by an investigator, and the angle at the end range was recorded.
The side hop test was used to measure coordination (Ko et al., 2018). Two lines with a 30-cm interval were taped on the floor, and a participant stood with the investigated limb on the first line. An investigator then instructed the participant to hop to the second line laterally and back to the starting line, which was considered one successful repetition. All participants completed 10 repetitions as quickly as possible without errors, such as loss of balance. The time spent on this test was measured using a scale in 0.01 s.
For self-reported questionnaires, the foot and ankle ability measure (FAAM)–activities of daily living (ADL) and sports were used for quantifying subjective ankle function and stability (Carcia et al., 2008). The International Ankle Consortium proposed these questionnaires as screening tools for individuals with CAI (Gribble et al., 2014). The FAAMADL and sports used in this study are translated into Korean and those were verified in the previous study (Ha, 2015).
Static and dynamic balance were measured using the foot lift test (FLT) (Hiller et al., 2007) and star excursion balance test (SEBT) (Hertel et al., 2006), respectively. For the FLT, a participant stood in barefoot and single-leg stance condition with eyes closed. The dorsal surface of the other foot touched the calf of the stance leg with arms on both sides. A participant was instructed to maintain this posture for 30 s. An investigator counted the number of times the stance foot was lifted and the other foot touched the floor. For the SEBT, a participant stood in barefoot condition with a single-leg stance on the center of the SEBT setting and placed his hands on the iliac crests. A participant attempted to reach and touch the taped line on the floor with the other foot to the anterior (ANT), posteromedial (PM), and posterolateral (PL) directions as far as possible. Distances of three directions were recorded and normalized in percentage on the basis of his leg length. The distance from the center of the SEBT setting to the reach point of each direction was measured by scale in 1 cm. Moreover, the composite (COM) score of the SEBT was calculated using the following formula: SEBT-COM=(ANT reach distance+PM reach distance+PL reach distance)/(leg length×3).
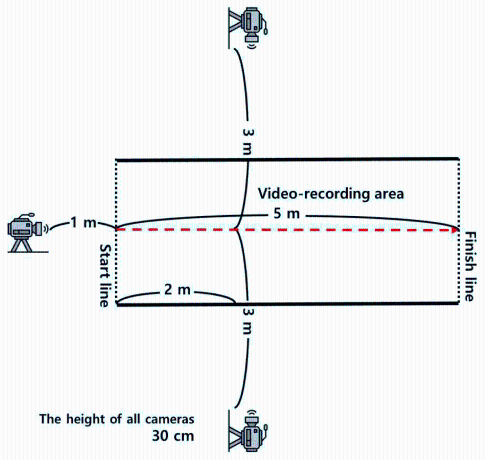
Ankle kinematics during running, recorded using three video cameras (EOS 5D Mark 2, Canon Inc., Ohta-ku, Tokyo, Japan), was analyzed using 2D video analyses. The experimental setting is shown in Figure 2. In the experimental setting area, a participant was instructed to run three times at a preferred speed with a range of ±5%. During three running practice sessions, the preferred speed was calculated using the following formula: preferred speed (m/s)=5 m/time spent on the 5-m running. All trials were recorded with a sampling rate of 30 frames/s, and a running gait cycle for each trial was used to export joint angle data on both ankles. For joint angles in the sagittal and frontal planes, dorsiflexion (DF) at initial contact (IC), inversion (IN) at IC, maximum DF (MDF), and maximum IN (MIN) were calculated on the basis of the methods from a previous study (Schurr et al., 2017). All joint angles were computed using Kinovea software (version 0.8.15, Kinovea Open-Source Project, www.kinovea.org).
The researcher instructed medical staffs of two elite U-15 soccer teams to record a new LAS occurring during the soccer activities for 1 year. Soccer activities were defined as official and nonofficial matches, team training, and personal training supervised by at least one coaching staff (Fuller et al., 2006). A LAS was defined as a lateral ligament injury of the ankle by IN sprain, which resulted in inflammation around the lateral malleolus and difficulty in performing physical activities for at least 1 day (Gribble et al., 2014).
A LAS history during the follow-up period was the dependent variable, whereas independent variables included demographic characteristics, anthropometric data, LEA, ankle ROM, coordination, self-reported questionnaires, static, and dynamic balance, and ankle kinematics during running. Bilateral data from both limbs and unilateral data including height, body weight, and FAAM scores were used for analyses. The following was the statistical analysis procedure: (1) identifying potential risk factors, (2) screening associations between potential risk factors, (3) identifying intrinsic risk factors, and (4) determining a cutoff point of intrinsic risk factors for LAS. To identify potential risk factors, the independent t-test, and Chi-square analysis were used for continuous and categorical variables, respectively. We defined significantly different variables as potential risk factors. Subsequently, to identify associations between potential risk factors, the Pearson correlation analysis was used. If an r-value was over 0.8 between potential risk factors, only one variable with the largest effect size (Cohen’s d) was selected. To identify intrinsic risk factors for LAS, all potential risk factors were entered into the binary logistic regression using the forward stepwise model. Finally, to determine a cutoff point of intrinsic risk factors for LAS, the receiver operating characteristic (ROC) curve analysis with the Youden index was performed. All statistical analyses were performed using Statistical Package for the Social Sciences (version 25, IBM, Chicago, Illinois, USA), and an alpha level for all analyses was set at 0.05.
Epidemiological data showed that a total of 44 LASs occurred in 37 adolescent soccer players during the 1-year follow-up period. Seven players sprained their both ankles.
The results of the independent t-test and Chi-square analysis indicated that age, body weight, BMI, BMI-for-age percentile, a previous LAS history, DF at IC, IN at IC, MDF, and MIN were potential risk factors (Table 3).
The results of the Pearson correlation analysis for potential risk factors demonstrated that body weight, BMI, and BMI-for-age percentile were significantly correlated: (1) body weight and BMI, r=0.808 (p< 0.001); and (2) BMI and BMI-for-age percentile, r= 0.915 (p<0.001). Therefore, BMI (d=−0.766) was entered in the binary logistic regression owing to the largest effect size except for body weight (d=−0.514) and BMI-for-age percentile (d=−0.453) (Table 3). The results of the binary logistic regression suggested that DF at IC and IN at IC were significant intrinsic risk factors for LAS in adolescent soccer players (Table 4). The odds ratio of DF at IC was 1.468, indicating that the odds of LAS occurrence increased by 46.8% with an increase in the PF angle at IC. The odds ratio of IN at IC was 2.662, indicating that the odds of LAS occurrence increased by 166.2% with an increase in the IN angle at IC (Table 4).
Table 5 shows the results of the ROC curve analysis, which suggested that 0.35° of DF at IC and 4.50° of IN at IC were significant cutoff points of LAS occurrence.
This study was conducted to identify intrinsic risk factors for LAS in adolescent soccer players by performing a prospective cohort study with a 1-year follow-up. Our main findings showed that ankle kinematics in the sagittal and frontal planes at IC during running may affect LAS occurrence in adolescent soccer players.
Our results showed that the increased PF and IN at IC during running caused LAS, which is consistent with the results of previous studies (Delahunt & Remus, 2019; Wright et al., 2000), indicating that inverted ankles at IC resulted in LAS and PF at IC significantly affected LAS occurrence. This suggests that ankle kinematics at IC during running was the most significant key to decrease LAS incidence. Furthermore, a previous epidemiological study on LAS in Korean adolescent soccer confirmed noncontact injury as the most common cause of LAS, accounting for approximately 89% (Lee & Ha, 2023). Considering the results of previous studies (Delahunt & Remus, 2019; Lee & Ha, 2023; Wright et al., 2000), as the majority of LAS occurred without body contact mechanisms, gait training and motor control intervention should be included in the EBIPP for LAS prevention to control ankle kinematics during running. In this study, only ankle kinematics at IC during running significantly predicted LAS occurrence. Bahr & Krosshaug (2005) stated that an injury may occur when a predisposed athlete with intrinsic risk factors is exposed to extrinsic risk factors and incited by events, including playing situations, player behavior, and whole body, and joint biomechanics. This suggests that a predisposed athlete is not injured without inciting events; however, he is exposed to extrinsic risk factors. Therefore, clinicians, researchers, and healthcare providers should consider that altered ankle kinematics may result in LAS.
The results of our study showed that potential risk factors, which were not significant final intrinsic risk factors, included age, previous LAS history, the number of LAS history, body weight, BMI, BMI-for-age percentile, and MDF, and MIN during the stance phase of running. Although these variables did not significantly predict LAS occurrence, they must not be overlooked since previous studies have also reported previous LAS history (Pourkazemi et al., 2018; Saki et al., 2021; Shahi et al., 2020), body weight (Fousekis et al., 2012; Pourkazemi et al., 2018), and BMI (Fousekis et al., 2012; Hartley et al., 2018) as risk factors for LAS. Regarding previous LAS history, our findings were consistent with those of previous studies (Pourkazemi et al., 2018; Saki et al., 2021; Shahi et al., 2020). In this study, although previous LAS history was just one of the potential risk factors for LAS, it should be considered one of the significant risk factors considering the results of earlier prospective cohort studies. Regarding body weight and BMI, although previous studies reported that greater body weight and BMI were intrinsic risk factors for LAS, lower body weight, and BMI were considered potential risk factors (Fousekis et al., 2012; Hartley et al., 2018; Pourkazemi et al., 2018). These discrepancies may result from varying participants, including adolescents, and adults. In the present study, all participants were adolescents aged 12–15 years; however, previous studies recruited adult participants, including professional soccer players, and male collegiate athletes (Fousekis et al., 2012; Hartley et al., 2018; Pourkazemi et al., 2018). The musculoskeletal system of adults is completely matured, whereas that of adolescents is still developing. If soft tissues lengthen beyond their expected limit, they may be torn. In adolescents, lower body weight, and BMI suggest physically immature characteristics considering different growth speeds between the bones and soft tissues (Van Der Sluis et al., 2014). Therefore, LAS in adolescents may occur owing to poor coordination and physical balance due to physically immature characteristics. Additionally, age, alignments, poor static, and dynamic balance, strength deficits, and ankle ROM were reported as risk factors from previous studies but not this study. Younger (Pourkazemi et al., 2018) and older age (Shahi et al., 2020) were reported as one of risk factors for LAS. Increased navicular drop and knee recurvatum were also one of LAS predictors (Saki et al., 2021); however, it was reported that longer navicular–medial malleolus distance may affect LAS occurrence (Kobayashi et al., 2013). Worse static and dynamic balance (Hartley et al., 2018; Ko et al., 2018; Pourkazemi et al., 2018; Willems et al., 2005), strength and power problems (Fousekis et al., 2012; Pourkazemi et al., 2018; Willems et al., 2005), and ankle ROM (Kobayashi et al., 2013; Willems et al., 2005) were also considered significant risk factors for LAS. The discrepancies between this and previous studies resulted from different methodologies including participants and outcome variables. Participants of most previous studies were adults and from various sports. Additionally, different outcome variables between this and previous studies were used to identify intrinsic risk factors for LAS. Given these discrepancies, similar characteristics of participants and outcome variables should be considered to identify risk factors. Therefore, more studies must be conducted using similar methods used in previous studies. This study was performed with the sufficient sample size based on the previous studies. According to Bahr and Krosshauge (2005), The sample size of 20–50 is required for risk factors to have a moderate to strong effect on injury. Given that 34% of 100 Korean adolescent soccer players suffered from LAS (Lee & Ha, 2023), the following formula can be used: (the minimum number of participants required/ 0.34 [injury rate]/1 [follow-up period]). Therefore, to have a moderate to strong effect on LAS, the sample size needed to be the range of 59–147. Because 100 adolescent soccer players participated in this study, the findings of this study may be reliable based on the scientific evidence as mentioned above. To our knowledge, this is the first research to identify intrinsic risk factors of LAS in Korean adolescent athletes using joint kinematics during running. Our findings may suggest that biomechanical characteristics are more important rather than other intrinsic risk factors to prevent LAS in adolescent soccer players. Therefore, further studies analyzing biomechanical variables for injury prevention are needed.
Our findings suggested that DF deficits and more inverted ankles at IC predispose adolescent soccer players to LAS. Although potential risk factors including age, BMI, previous LAS history, and MDF, and MIN during the stance phase of running may also be significant variables, ankle kinematics at IC during running should be considered a keystone of LAS prevention in adolescent soccer players. Therefore, to prevent LAS, gait training must not be overlooked and should be included in warm-up sessions.
This study had some limitations. First, extrinsic risk factors were not considered in this study. Second, this study did not include joint kinematics of the knee and hip joints. Those with CAI had characteristics of proximal joint adaptation, including the knee, and hip joints during various tasks (Dejong et al., 2020). Additionally, according to the kinetics chain theory, movement patterns of the adjacent joint may affect those of the other. Third, ankle kinematics in the transverse plane including adduction may also be a significant risk factor for LAS. However, we used 2D video analyses during running, which limited more precise analyses, including the transverse plane motion of the ankle. Therefore, to identify the effects of ankle kinematics in the transverse plane during running on LAS occurrence, future studies should be conducted.
This work was supported by the Ministry of Education of the Republic of Korea and the National Research Foundation of Korea (NRF-2021S1A5B5A17054723). All authors would like to appreciate all participants, the International Olympic Committee Research Centre KOREA, and the National Research Foundation of Korea. This study complied with the current laws of the country where it was performed.
Author Contributions
Conceptualization: I.L & S.Y.L
Data curation: I.L & S.H & S.Y.L
Formal analysis: I.L & S.Y.L
Investigation: I.L & S.H
Project administration: I.L
Writing-original draft preparation: I.L & S.H
Writing-review and editing: S.Y.L
Conflict of Interest
The authors declare that they have no conflict of interest.
Korea Football Association (2020, November). Registered players in KFA. https://www.kfa.or.kr/img_src/bbs/kfa_registration/161728985811887.pdf.
| Variable | Total (N=100) | LAS group (n=37) | Control group (n=63) | p |
|---|---|---|---|---|
| Age (year)a | 13.21 (0.95) | 12.95 (0.91) | 13.37 (0.94) | 0.032* |
|
|
||||
| Height (m)a | 1.62 (0.09) | 1.62 (0.08) | 1.63 (0.10) | 0.444 |
|
|
||||
| Weight (kg)a | 53.37 (9.54) | 50.36 (8.32) | 55.14 (9.83) | 0.015* |
|
|
||||
| BMI (kg/m2)a | 20.06 (2.08) | 19.16 (1.74) | 20.59 (2.09) | 0.001** |
|
|
||||
| BMI-for-age percentile (%) | 63.78 (20.89) | 57.92 (19.03) | 67.22 (21.31) | 0.031* |
|
|
||||
| Leg length discrepancy (cm)a | 0.53 (0.45) | 0.55 (0.51) | 0.52 (0.42) | 0.788 |
|
|
||||
| Dominant leg (L:R)b | 11:89 | 4:33 | 7:56 | 0.963d |
|
|
||||
| Athletic career (year)a | 3.95 (1.96) | 3.56 (1.81) | 4.17 (2.02) | 0.130 |
|
|
||||
| Exposure (hour)a | ||||
| Total exposure | 243.05 (19.02) | 241.26 (20.43) | 244.10 (18.23) | 0.474 |
| Training exposure | 201.28 (15.88) | 199.28 (17.56) | 202.46 (14.82) | 0.336 |
| Match exposure | 41.77 (12.73) | 41.98 (12.65) | 41.64 (12.88) | 0.898 |
|
|
||||
| Positionc | ||||
| Forward | 39 (39.00) | 17 (45.95) | 22 (34.92) | 0.186d |
| Midfielder | 23 (23.00) | 11 (29.73) | 12 (19.05) | |
| Defender | 33 (33.00) | 8 (21.62) | 25 (39.68) | |
| Goalkeeper | 5 (5.00) | 1 (2.70) | 4 (6.35) | |
| Variable | ICC(2,1) | LCI | UCI | p |
|---|---|---|---|---|
| Lower extremity alignment | ||||
| Rearfoot angle in the prone position | 0.856 | 0.247 | 0.984 | 0.009** |
| Tibial varum | 0.826 | 0.057 | 0.987 | 0.030* |
|
|
||||
| Range of motion | ||||
| Weight-bearing dorsiflexion | 0.974 | 0.739 | 0.998 | 0.003** |
| Passive eversion | 0.874 | 0.206 | 0.976 | 0.017* |
| Passive inversion | 0.905 | 0.471 | 0.971 | 0.007** |
|
|
||||
| Static balance | ||||
| Foot lift test | 0.978 | 0.858 | 0.997 | <0.001*** |
|
|
||||
| Dynamic balance | ||||
| SEBT-ANT | 0.903 | 0.325 | 0.990 | 0.010* |
| SEBT-PM | 0.884 | 0.208 | 0.987 | 0.014* |
| SEBT-PL | 0.907 | 0.455 | 0.990 | 0.005** |
|
|
||||
| Coordination | ||||
| Side hop test | 0.954 | 0.831 | 0.994 | <0.001*** |
|
|
||||
| Ankle kinematics during running using video analysis | ||||
| Ankle joint angle in the sagittal plane | 0.942 | 0.635 | 0.994 | 0.002** |
| Ankle joint angle in the frontal plane | 0.958 | 0.582 | 0.996 | <0.001*** |
| Variable | LAS group | Control group | d | p |
|---|---|---|---|---|
| Demographic data | ||||
| Age (year) | 12.95 (0.91) | 13.37 (0.94) | −0.452 | 0.032* |
| Previous LAS historya | 25 (56.8) | 30 (19.2) | NA | <0.001***b |
| Number of LAS history (no.) | 1.32 (1.49) | 0.28 (0.67) | 1.139 | <0.001*** |
| Athletic career (year) | 3.56 (1.81) | 4.17 (2.02) | −0.314 | 0.130 |
| Total exposure (h) | 241.26 (20.43) | 244.10 (18.23) | −0.149 | 0.474 |
|
|
||||
| Self-reported questionnaire | ||||
| FAAM–ADL (%) | 96.24 (6.54) | 97.99 (4.40) | −0.331 | 0.114 |
| FAAM–Sport (%) | 94.26 (9.41) | 95.97 (7.92) | −0.201 | 0.332 |
|
|
||||
| Anthropometric data | ||||
| Height (m) | 1.62 (0.08) | 1.63 (0.10) | −0.107 | 0.444 |
| Body weight (kg) | 50.36 (8.32) | 55.14 (9.83) | −0.514 | 0.015* |
| BMI (kg/m2) | 19.16 (1.74) | 20.59 (2.09) | −0.766 | 0.001** |
| BMI-for-age percentile (%) | 57.92 (19.03) | 67.22 (21.31) | −0.453 | 0.031* |
| Leg length discrepancy (cm) | 0.55 (0.51) | 0.52 (0.42) | 0.066 | 0.788 |
|
|
||||
| Lower extremity alignment | ||||
| Rearfoot angle in the prone position (°) | 9.13 (2.38) | 8.72 (2.44) | 0.169 | 0.317 |
| Tibial varum (°) | 3.08 (1.27) | 2.87 (1.30) | 0.162 | 0.342 |
|
|
||||
| Range of motion | ||||
| Weight-bearing dorsiflexion (°) | 45.86 (6.12) | 47.70 (4.61) | −0.370 | 0.070 |
| Passive eversion (°) | 23.61 (8.66) | 22.01 (6.71) | 0.223 | 0.075 |
| Passive inversion (°) | 38.43 (6.56) | 36.34 (6.93) | 0.305 | 0.193 |
|
|
||||
| Static balance | ||||
| Foot lift test (no) | 14.11 (6.27) | 15.03 (6.36) | −0.145 | 0.400 |
|
|
||||
| Dynamic balance | ||||
| SEBT-ANT (%) | 64.61 (8.52) | 66.13 (8.36) | −0.181 | 0.291 |
| SEBT-PM (%) | 88.36 (11.18) | 90.15 (9.35) | −0.183 | 0.282 |
| SEBT-PL (%) | 84.72 (9.34) | 86.59 (8.88) | −0.208 | 0.225 |
| SEBT-Composite score (%) | 88.45 (8.49) | 89.52 (6.75) | −0.149 | 0.381 |
|
|
||||
| Coordination | ||||
| Side hop test (s) | 9.20 (1.14) | 8.86 (1.07) | 0.313 | 0.068 |
|
|
||||
| Ankle kinematics during running | ||||
| Preferred speed (m/s) | 2.69 (0.21) | 2.69 (0.35) | 0.000 | 0.946 |
| Dorsiflexion at initial contact (°)c | 1.59 (5.70) | −7.19 (3.33) | 2.213 | <0.001*** |
| Inversion at initial contact (°)c | 6.00 (1.82) | 3.11 (1.27) | 2.053 | <0.001*** |
| Maximum dorsiflexion (°)c | −16.27 (3.34) | −17.92 (2.38) | 0.630 | 0.003** |
| Maximum inversion (°)c | 8.11 (1.39) | 6.72 (1.03) | 1.243 | <0.001*** |
| Variable | Univariate logistic regression | Multivariate logistic regression | ||
|---|---|---|---|---|
|
|
||||
| OR (95% CI) | p | Adjusted OR (95% CI) | p | |
| Age | 0.658 | 0.028* | ||
| BMI | 0.760 | 0.003** | ||
| Previous LAS history | 5.526 | <0.001*** | ||
| Number of LAS history | 2.579 | <0.001*** | ||
| Dorsiflexion at initial contact | 1.677 | <0.001*** | 1.468 (1.254–1.719) | <0.001*** |
| Inversion at initial contact | 3.485 | <0.001*** | 2.662 (1.708–4.148) | <0.001*** |
| Maximum dorsiflexion | 1.277 | 0.001** | ||
| Maximum inversion | 2.686 | <0.001*** | ||
|
|
||||
| Constant=0.015, p<0.001*** | ||||
|
|
||||
| Overall model | χ2(2)=135.412, p<0.001*** | |||
| Nagelkerke R2 | 0.755 | |||
| Homer and Lemeshow test | χ2(8)=15.391, p=0.052 | |||
| Overall prediction accuracy | 95% | |||
| Variable | Cutoff point | Youden index | Sensitivity | Specificity | AUC | 95% CI | p |
|---|---|---|---|---|---|---|---|
| DF at IC | −0.35a | 0.735 | 0.864 | 0.872 | 0.927 | 0.879–0.974 | <0.001*** |
| IN at IC | 4.50a | 0.654 | 0.795 | 0.859 | 0.891 | 0.826–0.957 | <0.001*** |