Analysis of the best of five games of 11 points scoring system in singles badminton matches
International Journal of Applied Sports Sciences, Vol.28, No.2, pp.226-234
ⓒ Korea Institute of Sport Science
초록
A model based on the probability of the server winning the rally was employed to evaluate the influence of the newly proposed scoring system, the best of five games of 11 points scoring system, being experimented by the Badminton World Federation on singles badminton matches. The model, based on the assumption of statistical independence on each point’s outcome, was used to generate predictions ranging from the game- and match-winning probabilities to game- and match-length statistics for matches under both the new and the current scoring system, the best of three games of 21 points. Validity of these results was checked against tournament data, four sets each for the two scoring systems, as well as previously published results, with satisfactory agreement in most cases. The results show that duration of singles matches would be reduced noticeably under the new scoring system without affecting the match outcome of the current scoring system.
Abstract
A model based on the probability of the server winning the rally was employed to evaluate the influence of the newly proposed scoring system, the best of five games of 11 points scoring system, being experimented by the Badminton World Federation on singles badminton matches. The model, based on the assumption of statistical independence on each point’s outcome, was used to generate predictions ranging from the game- and match-winning probabilities to game- and match-length statistics for matches under both the new and the current scoring system, the best of three games of 21 points. Validity of these results was checked against tournament data, four sets each for the two scoring systems, as well as previously published results, with satisfactory agreement in most cases. The results show that duration of singles matches would be reduced noticeably under the new scoring system without affecting the match outcome of the current scoring system.
Introduction
Badminton is a sport enjoyed by millions around the world, and over the years, it has gone through several changes in scoring system regarding how a game or a match is to be won. In recent years, the changes were implemented, first under the auspices of the International Badminton Federation (IBF), and then later Badminton World Federation (BWF), in order to adapt the game’s characteristics to fit in with the changing times (Wikipedia, 2015). Most recent major overhaul of the rules was implemented in 2005 by the BWF in the form of a best of three games of 21 points scoring system (3⨯21 format). In an attempt to make the playing time even shorter and more predictable (BWF, 2014a), the BWF decided in 2014 to test a new rule, instating it in the BWF law of badminton (BWF, 2015) as one of the alternative scoring systems. Under this rule, a match would be decided by a best of five games of 11 points scoring system (5⨯11 format), with each game concluding at 11 points without a deuce or setting feature (BWF, 2014b). There have even been tournaments held under the experimental rule (BWF, 2014b) and some feedback from the players, trainers and fans in general on the new rule (Badzine, 2014).
A number of research have been performed in the past regarding the overall effects of rule changes in badminton and also other sports. Arias, Argudo, and Alonso (2011) presented a review of 139 studies dealing with rule modification in various sports, with an emphasis on classification of the studies. Wright (2014) gave a survey and an analysis of numerous articles covering competition rules in 21 different sports, focusing on the analytical methods employed and on issues of fairness and consequences of rule changes. There have also been published results on more specific influences of badminton rules changes on the temporal and notational aspects. Ming, Keong, and Ghosh (2008), for example, performed a time motion and notational analysis of 21-point and 15-point badminton match play for singles and found that the total number of shots and rallies in a match were significantly affected. Laffaye, Phomsoupha, and Dor (2015) analyzed the characteristics of six Olympic badminton men’s singles finals that were played under three different scoring systems through a longitudinal study and found a significant increase in the shot frequency but a substantial decrease in the effective play time and work density over the years. Some of the noteworthy work in the past involving modelling of a match with a probabilistic approach have focused on topics such as the game-winning probability based on combinatorics under the 21-point-game-with-setting rule (Hsi & Burych, 1971), advantages/disadvantages of serving first in men’s doubles under the ‘old’ rule (15-point game with side-out) (Marcotte, 1989), optimization of service type over the course of a singles match under the 3⨯21 format (Bedford, Barnett, & Ladds, 2010), and a simple analysis of the 3⨯21 format without including the serve effect (BadmintonCentral.com, 2010). Perhaps the most comprehensive work to this date is the article by Percy which addressed various issues pertaining to the rule change from the ‘old’ (3⨯15 format with side-out) to ‘current’ (3⨯21 format without side-out) systems (Percy, 2008).
In this paper, we present a direct comparison between the current 3⨯21 format and the experimental 5⨯11 format in regard to their influence on singles matches by using a probability model taking into account the service effect. Our analysis will focus on highlighting the game- and match-winning probabilities and also game- and match-lengths - as represented by the number of points played - associated with singles matches under the two respective scoring systems. It is hoped that the results of our study would help shed some light on how the 5⨯11 scoring system fares against the 3⨯21 format in the context of preservation of the match outcome characteristics and also effects on match-lengths. The significance of such an effort lies in that the BWF-sanctioned 5⨯11 format may be able to offer a viable option for managing badminton matches and tournaments, with the important advantage of requiring less time.
Model and analysis
We assume that the outcome of each point is a statistically independent and identically distributed event, which is determined solely by the point-winning probability associated with the server, taken to be constant throughout the course of a match. It is generally true that the outcome of each point, game, and even matches can depend on the previous outcomes as well as the current score, thereby making these events correlated to varying degrees in many cases. In spite of this, we have decided to employ the statistical independence assumption because incorporating such statistical dependences into the model is a very complex task and we wanted to focus on the direct consequences of the rule change instead. Thus, the model for a singles match is completely characterized by two parameters p1 and P2, each representing the probability that Player A or Player B wins the corresponding rally point when he or she has the serve. Let P(m,n,x) represent the probability that the score of the on-going game is m:n (Player A: Player B) with the ensuing serve belonging to Player x (x = 1, 2 for Players A, B, respectively) in a game first started with Player A’s serve. The recursive relations appropriate for calculations of P(m,n,x) are as follows:
where the initial conditions are such that P(0,0,1) = 1 and P(0,0,2) = 0 for Player A having the first serve in the game. This approach has also been used by several in the past (Bedford, Barnett, & Ladds, 2010; Brown, Barnett, & Pollard, 2008). Beginning with the first serve of the game, various running-scores and the associated probabilities of occurrence are generated in this manner as each additional rally point is played.
Game-winning probabilities and game-length statistics
For each game, there are four different possible cases to consider depending on the first server and the game winner. Let P1(2)game denote the probability that Player A(B) is the winner, given that Player A starts the game, and Q1(2)game the probability that Player A(B) is the winner, given that Player B starts the game. Note that P2game = 1-P1game and Q2game = 1-Q1game. Under the 5⨯11 format, the first player to reach 11 points wins the given game regardless of the final margin. Thus, Meanwhile, under the 3⨯21 format, the first player to reach 21 points, with the margin of at least two, wins the given game. In the event that the score reaches a 20-all tie, the players play by the deuce rule, in which the first to lead the opponent by two points takes the game, unless the score becomes 29-all wherein the winner of the next point, i.e., the first to reach the 30-point mark, wins the game (22:20, 23:21, ..., 30:28, 30:29). Therefore, the probability of Player A winning the game can be calculated by summing over the probabilities of all possible cases, namely P(21,n,1) (n = 0,1,…,19), P(m,m-2,1) (m = 22,23,…,30) and P(30,29,1). Q1(2)game can be obtained in a similar fashion.
Meanwhile, once the probability distribution of the game-ending scores is obtained as described above, it is straightforward to calculate the probability distribution of the total number of points (N = m + n) played in the game. The mean and standard deviation of N, which are related to the average and fluctuation of the game duration, respectively, can then be calculated in a simple manner,
Match-winning probabilities and match-length statistics
In both formats, the initial server of the first game is randomly determined, but thereafter, the winner of the previous game is awarded the first serve of following game. Here, it shall be assumed that each game is statistically independent, aside from the initial serve consideration just mentioned.
Let us first take the 3⨯21 format, in which the match-ending score must be either 2-0 (two-games-to-zero) or 2-1 (two-games-to-one) in favor of the winning player. The winning player must take the first two games in straight fashion in the 2-0 scenario (WW) and win one of the first two games and the last game, i.e., the third, in the 2-1 scenario (LWW or WLW). Thus, the probability of Player A winning by the first scenario is either P1game × P1game (when A serves first) or Q1game× P1game (when B serves first), depending on the first server. The probability of Player A winning via the second scenario is P1game × P2game × Q1game + P2game × Q1game × P1game (when A serves first) or Q1game × P2game × Q1game + Q2game × Q1game × P1game (when B serves first). The possible match-winning scores under the 5⨯11 format are 3-0, 3-1 and 3-2, with one (WWW), three (WWLW, WLWW, LWWW) and six sub-scenarios (WWLLW, WLWLW, WLLWW, LWWLW, LWLWW, LLWWW) in each respective case. The match-winning probability associated with each (sub-)scenario can be computed in a manner similar to that of the 3⨯21 format, with the exception of having to use this time the game-winning probabilities P1game, P2game, Q1game, and Q2game derived earlier for the 5⨯11 format. The overall match-winning probability for a given player can then be determined simply by adding the probabilities for all possible sub-scenarios in each format.
In the process of evaluating the match-winning probability as described above, it is possible to obtain the mean and variance of N, the total number of points in a match, associated with a particular match-winning scenario. By taking a weighted average of these quantities over all possible sub-scenarios, the overall expected values are derived.
Results
Three sample values of p1 (= 0.4, 0.5, 0.6) were chosen to demonstrate and distinguish the characteristics of the game under the 3⨯21 and 5⨯11 formats, while the value of P2, the corresponding probability of the opponent, was allowed to vary between 0 and 1 to account for possibilities of encountering an opponent of all skill levels.
Game- and match-winning probabilities
Before proceeding with presentation of the calculation results, it should be pointed out that the results of the previous works for the 3⨯21 format (Bedford, Barnett, & Ladds, 2010; BadmintonCentral.com, 2010; Percy, 2008) were reproduced exactly with our model when a direct comparison was possible. Figure 1 displays the game-winning probability of Player A, under the 5⨯11 and 3⨯21 formats, respectively, for the three different values of p1 (= 0.4, 0.5, 0.6). Clearly, the general trends between the two sets of curves are quite similar. As the value of P2 is increased from 0 toward p1, P1game decreases from 1, slowly at first and then more rapidly to 0.5. P1game continues to decrease toward 0 as P2 approaches 1, showing a saturation-like behavior near the end region. This general trend is more pronounced for the cases of the 3⨯21 format compared to those of the 5⨯11 format, which can be attributed to the fact that longer games of the former format enhance the skill-level discrepancy between the two players.
Figure 1.
The first server’s game-winning probability under two different scoring systems (the solid lines are for the 5⨯11 format and the broken lines are for the 3⨯21 format). The dependence on the opponent’s point-winning probability p2 is shown for three different values of the first server’s probability p1.
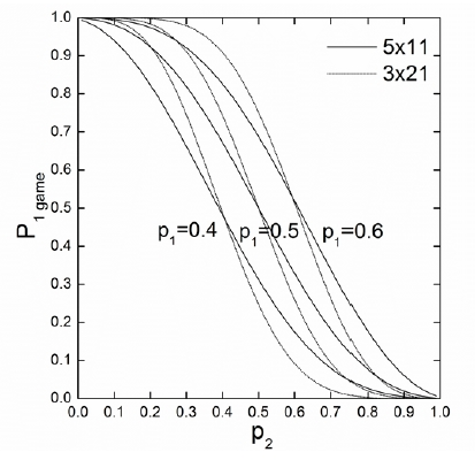
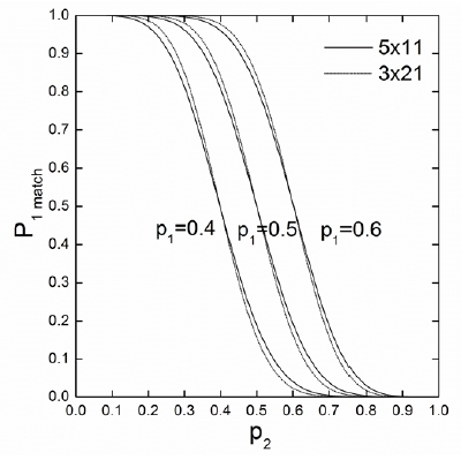
Figure 2 shows the match-winning probability of Player A under the 5⨯11 and 3⨯21 formats for p1 = 0.4, 0.5, 0.6. The match-winning probability curves are more saturated, i.e., flatter, in the end regions and steeper near the p1 = P2 location compared to the game-winning probability counterparts. The most important development is that the difference of match-winning probability under two different game formats has been drastically reduced across the entire range of P2, compared to the game-winning probability curves of Figure 1. Apparently, over the course of a match spanning more than one game, the differences due to the different scoring systems largely disappear, causing the match-winning probabilities for the two scoring systems to converge toward each other.
Figure 2.
The first server’s match-winning probability under two different scoring systems (the solid lines are for the 5⨯11 format and the broken lines are for the 3⨯21 format). The dependence on the opponent’s point-winning probability p2 is shown for three different values of the first server’s probability p1.
Game- and match-length statistics
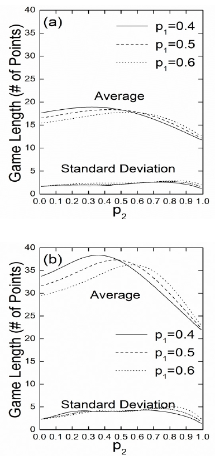
In the upper portion of Figures 3(a) and 3(b), the average number of points in a game is displayed for three different values of p1 under the two formats, again assuming that Player A serves first. In all figures, the average number of points in a game peaks in the vicinity of p1 = P2 - due to the evenly-contested nature of play (leading to longer games) - and falls off - albeit in an asymmetric manner - as the disparity between the two players grows. Also, note that both the peak and mean (averaged over P2) values of the average number of points are slightly higher for the p1 = 0.4 cases. This is so because when both p1 and P2 are low, e.g., in the case of p1 = 0.4 and P2 = 0.38 ~ 0.39, serves are expected to change hands more frequently as the server is more likely to lose the point than win it, thereby leading to a longer, see-saw type of game. If both p1 and P2 are high, on the other hand, as in the case of p1 = 0.6 and P2 = 0.59 for example, servers are expected to retain their serve longer, making it more likely to be able to string together consecutive points and leading to shorter games. The standard deviation of the number of points played in a game is displayed in the lower portion of Figures 3(a) and 3(b), respectively, for the three p1 values. Note that the standard deviation curve does not fluctuate much with P2 for all three p1 cases under both formats, remaining in the 2 ~ 3 and 4 ~ 5 ranges, respectively, for the most part, which represent only a small fraction of the average number of points in a game.
Figure 3.
The average and standard deviation of the number points played in a game (a) under the 5⨯11 format and (b) under the 3⨯21 format. They are shown as a function of the opponent’s point-winning probability p2 for three choices of p1 (solid lines are for p1 = 0.4, dashed lines for p1 = 0.5, dotted lines for p1 = 0.6).
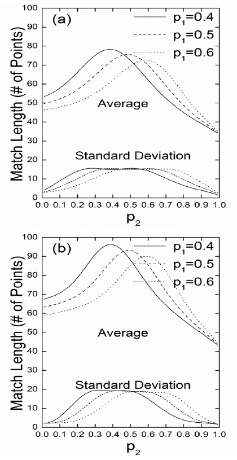
Next, the behavior of the average number of points in a match is displayed in the upper portion of Figures 4(a) and 4(b) for various combinations of p1 value and scoring format. It is seen that the average number of points per match is considerably lower under the 5⨯11 format compared to the 3⨯21 results across the board. The average number of points for a match ranges from 62 ~ 78 for the 5⨯11 format and from 75 ~ 97 for the 3⨯21 format, considering only the 0.4 ~ 0.6 range for P2. Finally, the standard deviation curves are shown in the lower portion of Figures 4(a) and 4(b). The curves exhibit a broad peak region in the 15 ~ 16 range for the 5⨯11 format and a substantially narrower peak region - indicating less sensitivity to P2 variation - in the 19 ~ 20 range for the 3⨯21 format, respectively.
Figure 4.
The average and standard deviation of the number points played in a match (a) under the 5⨯11 format and (b) under the 3⨯21 format. They are shown as a function of the opponent’s point-winning probability p2 for three choices of p1 (solid lines are for p1 = 0.4, dashed lines for p1 = 0.5, dotted lines for p1 = 0.6).
Discussion
Our model, as mentioned earlier, is very simple, and as such, it is imperative to check the predicted results against actual data of relevance in order to gain a measure of validation. In order to compare our calculation results against actual badminton matches, we analyzed a sample of tournament data available from a website (Tournament Software (http://www.tournamentsoftware.com)). While the tournament data cannot provide a direct means of verifying the predictions of game- and match-winning probabilities calculated from our model, it may still be possible to make some comparisons regarding the game- and match-length statistics under a reasonable set of assumptions.
Over the period of August 2014 to November 2014, 21 international tournaments (including 12 junior events) sanctioned by BWF were held using the 5⨯11 format (BWF, 2014b). Of these, men’s singles (MS) and women’s singles (WS) match results from four selected events representing various competition levels, geographical areas and calendar dates were used as sample data. The data from 264 MS and 163 WS match results were used for comparison against the results from our calculation. We calculated the average and the standard deviation for the number of games per match, number of points per match, and the match duration (in minutes). For comparison, we also selected four tournaments with similar attributes that employed the conventional 3⨯21 format, and the statistics of 273 MS and 138 WS matches played in those tournaments were analyzed.
The statistics regarding the match duration in minutes cannot be directly compared against our model, as the number of strokes or the time required to complete a rally is not incorporated in the model. However, it may still be possible to make a comparison between the tournament and model data regarding the statistics of the number of games per match and the number of points played per match under the following assumptions. One, the skill levels of the players that participated in the aforementioned tournaments span a certain range, which corresponds to the point-winning probability range of 0.3 ~ 0.7 in our model, and two, the probability distribution is uniformly distributed within that range. The range of 0.3 ~ 0.7 seems reasonable since it is expected that completely lop-sided matches are rather unlikely in competitive international matches. Under these assumptions, calculations can be made within our model for all cases within the probability grid of 0.3 < p1, p2 < 0.7 and the results averaged, which can then be compared against the tournament statistics.
The results for the 5⨯11 and 3⨯21 formats are summarized in Tables 1 and 2, respectively. Under the 5⨯11 format, the average number of games per match shows a range of 3.61 ~ 3.74 for MS matches and 3.29 ~ 3.57 for WS matches (with the standard deviation in the 0.63 ~ 0.75 range) compared to 3.78 ± 0.72 for our calculation result. The corresponding ranges are 2.15 ~ 2.35 for MS matches and 2.30 ~ 2.38 for WS matches (with the standard deviation in the 0.36 ~ 0.49 range) under the 3⨯21 format, respectively, compared to 2.30 ± 0.42 of our calculation. The average number of points per match spans the range of 62.20 ~ 66.79 points for MS matches and 54.42 ~ 64.26 for WS matches (with the standard deviation in the 13.12 ~ 16.90 range) under the 5⨯11 format and 73.64 ~ 83.14 for MS matches and 79.06 ~ 86.04 for WS matches (with the standard deviation in the 16.60 ~ 21.44 range) under 3⨯21 format. The corresponding theoretical results, on the other hand, are 67.11 ± 14.22 and 81.95 ± 16.23, respectively. Thus, it appears that there is a fairly good agreement between the tournament and the analysis data. Also, note that the average match time is considerably shorter - by more than several minutes in most cases - for the 5⨯11 tournaments for both MS and WS matches, whereas the difference in the match time fluctuation between the two sets of tournaments is generally only a couple of minutes or less. The fact that the match-durations are significantly shorter in the 5⨯11 tournaments may be of paramount interest from a tournament organizer standpoint as there should be more flexibility and margin of error in scheduling the matches and managing the tournament.
Table 1.
Summary of match length statistics under the 5 ⨉ 11 format
| Yonex Dutch Open (Grand Prix) |
Brazil International Badminton Cup (Int. Challenge) |
Fernbaby Auckland International (Int. Series) |
Bulgaria Eurasia Open (Future Series) |
Our Calculation | |||||
|---|---|---|---|---|---|---|---|---|---|
| <MS > | < WS > | < MS > | < WS > | < MS > | < WS > | < MS > | < WS > | ||
| No. of games | 3.73 ±0.75 |
3.57 ±0.74 |
3.72 ±0.73 |
3.29 ±0.64 |
3.61 ±0.72 |
3.52 ±0.68 |
3.74 ±0.75 |
3.38 ±0.63 |
3.78 ±0.72 |
| No. of points | 66.45 ±15.55 |
64.26 ±14.97 |
64.99 ±16.27 |
54.42 ±15.92 |
62.20 ±16.52 |
59.00 ±16.90 |
66.79 ±15.56 |
59.78 ±13.12 |
67.11 ±14.22 |
| Match length(min.) | 30.52 ±9.96 |
29.40 ±10.14 |
34.10 ±11.64 |
27.04 ±10.72 |
26.82 ±10.89 |
24.10 ±10.21 |
29.62 ±9.78 |
26.20 ±8.13 |
|
Table 2.
Summary of match length statistics under the 3 ⨉ 21 format
| Scottish Open (Grand Prix) |
Lagos International (Int. Challenge) |
OUE Singapore International Series (Int. Series) |
Yonex Riga International (Future Series) |
Our Calculation | ||||||
|---|---|---|---|---|---|---|---|---|---|---|
| < MS > | < WS > | < MS > | < WS > | < MS > | < WS > | < MS > | < WS > | |||
| No. of games | 2.35 ±0.48 |
2.32 ±0.47 |
2.15 ±0.36 |
2.30 ±0.47 |
2.26 ±0.44 |
2.30 ±0.46 |
2.29 ±0.46 |
2.38 ±0.49 |
2.30 ±0.42 |
|
| No. of points | 83.14 ±20.08 |
82.27 ±18.96 |
73.64 ±16.60 |
79.06 ±21.44 |
78.35 ±20.22 |
79.60 ±19.67 |
79.96 ±20.36 |
86.04 ±20.83 |
81.95 ±16.23 |
|
| Match length (min.) |
38.61 ±14.00 |
36.12 ±10.84 |
30.63 ±13.02 |
27.78 ±10.15 |
32.67 ±11.95 |
33.58 ±12.35 |
35.98 ±11.10 |
36.43 ±9.76 |
||
At this point, we would like to address the issue of the ‘first-serve’ effect, namely whether and if so when it is advantageous to be the first server in the game. Although the results are not included here, it can be shown that the game-winning probability is greater for the first server, provided pj > 1- pi, where pi and pj are the point-winning probabilities of the first server and first receiver, respectively. The first server is also at an advantage when two players of identical skill-levels with p1 (= P2) > 0.5 are facing each other, which might require a counter-measure of some sort to offset such bias. These first-serve effects, though inherent in both scoring formats on game and match levels, are generally more pronounced for the 5⨯11 cases due to the fewer number of points involved.
Conclusion
The experimental 5⨯11 scoring system appears to offer an attractive alternative to the current 3⨯21 counterpart based on the analysis presented in this paper. Results were generated based on the probabilistic analysis of a two-parameter model and partially validated by a statistical analysis of data from eight tournament results. The findings suggest that singles matches would tend to be completed in less number of points and time under the 5⨯11 format, with the characteristics of the match outcome hardly changed from those of the current 3⨯21 format. To wit, the new rule is more forgiving - less sensitive - to the player’s skill-level difference insofar as a single game’s outcome is concerned, but the eventual match winner is highly unlikely to change, even under the new rule. The variation of the match length, on the other hand, is not expected to decrease noticeably under the 5⨯11 system. At least from the quantitative standpoint then, these preliminary findings imply that singles matches in the trial format might perhaps be more exciting to watch from the viewers' perspective and more appealing to tournament organizers and broadcasting partners. Shorter matches would mean that the viewers would be able to concentrate on the matches more while the tournament organizers would be able to schedule more matches in a given time duration and/or with more room to cope with late-running matches. We conclude with a remark that the analysis presented here represents only a first attempt at predicting the potential consequences of the scoring system change, and possible impact on other aspects of the game need to be examined as well for a more complete assessment.