A critical evaluation of the aerobic capacity demands of elite male soccer players
International Journal of Applied Sports Sciences, Vol.28, No.2, pp.200-212
ⓒ Korea Institute of Sport Science
초록
The present review investigate whether aerobic capacity of elite male soccer players has changed over the past 30-40 years, and sought to establish an improved estimate of aerobic capacity based on results reported in the literature. A systematic review of manuscripts reporting the match distance covered and/or the VO2max of elite male soccer players was performed. Eighteen studies (published between 1967 and 2010) reporting the total distance covered and representing 14 countries (3,833 players), and 25 studies (published between 1975 and 2012) reporting VO2max and representing 22 countries (1,921 players) were selected for analysis. Little, if any, relationship existed between the mean match play distance covered/VO2max and the year of measurement/reporting. An improved estimate of the match play distance covered was calculated as 10,418 m with a pooled standard deviation of ± 933 m (95% confidence interval [CI] = 10,053 – 10,783 m) and a maximum mean of 12,650 m and minimum of 8,638 m. In addition, the improved estimate of the VO2max was calculated as 59.38 mL∙kg⁻1∙min⁻1, with a pooled standard deviation of ± 3.74 mL∙kg⁻1∙min⁻1 (95% CI = 57.99 – 60.78 mL∙kg⁻1∙min⁻1) and a maximum mean of 67.6 mL∙kg⁻1∙min⁻1, and a minimum of 52.1 mL∙kg⁻1∙min⁻1. The results suggest that distance covered and VO2max in elite male soccer players have been stable over the period from 1967 to 2012 and that aerobic metabolism is the major source of energy during the match. Thus, soccer players must possess a minimum aerobic capacity to cover the total match distances and to recover from high-intensity action.
Abstract
The present review investigate whether aerobic capacity of elite male soccer players has changed over the past 30-40 years, and sought to establish an improved estimate of aerobic capacity based on results reported in the literature. A systematic review of manuscripts reporting the match distance covered and/or the VO2max of elite male soccer players was performed. Eighteen studies (published between 1967 and 2010) reporting the total distance covered and representing 14 countries (3,833 players), and 25 studies (published between 1975 and 2012) reporting VO2max and representing 22 countries (1,921 players) were selected for analysis. Little, if any, relationship existed between the mean match play distance covered/VO2max and the year of measurement/reporting. An improved estimate of the match play distance covered was calculated as 10,418 m with a pooled standard deviation of ± 933 m (95% confidence interval [CI] = 10,053 – 10,783 m) and a maximum mean of 12,650 m and minimum of 8,638 m. In addition, the improved estimate of the VO2max was calculated as 59.38 mL∙kg⁻1∙min⁻1, with a pooled standard deviation of ± 3.74 mL∙kg⁻1∙min⁻1 (95% CI = 57.99 – 60.78 mL∙kg⁻1∙min⁻1) and a maximum mean of 67.6 mL∙kg⁻1∙min⁻1, and a minimum of 52.1 mL∙kg⁻1∙min⁻1. The results suggest that distance covered and VO2max in elite male soccer players have been stable over the period from 1967 to 2012 and that aerobic metabolism is the major source of energy during the match. Thus, soccer players must possess a minimum aerobic capacity to cover the total match distances and to recover from high-intensity action.
Introduction
High performance in soccer depends on several physical, physiological, psychological, and psychomotor characteristics. Technical and tactical skills have been defined as the most important factors contributing to success (Reilly, Bangsbo, & Franks, 2000; Sporis, Jukic, Ostojic, & Milanovic, 2009). However, to utilize those technical and tactical skills during game play, players must cope with the physical demands of the game (Bangsbo, 1994). The duration of the match and the high-intensity actions observed outline the importance of high aerobic and anaerobic capacity (Castagna, Impellizzeri, Chauachi, & Manzi, 2013; Ingebrigtsen, Shalfawi, Tonnessen, Krustrup, & Holtermann, 2013). To quantify the aerobic and anaerobic energy contribution, previous investigations have analysed the distance covered at various intensities during the match play using methods such as recording information on a tape recorder, analysing digital video, and using player-tracking transmitters and global positioning systems (Bangsbo, Norregaard, & Thorso, 1991; Di Salvo et al., 2010; Di Salvo, Pigozzi, Gonzalez-Haro, Laughlin, & De Witt, 2013; Mohr, Krustrup, & Bangsbo, 2003; Reilly & Thomas, 1976). Furthermore, to determine the physiological parameters that contribute to these energy demands, soccer players’ energy expenditure, heart rate monitoring, blood lactate concentration, and VO2max have been measured and reported (Bangsbo, 1994; Helgerud, Engen, Wisloff, & Hoff, 2001; Ingebrigtsen et al., 2013; Reilly, 2003; Reilly et al., 2000; Wisloff, Helgerud, & Hoff, 1998).
The results from these investigations showed that the distance covered during a soccer match depends on the player’s position and playing tactics (Tumilty, 1993). Field soccer players have been shown to cover a distance of 10–14 km during a 90-min match (Reilly, 1997; Stolen, Chamari, Castagna, & Wisloff, 2005), with 5–10% less distance covered in the second half compared to the first half (Bangsbo et al., 1991; Mohr et al., 2003; Stolen et al., 2005). Furthermore, the distance covered has been categorized as 24% walking, 20% cruising, 36% jogging, 11% sprinting, 7% moving backward, and 2% moving in possession of the ball (Reilly, 1997, 2003, 2007). A later investigation of the English FA Premier League categorized the distance covered as 5.6% standing, 59.3% walking, 26.1% jogging, and 9% high-intensity running (consisting of 6.4% running, 2% high speed running, and 0.6% sprinting) (Bradley et al., 2009). The average intensity as a function of VO2max during a full match has been reported to be 70–75% of the player’s VO2max (Reilly, 2007). In addition, a statistical significant correlation between VO2max and the distance covered during a match has been reported (Reilly, 2003). Helgerud et al. (2001) reported that an increase in VO2max from 58.1 mL∙kg⁻1∙min⁻1 to 64.3 mL∙kg⁻1∙min⁻1 (10.8%) led to a 20% increase in the distance covered during a match in a training group compared to that in a control group. Reilly et al. (2000) reported that the energy expenditure during a 90-min match for a 75-kg male with a VO2max of 60 mL kg⁻1 min⁻1 was approximately 5,700 kJ, with an average intensity close to 70% of VO2max. Further studies have reported that VO2max for elite male players is 56–69 mL∙kg⁻1∙min⁻1 (Reilly, 2003, 2007; Reilly et al., 2000). Higher values were also observed in Norwegian elite male soccer players (Helgerud et al., 2001; Wisloff et al., 1998). Tonnessen, Hem, Leirstein, Haugen, & Seiler (2013) reported that VO2max did not differ between junior and senior players and was in the range of 62–64 mL∙kg⁻1∙min⁻1. Furthermore, indirect measures of energy expenditure have been studied using heart rate monitoring as a predictor of VO2max (Bangsbo, 1994; Florida-James & Reilly, 1995; Ogushi, Ohashi, Nagahama, Isokawa, & Suzuki, 1993).
The average intensity, measured as a percentage of the maximal heart rate during the entire match, has been reported to be 80–90% of the maximum heart rate (HRmax; 155–171 bpm) (Bangsbo, 1994; Florida-James & Reilly, 1995; Helgerud et al., 2001; Ogushi et al., 1993; Reilly, 2003), suggesting a relative metabolic loading of approximately 75% of VO2max (Reilly, 1997). This is further supported by laboratory gas analyses, which indicate that for a typical player to cover a distance of 10–14 km during a 90-min game at a steady pace, 35 mL∙kg⁻1∙min⁻1 would be required, corresponding to 70% of the HRmax (Tumilty, 1993). However, the high linear relationship observed between HRmax and VO2max during intermittent and continuous treadmill testing (Alexandre et al., 2012) suggests that an HR of 80–90% of the HRmax observed during a match could be caused by other intermittent and high-intensity activities, psychological arousal, and environmental effects. Therefore, HR as a predictor of VO2max in soccer has been criticized because it overestimates the actual O2 consumption (Reilly, 1997). Helgerud et al. (2001) concluded that expressing the intensity using the average HR over 90 min is not fully representative since it does not account for periods of high-intensity activities, which is in line with the conclusion that HR measures could be a useful index of the overall physiological strain (Reilly & Thomas, 1976). Blood lactate measures during a soccer match have been reported to be 4.4–5.6 mmol∙l⁻1 in the first half of the game and 3.9–4.7 mmol∙l⁻1 in the second half of the game (Bangsbo et al., 1991; Florida-James & Reilly, 1995; Reilly, 2003). In addition, blood lactate measures during soccer training have been reported to be 2.7–10.7 mmol∙l⁻1, depending on the exercise intensity and type of training (Drust & Gregson, 2013). Furthermore, lactate accumulation has been reported to occur during periods of high-intensity activity, and a 5-min reduction in performance of 12% has been reported to occur after five minutes of high-intensity activity (Mohr et al., 2003). Therefore, it has been suggested that high VO2max and endurance training are vital in clearing lactate accumulation and shifting the lactate curve to the right, respectively (Reilly, 2007; Stolen et al., 2005).
The variations in the reported match distance covered and VO2max test results from different studies make the task of establishing a reference value for the aerobic demand in soccer a difficult task. Therefore, the purpose of the present investigation was to integrate and critically evaluate data from independent studies that have reported distance covered and/or VO2max test results for elite male soccer players during the period 1967–2012, and investigate whether the demand for aerobic capacity has changed over time. A secondary purpose of this paper was to revise and update the current value by establishing an improved estimated value of the aerobic demands based on an analysis of these independent reports.
Methods
Research design
An analytical research approach was adopted, which focused on a systematic and critical evaluation of the reported distance covered and VO2max of elite male soccer players during the period 1967–2012. Data collection was conducted during summer 2013.
Sampling of Studies
A systematic literature search was performed using the local university database, PubMed, ProQuest, SPORTDiscus, and MedLine. The following search terms were used: ‘aerobic capacity in soccer’, ‘aerobic capacity in male soccer players’, ‘aerobic capacity in male football players’, ‘aerobic capacity and soccer’, ‘aerobic capacity and football’, ‘aerobic capacity in top soccer players’, ‘aerobic capacity in top football players’, ‘aerobic capacity demands’, ‘aerobic capacity requirements’, ‘aerobic capacity and soccer game analyses’, ‘aerobic capacity and football game analyses’, ‘aerobic capacity training for soccer players’, ‘aerobic capacity training for football players’, ‘endurance in soccer’, ‘endurance in football’, ‘endurance in top soccer team’, ‘endurance in top football team’, ‘aerobic capacity and time motion analyses’, ‘soccer game analyses’, ‘football game analyses’, ‘distance covered in soccer’, ‘distance covered in football’, ‘VO2 in soccer’, ‘VO2 in football’, ‘VO2max in soccer’, ‘VO2max in football’, ‘VO2max and soccer’, ‘VO2max and football’, ‘VO2max in top soccer’, ‘VO2max in top football’, ‘maximal oxygen uptake and soccer’, and ‘maximal oxygen uptake and football’. In addition, a manual literature search was performed using the reference lists of the articles identified during the initial literature search.
Selection Criteria
The independent studies selected for inclusion in the present study fulfilled the following criteria: (a) the study included the reporting of male soccer players at a national team level and/or premium division, (b) the study reported the total distance covered during a soccer match and/or VO2max test results, (c) the study reported the mean and standard deviation, and (d) the study was published in a peer-reviewed journal and/or peer-reviewed conference proceeding and/or peer-reviewed book between 1960 and 2013.
The following characteristics were recorded for studies that fulfilled the inclusion criteria: author(s), measurement year, country of origin, sample size, playing level, mean and standard deviation of the reported total distance covered, and VO2max test results. If the measurement year was not reported, the publication year was used. If the measurements were conducted over several years, the average year was used as the measurement year.
Data analysis
Data were transferred to IBM SPSS Statistics Version 21 for windows (IBM Corp, Armonk, NY: IBM Corp) and GraphPad Prism 6 for Windows (GraphPad Software, Inc., La Jolla, CA, USA) for further analyses.
The normality of the data for both distance covered and VO2max was first tested using the Shapiro-Wilk test, which indicated that the reported distance covered was normally distributed, while VO2max was not. In addition, a careful examination for extreme values was applied to the data using the “Robust regression and Outlier removal” method described by Motulsky and Brown (2006). One extreme VO2max test value (reported in 1988; Figure 1 & Table 2) was detected, while no extreme values were detected for the total distance covered. A second test of normality showed that after removing the extreme value, the VO2max followed a normal distribution.
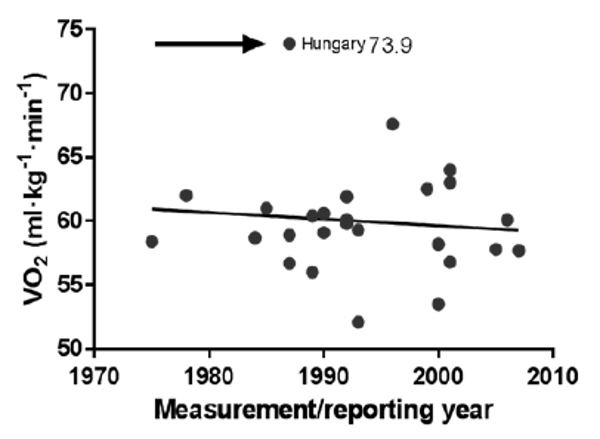
Table 1.
Reported elite male soccer players’ total distance covered.
| Study | Year | Playing level | Country | N | Distance covered (m) | Standard deviation (m) |
|---|---|---|---|---|---|---|
| Zelenka, Seliger, and Ondrej (1967) | 1967 | Premier division | Czechoslovakia | 1 | 11500 | 0 |
| Agnevic (1970)* | 1970* | Premier division* | Sweden* | 10* | 10200* | |
| Whitehead (1975) | 1975 | Premier division | UK | 2 | 12650 | 1665 |
| Reilly and Thomas (1976) | 1976 | Premier division | UK | 40 | 8680 | 1011 |
| Ekblom (1986) | 1986 | Premier division | Sweden | 10 | 10067 | 183 |
| Ohashi, Togari, Isokawa, and Suzuki (1988) | 1987 | National team | Japan | 4 | 9845 | 626 |
| Bangsbo et al. (1991) | 1991 | Premier division | Denmark | 14 | 10800 | 860 |
| Thatcher and Batterham (2004) | 1998 | Premier division | UK | 12 | 9741 | 882 |
| Rienzi, Drust, Reilly, and Martin (2000) | 2000 | International competition | SA | 17 | 8638 | 1158 |
| Premier division | UK | 6 | 10104 | 703 | ||
| Barros et al. (2007) | 2003 | Premier division | Brazil | 55 | 10012 | 1024 |
| Di Salvo et al. (2007) | 2003 | Premier division | Spain | 300 | 11393 | 1016 |
| Mohr et al. (2003) | 2003 | National team players | EU | 18 | 10860 | 180 |
| Vigne, Gaudino, Rogowski, Alloatti, and Hautier (2010) | 2004 | Premier division | Italy | 25 | 8930 | 3515 |
| Vigne et al. (2013) | 2005 | Premier division & Championship league | Italy | 10 | 10649 | 602 |
| 2006 | 10463 | 614 | ||||
| 2007 | 10076 | 725 | ||||
| Di Salvo et al. (2013) | 2008 | Premier division & Championship league | UK | 1241 | 10746 | 964 |
| EU | 1494 | 11102 | 916 | |||
| Weston, Drust, and Gregson (2011) | 2009 | Premier division | UK | 488 | 10794 | 374 |
| Andrzejewski, Chmura, Pluta, and Kasprzak (2012) | 2009 | UEFA | EU | 31 | 11288 | 734 |
| Duk et al. (2011) | 2010 | National team (world cup) | Korean Republic | 11 | 10280 | 900 |
| Spain | 11 | 10620 | 1190 | |||
| The Netherlands | 11 | 10330 | 1120 | |||
| Germany | 11 | 10330 | 980 | |||
| Uruguay | 11 | 10560 | 1160 |
Table 2.
Reported elite male soccer players’ VO2max test values.
| Study | Country | Median year | Playing level | N | VO2max (mL kg-1 min-1) |
Standard deviation |
|---|---|---|---|---|---|---|
| Raven, Gettman, Pollock, and Cooper (1976) | USA | 1975 | Premier division | 18 | 58.4 | 1.0 |
| Holmann et al. (1981) | Germany | 1978 | National team | 17 | 62.0 | 4.5 |
| Ekblom (1986)* | Sweden* | 1985* | Premier division* | 61.0* | ||
| Faina et al. (1988) | Italy | 1987 | Premier division | 27 | 58.9 | 6.1 |
| Apor (1988)** | Hungary** | 1987** | National team** | 8** | 73.9** | 10.8** |
| Vanfraechem and Tomas (1992) | Belgium | 1987 | Premier division | 18 | 56.7 | 8.0 |
| Davis, Brewer, and Atkin (1992) | UK | 1989 | Premier division | 122 | 60.4 | 3.0 |
| Rahkila and Luthanen (1989) | Finland | 1989 | Premier division | 31 | 56.0 | 3.0 |
| Bangsbo et al. (1991) | Denmark | 1990 | Premier and first division | 14 | 60.6 | 1.0 |
| Chin, Lo, Li, and So (1992) | China | 1990 | Premier division | 24 | 59.1 | 4.9 |
| Bunc, Heller, and Procházka (1992) | Czechoslovakia | 1992 | Premier division | 15 | 61.9 | 4.1 |
| Heller, Procházka, Bunc, Dlouhá, and Novotný (1992) | Czechoslovakia | 1992 | Premier division | 12 | 60.1 | 2.8 |
| Adhikari and Das (1993) | India | 1993 | National team | 18 | 59.3 | 4.8 |
| Matkovic, Jankovic, and Heimer (1993) | Croatia | 1993 | Premier division | 44 | 52.1 | 10.7 |
| Puga et al. (1993) | Portugal | 1992 | Premier division | 21 | 59.8 | 3.3 |
| Wisloff et al. (1998) | Norway | 1996 | Premier division | 14 | 67.6 | 4.0 |
| Arnason et al. (2004) | Iceland | 1999 | Premier and first division | 225 | 62.5 | 4.8 |
| Ostojić (2000) | Serbia | 2000 | Premier division | 16 | 53.5 | 8.6 |
| Aziz, Chia, and Teh (2000) | Singapore | 2000 | National team | 23 | 58.2 | 3.7 |
| Al-hazzaa et al. (2001) | Saudi Arabia | 2001 | National team | 23 | 56.8 | 4.8 |
| Sotiropoulos, Travlos, Gissis, Souglis, and Grezios (2009) | Greece | 2005 | Premier division | 58 | 57.8 | 2.6 |
| Sporis et al. (2009) | Croatia | 2006 | Premier division | 270 | 60.1 | 2.3 |
| Boone, Vaeyens, Steyaert, Bossche, and Bourgois (2012) | Belgium | 2007 | Premier division | 289 | 57.7 | 4.7 |
| Tonnessen et al. (2013) | Norway | 2001 | National team | 52 | 64.0 | 1.0 |
| Premier division | 546 | 63.0 | 1.0 | |||
| Rhodes, Mosher, McKenzie, Franks, and Potts (1986) | Canada | 1984 | National team | 16 | 58.7 | 4.1 |
Given the established normality, a Pearson’s product-moment correlation coefficient was used to quantify the degree of the relationship between the distance covered/ VO2max test values and the reporting or measurement year. Results were considered statistically significant at p ≤ 0.05. To achieve an improved estimate of the aerobic demands for elite male soccer players, a reference value was calculated based on the mean and pooled standard deviation of the independent studies. The pooled standard deviation was determined according to the “assignment and presentation of uncertainties of thermodynamic results” (Olofsson, Angus, Armstrong, & Kornilov, 1981). Studies with more than one participant that did not report standard deviation were not included in the estimation of the reference value.
RESULTS
The final number of independent studies included in the present brief review was 18 studies (published between 1967 and 2010, representing 14 countries and 3,833 players) for the total distance covered (Table 1) and 25 studies for VO2max (published between 1975 and 2012, representing 22 countries and 1,921 players; Table 2).
Little, if any, relationship existed between the reported distance covered during a match and the measurement or reporting year (Figure 2 (a)), with a variance of less than 0.5%. An improved estimate of the match distance covered based on data from 3,833 male premier and national team players was calculated as 10,418 m, with a pooled standard deviation of ± 933 m (95% confidence interval [CI] = 10,053 – 10,783 m; maximum mean = 12,650 m; minimum mean = 8,638 m) (Figure 2 (b)).
Figure 2.
The relationship between the distance covered and reporting/measuring year (a), the improved estimate of the match play distance covered (b), the relationship between VO2max and the reporting/measuring year (c), and the improved estimate of VO2max (d) based on the data in Table 1 and 2.
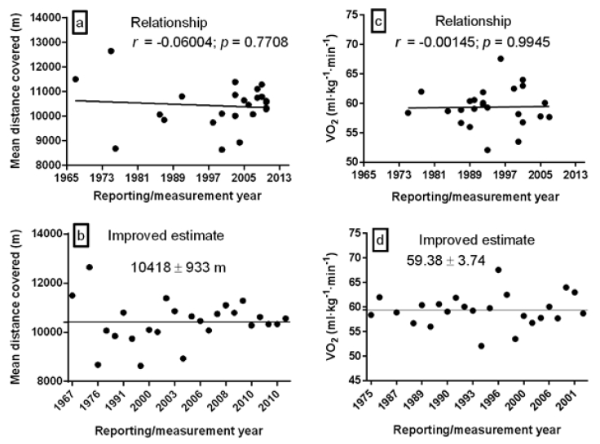
Similarly, little, if any, relationship existed between the reported VO2max test values and the measurement or reporting year (Table 2; Figure 2 (c)), with a variance of less than 0.1%. An improved estimate of the VO2max reference value reflecting the aerobic demands based on 1,921 male premier or national team players was calculated as 59.38 ml∙kg⁻1∙min⁻1, with a pooled standard deviation of ± 3.74 ml∙kg⁻1∙min⁻1 (95% CI = 57.99 – 60.78 mL∙kg⁻1∙min⁻1; maximum mean = 67.6 mL∙kg⁻1∙min⁻1; minimum mean = 52.1 mL∙kg⁻1∙min⁻1) (Figure 2 (d)).
DISCUSSION
The main purpose of the present brief review was to critically evaluate whether the total distance covered in a soccer match and the aerobic capacity as a function of VO2max (mL∙kg⁻1∙min⁻1) have changed as the game has developed over the period between 1967–2012, and to revise and update an improved estimate of soccer players’ VO2max, which can be used as a practical reference value for aerobic capacity demand. However, the main findings showed no worthwhile interaction between the total distance covered and measurement/reporting year (Figure 2 (a)), or between VO2max and the measurement/reporting year (Figure 2 (c)). An improved estimate of the match distance covered was calculated as 10,418 ± 933 m (Figure 2 (b)), and an improved estimate of VO2max was calculated as 59.38 ± 3.74 mL∙kg⁻1∙min⁻1 (Figure 2 (d)).
The improved estimate of the match distance covered calculated in the present brief review is in line with measures collected and reported from the 1960s (Zelenka et al., 1967), 1970s (Whitehead, 1975), 1980s (Ekblom, 1986; Ohashi et al., 1988), 1990s (Bangsbo et al., 1991; Thatcher & Batterham, 2004), and after the year 2000 (Barros et al., 2007; Mohr et al., 2003; Reilly, 2003; Vigne et al., 2013; Vigne et al., 2010). The historical importance of the total distance covered has been outlined as a useful global measure of the total work done during a 90-min match by each individual player (Bangsbo, 1994; Reilly, 1997). This work is based on the laws of physics, where work is the product of force (i.e., muscle force) exerted on the player’s body (i.e., object) and the distance the body moves in the direction in which the force is exerted (McBride, 2016). This in turn indicates that the total work conducted by players could differ from game to game (Bangsbo, 1994; Reilly, 1997) and depends, among other factors, on the players’ position, playing tactics (Tumilty, 1993), fatigue (Mohr et al., 2003), match location, and level of opposition (Paul, Bradley, & Nassis, 2015). However, these facts contradict with the reported findings in which the overall distance covered by the players did not have a worthwhile difference between matches (Dellal, Lago-Penas, Rey, Chamari, & Orhant, 2015), and studies that have reported differences in the distance covered between matches (Bangsbo et al., 1991; Reilly & Thomas, 1976) indicating that none of those factors could in fact explain the differences observed.
Nevertheless, the majority of reported studies clearly indicate that the use of the distance covered as a reflection of match demands has its limitations because players do not always utilize their maximum physical capacity, which makes the total distance covered a weak indicator of the player’s physical performance during gameplay (Bangsbo et al., 1991; Dellal et al., 2015; Mohr et al., 2003; Raven et al., 1976). For example, an increase of 20% in the total distance covered based on an increase in VO2max from 58.1 mL∙kg⁻1∙min⁻1 to 64.3 mL∙kg⁻1∙min⁻1 (10.8%) has been reported in an intervention study (Helgerud et al., 2001), and an improvement of 5% in running economy has been estimated to cause an increase in match distance by about 1,000 m (Hoff & Helgerud, 2004). These results could be misleading, without considering other factors that might affect the total distance covered during gameplay. In contrast, the high-intensity actions observed during gameplay indicate that improved aerobic capacity could affect the player’s recovery by removing lactate during low-intensity periods (Reilly, 1997), supporting the conclusion that improved aerobic capacity could in fact reflect on and increase the number of anaerobic sprints (McMillan, Helgerud, Macdonald, & Hoff, 2005). Therefore, the fact that soccer players combine complex physical qualities during gameplay suggests that analysing power (i.e., the time rate of doing work or explosive strength) could be more important than considering only the total distance covered in understanding the physical demands of the game (Raven et al., 1976). However, the stability in the total distance covered reported in the past three decades and the improved estimate of the total distance covered of 10,418 ± 933 m (Figure 2 (b)) outlines and support that aerobic metabolism is the major source of energy during a soccer match (Bangsbo & Iaia, 2013).
Several methods have been used to measure the energy consumption during matches, including Douglas bags or portable telemetric devices (Reilly, 1997). However, these methods have limitations as they must be used during the game (Alexandre et al., 2012; Reilly, 1997). Furthermore, several attempts have been made to develop aerobic capacity, and therefore a test value has been reported (Table 2). However, the upper limit of the aerobic capacity of a player is, to a certain extent, dependent on genetic factors (Reilly, 2007), and the limiting factors of well-trained individuals have been reported to be primarily caused by the heart’s ability to pump blood (Hoff & Helgerud, 2004). Therefore, laboratory tests of VO2max are essential in establishing the aerobic capacity demands of soccer players (i.e., Table 2). To set the demand for soccer players based on the historical results presented in the literature, Reilly et al. (2000) reported that a VO2max of > 60 mL∙kg⁻1∙min⁻1 is the lower limit for an individual soccer player to be able to succeed in elite soccer. Furthermore, Stolen et al. (2005) indicated that the reference value has to be adjusted upwards because the game of soccer has developed in recent years. Therefore, they suggest a VO2max of 70 mL∙kg⁻1∙min⁻1 for a 75-kg professional soccer player as the lower limit for a soccer player to succeed at the elite level. Tonnessen et al. (2013) reported that a VO2max of about 62–64 mL∙kg⁻1∙min⁻1 would be enough to fulfil the demands of aerobic capacity in elite male soccer players. However, examining the relationship between measures of VO2max and success, Arnason et al. (2004) conducted a study of 20 soccer teams that participated in the Icelandic elite and first division during the 1999 season and reported no relationship between VO2max and team success, which was described as the team’s standing at the end of the season. Furthermore, Tonnessen et al. (2013) did not find any differences in VO2max between the national team and first division, second division, and junior team players. These reports, combined with the trivial relationship detected in the present brief review between VO2max and the measurement or reporting year (Figure 2 (c)), indicate that VO2max has been constant with no worthwhile change in the last three decades. Therefore, the calculated value of 59.38 ± 3.74 mL∙kg⁻1∙min⁻1 (Figure 2 (d)) could be a proper reference to fulfil the energy demand of the aerobic energy system in male elite soccer players. The values in this review are in line with and support the recommendations made by Tumilty (1993) and Reilly et al. (2000), but they strongly contradict the demands reported by Stolen et al. (2005), who indicated that the reference values of aerobic capacity must be adjusted to 70 mL∙kg⁻1∙min⁻1 for a 75-kg professional soccer player as the lower limit. We believe that Stolen et al. (2005) constructed their conclusion based on the reported VO2max of about 74 ± 10.8 mL∙kg⁻1∙min⁻1 (Table 2). However, a careful examination of the reported results indicates that this value is a historically extreme value (Figure 1; Table 2) and should be treated as an outlier and omitted when developing a reference value for aerobic capacity demands.
In contrast, a variation in the VO2max has been observed between playing positions and the fitness level of the players at the time of testing (Reilly et al., 2000). Reports have also shown that fullbacks and midfield players possess the highest VO2max values compared to defenders and goalkeepers in Danish elite male soccer players (Bangsbo, 1994). Higher values were also observed in Norwegian elite male soccer players compared to Danish players (Helgerud et al., 2001; Wisloff et al., 1998). The fact that there were no differences in VO2max between elite and non-elite players when expressed relative to body mass in first team Danish soccer players (Bangsbo, 1994) suggests that, while aerobic capacity is important, technical and tactical soccer skills during match play could be more important than small variations in aerobic capacity (Bangsbo, 1994; Reilly et al., 2000).
The role of aerobic capacity during a soccer match could be outlined by the distance covered, as mentioned earlier. The reported match play intensity of 70%–75% of VO2max (Reilly, 1997) and the average HR of 80%–90% of HRmax (Helgerud et al., 2001) outlines that those measures are close to the anaerobic threshold of a top soccer player (Reilly, 2007; Stolen et al., 2005). Furthermore, blood lactate accumulation takes place during periods where players had to conduct high-intensity activity, indicating that aerobic fitness is vital for soccer players, as it helps to clear lactate from the blood, shift the lactate curve to the right, and delay lactate accumulation (Mohr et al., 2003; Reilly, 2007; Stolen et al., 2005). Furthermore, the reported decline of 5–10% in total distance covered during the second half of the match compared to that during the first half (Bangsbo et al., 1991; Mohr et al., 2003; Stolen et al., 2005) and the reported positive relationship between aerobic fitness and work rate (Reilly & Thomas, 1976) suggest that aerobic fitness would allow the players to perform at a higher work rate for a longer period during the second half of the match (Reilly, 1997).
Conclusion
The takeaway messages from the present brief review are: (a) No worthwhile changes were observed in aerobic capacity test values in elite male soccer players in the studies published between 1975–2012, indicating that the aerobic demands have been stable and aerobic metabolism is the major energy source during a soccer match; (b) A high aerobic capacity is vital for soccer players, as it helps them to complete the total work during a soccer match and clear lactate from the blood after periods of high-intensity activities; (c) The time rate of doing work during a match seems to be more important than considering only the total work as a function of the total distance covered; and (d) The match distance covered (10,418 ± 933 m) and VO2max (59.38 ± 3.74 mL∙kg⁻1∙min⁻1) is in line with the reported demands during the period 1967–2012 and could be used in planning and designing training programs to meet the game’s demands of elite male soccer players.
References
Alexandre, D., da Silva, C. D., Hill-Haas, S., Wong del, P., Natali, A. J., De Lima, J. R., . . . Karim, C. (2012). Heart rate monitoring in soccer: interest and limits during competitive match play and training, practical application. J Strength Cond Res, 26(10), 2890-2906. doi:10.1519/JSC.0b013e3182429ac7
Olofsson, G., Angus, S., Armstrong, G. T., & Kornilov, A. N. (1981). A report of IUPAC Commission I.2 on Thermodynamics Assignment and presentation of uncertainties of the numerical results of thermodynamic measurements. The Journal of Chemical Thermodynamics, 13(7), 603-622. doi:http://dx.doi.org/10.1016/0021-9614(81)90031-8