Assessing the influence of fan attitude and expenditures on future propensity to spend on sport products and service in Korea
International Journal of Applied Sports Sciences, Vol.29, No.1, pp.31-41
https://doi.org/10.24985/ijass.2017.29.1.31
ⓒ Korea Institute of Sport Science
초록
Despite the growing popularity of professional baseball in South Korea, academic literature lacks much quantitative analysis of its fans. The main purposes of this current study were two-fold. Firstly, it was to identify if fan attitudes and expenditures are associated with and different by demographic variables. Secondly, it was to find out if fan attitudes and expenditure positively predict and explain the variance of future propensity to spend on products and service. A total of 1612 fans who attended Korean baseball games voluntarily participated in this study. The survey questionnaire consists of five sections of demographics information, sport fandom, satisfaction of social media service, satisfaction of the baseball stadium, and future propensity to spend on products and service at the ballparks. An exploratory analysis found that fan attitudes and expenditures differed by demographic variables (e.g., gender, education, age). Second, fan attitudes about the baseball team, satisfaction with baseball stadium, satisfaction with team media social media services, and current venue expenditures proved to bepositive predictors of future propensity to spend on team products and service (FPSPS).
Abstract
Despite the growing popularity of professional baseball in South Korea, academic literature lacks much quantitative analysis of its fans. The main purposes of this current study were two-fold. Firstly, it was to identify if fan attitudes and expenditures are associated with and different by demographic variables. Secondly, it was to find out if fan attitudes and expenditure positively predict and explain the variance of future propensity to spend on products and service. A total of 1612 fans who attended Korean baseball games voluntarily participated in this study. The survey questionnaire consists of five sections of demographics information, sport fandom, satisfaction of social media service, satisfaction of the baseball stadium, and future propensity to spend on products and service at the ballparks. An exploratory analysis found that fan attitudes and expenditures differed by demographic variables (e.g., gender, education, age). Second, fan attitudes about the baseball team, satisfaction with baseball stadium, satisfaction with team media social media services, and current venue expenditures proved to bepositive predictors of future propensity to spend on team products and service (FPSPS).
Introduction
In March 27th of 1982, the South Korean professional baseball organization (Korea Baseball Organization, KBO) opened its inaugural season with six franchises of Samsung Lions, Lotte Giants, MBC Blue Dragons, OB Bears, Hai-Tai Tigers, and Sam-Mi Super Stars. Despite some struggles, KBO has achieved remarkable growth in the past 30 years. KBO introduced five new franchises (Eagles 1986, Raiders 1991, Wyverns 2002, Dinos 2011, Wiz 2013), while one franchise (Sam-Mi Super Stars) withdrew and another (MBC Blue Dragons) changed to LG Twins in 1989, making a total of ten franchises as of 2016 (Sport Industry White Paper 2015, p. 63). Total attendance increased from 1,438,768 in 1982 to 7,360,529 in 2015, and more than six million fans attended Korean baseball parks for six consecutive years since 2009. The popularity of Korean professional baseball was partly fueled by the national team’s success at international competitions, notably 2008 Beijing Olympics (gold medal), 2010 World Baseball Classic (second place), and 2010 Guangzhou Asian Games (gold medal) (Sport Industry White Paper, 2015).
Despite the growing popularity of professional Korean baseball, academic literature lacks much quantitative analysis with large sample size of its fans. To address this gap, the current study examines a large, convenience sample (N=1612) of fans of one KBO team. First, an exploratory analysis finds that fan attitudes and expenditures often differ by demographic variables (e.g., gender, education, age). Current venue expenditure is significantly associated with gender and age, but not with education.
Second, consistent with American-based literature, fan attitudes about the baseball team, satisfaction with baseball stadium, satisfaction with team media social media services, and current venue expenditures are positive predictors of future propensity to spend on team products and service.
This paper first reviews the literature on professional sport fans generally and on Korean fans in particular. It then formulates key questions and a hypothesis for analysis.
LITERATURE REVIEW
Sport fandom: motivation and identification
The literature on fan attitudes and behaviors find that two critical elements are fan motivations and identification. Wann, Inman, Ensor, Gates, and Caldwell (1999) identify eight sub-motives of aesthetics, affiliation, economics, entertainment, escape, eustress, family gathering and self-esteem. The motivational factors are confirmed in some previous research, including family gathering (Izzo, Munteanu, Ceobanu, Dumitru, & Nichifor, 2011), affiliation with others (Eastman & Land, 1997), passion for aesthetic value (Weiller & Higgs, 1997), and stress release (Eastman & Riggs, 1994).
Fan identity is also an important psychological concept to understand the attitudes and behaviors of sport fans. Wann and Branscombe (1993) created the Sport Spectator Identification Scale (SSCI) to quantitatively measure fan identity, and it has been analyzed in association with the variables of team loyalty, game attendance rates, and consumption behaviors. Trail and James (2001) also developed the Motivation Scale for Sport Consumption (MSSC) to measure the motivations behind sport spectator consumption behavior. In addition, James and Ridinger (2002) find significant gender differences among basketball fans: “males appreciated the beauty and gracefulness of basketball,” regardless of whether the athletes were male or female, “while females found women’s basketball more aesthetically appealing” (James & Ridinger, 2002, p. 260).
In South Korea, a small literature identifies the motivations of professional baseball fans. Motivations include celebrity baseball players, low costs, promotional events, and ballparks (Jung, 2007). Similarly, Huh and Lee (2004) and Baek, Cho, and Lee (2005) categorize five motivations: ballpark, game situation, promotion, cost, and athletes. Some studies investigate gender as a variable (Cho, Cho, & Jung, 2008; Jung & Cho, 2008; Shin & Cho, 2008). Kim (2007) finds that male baseball fans had higher behavioral involvement than their female counterparts, and that non-married fans had higher socio-psychological involvement than their married counterparts. Females who attend baseball games report higher levels of satisfaction in their leisure life than those who do not (Jung & Kim, 2014). However, gender is not a significant variable with respect to satisfaction levels of ballpark and physical environment (Lee & Yoon, 2012). As of yet, no literature analyzes the statistical relationships among education, age, and sport fandom in Korea. (We reviewed more than 200 studies of Korean professional baseball since 2005.)
Physical environment on customer behaviors
In the marketing literature, the physical environment influences customer attitudes and behaviors generally (Kotler, 1973) and is highly related with customer patronage and level of customer expenditure in particular (Bitner 1992). In sport settings, fans’ perceptions of the physical environment of sports venues significantly increase the motivation or willingness to attend games (Hill & Green, 2000; Greenwell, Fink, & Pastore, 2002; Wakefield, Blodgett, & Sloan, 1996).
The current trend is to replace multi-purpose stadiums with single-purpose (e.g., baseball-only), because the latter increases fans’ comfort levels and provides ideal platforms for sponsor marketing and promotions (Greenwell et al., 2002). Another trend is to replace older, traditional parks (e.g., bench seats, old-fashioned scoreboards, single concession stands) with newer parks equipped with comfortable padded seats and cup holders, various restaurants, and fancy retail stores. When AT&T Park, the home stadium of San Francisco Giants, was built in 2000, the ticket revenue increased by approximately 200% from the year before (Fisher, 2000). More recently, regardless of sports league, big franchises such as New York Giants, New York Jets, New York Yankees, San Francisco 49ers, and the English FA spend significantly on their new state-of-the art facilities. The Inglewood stadium, the new home stadium of the Los Angeles Rams to be completed in 2019, will be equipped with sculpted roof, open stands and concourses, transparent glass, jumbo video screens, and free standing concessions (Flamer, 2016).
In 2015, the Korean baseball league joined the stadium-building trend with a new, baseball-only park in Daegu for the Samsung Lions and a first-ever domed baseball stadium in the Gocheok district of Seoul for the Nexen Heroes (Chosun Ilbo, 31 December 2015). In a qualitative study, Park and Choi (2011) find that male baseball fans are enthused about the physical environment of sports venues, whereas female fans are more concerned about costs. As of yet, no quantitative study has analyzed the relationship between venue physical environment, fan motivation, and fan spending in Korea.
Customer satisfaction and retention
Customer satisfaction can be described as cognitive assessment after purchase decision and/or actual behavior (Churchill & Surprenant, 1982; Day, 1984); and effective measurement tool to assess service performance (Anderson & Sullivan, 1993). Customer satisfaction is used to measure service quality and performance because, firstly, it is uniquely experiential to the customer (Oliver, 1993) and thus an individual’s subjective perception on service quality can be different or sometimes more critical than an organization’s objective standards of service quality (Chelladurai & Chang, 2000); secondly, customer satisfaction mediates between service quality and purchase behavior (Anderson & Sullivan, 1993; Brady & Robertson, 2000). Cognitive service quality evaluation influences emotional satisfaction assessment, which in turn creates purchase intentions (Oliver, 1993). Customer satisfaction affects customer purchase intentions (Anderson & Sullivan, 1993) as well as willingness to engage in repeat business (Tornow & Wiley, 1991).
Customer satisfaction is also a significant contributor to customer retention (Bernhardt, Donthu, & Kennett, 2000). Retention is an ongoing relationship with customers and yields streams of revenue beyond the original transaction (Reichheld, 1994). Sport organizations put a significant effort on maintaining high retention rate, commonly measured by annual renewal of season tickets. Academics investigate key factors that lower customer defection rates and that increase customer loyalty (Cronin, Brady, & Hult, 2000; Oliver, 1999). Customer satisfaction is a significant predictor of intentions to attend future sporting events, and it can be classified into game satisfaction (player performance and team characteristics) (DeSchriver, 1999; Pan, Gabert, McGaugh, & Branvold, 1997) and service satisfaction (service personnel, promotions and facility amenities) (Chelladurai & Chang, 2000; McDonald, Sutton, & Milne, 1995; Trail, Anderson, & Fink, 2005). In Korean baseball, stadium-related factor and game-related factor are significant predictors of customer retention (Baek, Cho, & Lee 2005).
A large literature examines the core products of sporting events (e.g., individual athlete performances and franchises characteristics) as predictors of customer satisfaction (Parasuraman, Zeithaml, & Berry, 1994) and future purchase intentions (Mittal, Kumar, & Tsiros, 1999). However, the influence of ancillary services is understudied. Ancillary services at sporting events include concession services, security management, service personnel, merchandisers, and on-site promotional activities (Chelladurai & Chang, 2000; McDonald, Sutton, & Milne, 1995; Yoshida & James, 2010; Zhang et al., 1997; Zhang et al., 1998). Social media services and baseball stadium shall serve as key variables of ancillary services in our study.
This study asks two questions. The first is whether fan attitudes and expenditures—namely Sport Fandom (SF) toward Baseball Franchise, Satisfaction Level of the Baseball Stadium (SLBS), Satisfaction Level of the Social Media Service (SLSMS) of Baseball Franchise, Future Propensity to Spend on Products and Service (FPSPS) of Baseball Franchise and Expenditure At the Venue (EAV)—are associated with and different by demographic variables (e.g., gender, education, age).
The second is whether fan attitudes (SF, SLBS, SLSMS) and expenditure (EAV) positively predict, and explain the variance of, Future Propensity to Spend on Products and Service (FPSPS).
METHOD
Sample and Settings
A convenience sample of people who came to watch a total of 10 home games of a professional baseball franchise during the regular season in 2015 was invited to participate in this study. A total of 25 survey crews were recruited from a university in Korea and educated about their roles and responsibilities at the orientation session before they were sent to the baseball stadium. For a total of 10 games, four to five survey crews were dispatched to the designated areas to collect surveys in each game. Survey crews were not paid, but were given privileges to stay and watch the game after the daily target number of 200 surveys was collected. In order to meet the daily requirements, they had to approach fans who were sitting on their seats waiting for the game to start. Convenience sampling carries inherent problems of external and internal validity, which we address in the discussion section.
Instrumentation
The survey questionnaire contained five sections. First was personal demographic information (e.g., age, gender, education, residence, profession, leisure activities, monthly family income) and expenditure at the venue. Second was sport fandom (Wann, 2002), with five items rated on a 5-point Likert-scale anchored from 1 (strongly disagree) to 5 (strongly agree). The original scale has been adopted and revised for this study to meet our target sports of baseball. The rating scale was also modified an 8-point to a 5-point Likert scale from. The original scale showed strong internal consistency reliability (Cronbach’s alpha = .96) and the current sample confirmed its internal consistency reliability (Cronbach’s alpha = .92). The item responses were summed within each dimension. These items described behaviors related to the fan identity toward the baseball franchise that they support, for example, “I believe that [Baseball Franchise] is critical to my life.”
Third was the satisfaction level of social media service (SLSMS), with responses ranging from 1 (strongly disagree) and 5 (strongly agree). Fourth was satisfaction level of the baseball stadium (SLBS) (home stadium of our target baseball franchise), with responses ranging from 1 (very dissatisfactory) to 5 (very satisfactory). The last section of this survey included five questions future propensity to spend on products and service of which scale was rated on a 5-point Likert-scale anchored from 1 (strongly disagree) to 5 (strongly agree). The validity of the newly developed scales of SLBS, SLSMS, and FPSPS was reviewed by an expert panel, including two sport marketing professionals with over 15 years of experiences in the professional baseball franchise in Korea and two sport management professors (each with more than 10 years of professorship experience). The original scales have been revised and modified several times and the reliability coefficients with Cronbach’s alpha of the finalized scales of SLBS, SLSMS, and FPSPS were .85, .94, and .86, respectively.
Instrument translation
Back-translation technique was selected to secure consistency among the Korean and English instrument versions (Douglas & Craig, 2007).
Statistical analysis
All data were analyzed in IBM SPSS 22.0 (IBM SPSS, 2013). Of 1,927 surveys collected, 315 (16.3%) had missing data. Missing and non-missing data were compared on key demographic variables using independent samples t-tests and chi-square tests. Upon non-significant results in those tests, those with missing data were excluded from further analyses and the resulting sample size was 1,612. Assumptions such as normality were checked prior to analyses and descriptive statistics were computed to characterize the sample. Chi-square test was used to examine the association of Expenditure at Venue (EAV) with gender, education and age group. In order to run chi-square tests, age variable was required to be transformed into categorical scale (10s, 20s, 30, 40s, 50s, 60s and older). Multivariate analysis of variance (MANOVA) was used to compare SF, SLBS, SLSMS, and FPSPS by gender, education, and age group. Multivariate analysis using hierarchical multiple linear regression was used to find significant proportions of variances of SF, SLBS, SLSMS, EAV on FPSPS (Future Propensity to Spend on Products and Service), after controlling for demographic variables (gender, education, age). The variables of age and expenditure were dummy-coded before entering into the model.
RESULTS
Table 1 shows descriptive information of our sample. Typical participants in this study were female (n = 940, 58.3%), aged between 20-29 (n = 813, 50.4%), student (n =659; 40.9%) or office worker (n = 518; 32.1%), in college or graduated from college (n = 1,250; 77.5%) and with monthly family income of $3,000 - $5,000 (n =389; 24.1%).
Table 1.
Sample characteristics on selected demographic variables
| Variables | N(%) |
|---|---|
| Gender Male Female |
666 (41.3) 940 (58.3) |
| Age 10-19 20-29 30-39 40 + |
291 (18.1) 813 (50.4) 298 (18.5) 199 (12.3) |
| Education High school diploma and below College/Graduate school |
345 (21.4) 1250 (77.5) |
| Profession Student Office worker Government employee Personal business Service industry Free-lancer Housewife Agricultural/Fishing industry No job/others |
659 (40.9) 518 (32.1) 65 (4.0) 9 (0.6) 110 (6.8) 67 (4.2) 61 (3.8) 3 (0.2) 110 (6.8) |
| Monthly Family Income Below $1,000 $1,000 - $3,000 $3,000 or more |
35 (2.2) 101 (6.3) 1435 (89.0) |
Results from Chi-square test of association indicated that the EAV were significantly associated with gender (x² = 37.11, p <.001) and age group (x² = 127.32, p <.001), but not with education (x² = 4.38, p =.112).
In Table 2, MANOVA examining SF, SLBS, SLSMS, FPSPS indicated that the combined DVs were significantly affected by education (p = 0.025; η² = 0.007), age (p = 0.000; η² = 0.021) the interaction between gender and education (p = 0.030; η² = 0.006), between age and education (p = 0.002; η² = 0.007). However, multivariate effect sizes were very small. Univariate ANOVAs and Tukey post hoc tests were conducted as follow-up tests. ANOVA results indicated that Sport Fandom (SF) (p = 0.020; Table 2) and Future Propensity to Spend on Products and Service (FPSPS) (p = 0.003; Table 2) differs for the interaction between gender and education. Education had little effect on both Sport Fandom (SF) and Future Propensity to Spend on Products and Services (FPSPS) for female, but male with high school diploma or less had a higher level of both Sport Fandom (SF) and Future Propensity to Spend on Products and Services (FPSPS) than male with college/graduate school (p < 0.05; Figure 1a). ANOVA results also indicated that Satisfaction Level of the Baseball Stadium (SLBS) (p = 0.000; Table 2) and Satisfaction Level of the Social Media Service (SLSMS) (p = 0.001; Table 2) differs for the interaction between age and education. Those with college/graduate school had a higher level of satisfaction with both baseball stadium and social media services than those with high school diploma or less when they are 40s and older, but those with high school diploma or less had a higher level of satisfaction with both baseball stadium and social media services than those with college/graduate school (p < 0.05; Figure 1b). It was interesting to find that gender failed to be a significant factor to influence SL, SLBS, SLSMS, and FPSPS.
Table 2.
Results of three-way multivariate analysis of variance(MANOVA)
| Variable | Df | F | p |
|---|---|---|---|
|
Gender Univariate F-tests SF SLBS SLSMS FPSPS Multivariate test Wilk’s lambda = 0.99 |
1 1 1 1 4 |
0.03 0.01 1.75 0.65 0.95 |
0.873 0.991 0.186 0.421 0.433 |
|
Education Univariate F-tests SF SLBS SLSMS FPSPS Multivariate test Wilk’s lambda = 0.99 |
1 1 1 1 4 |
2.41 0.01 2.43 9.35 2.79 |
0.121 0.914 0.120 0.002 0.025 |
|
Age Univariate F-tests SF SLBS SLSMS FPSPS Multivariate test Wilk’s lambda = 0.94 |
3 3 3 3 12 |
2.34 20.48 11.03 2.92 8.59 |
0.067 <0.001 <0.001 0.033 <0.001 |
|
Gender×Education Univariate F-tests SF SLBS SLSMS FPSPS Multivariate test Wilk’s lambda = 0.99 |
1 1 1 1 4 |
5.45 0.50 0.20 8.80 2.50 |
0.020 0.481 0.657 0.003 0.041 |
|
Gender×Age Univariate F-tests SF SLBS SLSMS FPSPS Multivariate test Wilk’s lambda = 0.99 |
3 3 3 3 12 |
0.17 1.19 1.32 0.14 0.74 |
0.918 0.312 0.266 0.935 0.711 |
|
Age×Education Univariate F-tests SF SLBS SLSMS FPSPS Multivariate test Wilk’s lambda = 0.98 |
3 3 3 3 12 |
0.99 7.07 5.63 0.39 2.71 |
0.398 <0.001 0.001 0.760 0.001 |
|
Gender×Age×Education Univariate F-tests SF SLBS SLSMS FPSPS Multivariate test Wilk’s lambda = 0.99 |
3 3 3 3 12 |
1.67 0.41 2.20 1.06 1.39 |
0.173 0.748 0.086 0.363 0.165 |
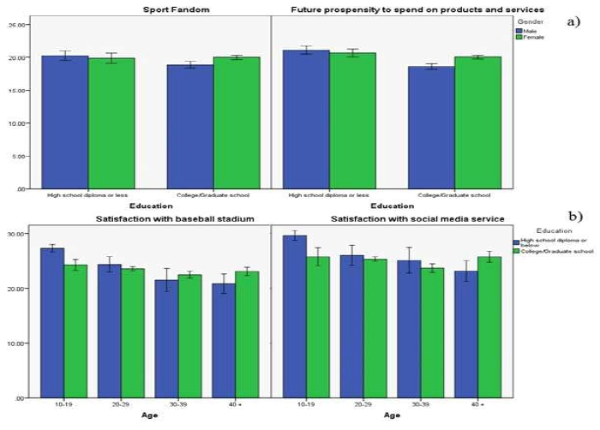
Table 3 summarizes the results of hierarchical multiple regression analysis. Participants’ demographic variables of gender, education, and age were entered into the regression model and controlled for their effects before examining the effects of SF, SLBS, SLSMS, and EAV on FPSPS. The model explained 3.8% of the variance in total percent of FPSPS. After adding SF, SLBS, SLSMS, and EAV into the model, these variables
Table 3.
Summary of hierarchical multiple linear regression analysis for variables explaining FPSPS
| Variable | B | SE | 95% CI | b | Δ Adj R2 | |
|---|---|---|---|---|---|---|
| Step 1 | 0.038 | |||||
| Gender (Female) | 0.66 | 0.17 | 0.32 – 1.00 | 0.08*** | ||
| Education (College/Graduate School) | -0.48 | 0.25 | -0.97 – 0.01 | -0.05* | ||
| Age 10-19 20-29 30-39 40 + |
Ref -0.27 -1.12 -1.20 |
0.28 0.32 0.35 |
-0.83 – 0.29 -1.76 – -0.49 -1.89 – -0.52 |
-0.03 -0.10*** -0.09*** |
||
| Step 2 | 0.431 | |||||
| Sport Fandom | 0.41 | 0.02 | 0.38 – 0.45 | 0.49*** | ||
| Satisfaction with baseball stadium | 0.10 | 0.02 | 0.07 – 0.13 | 0.15*** | ||
| Satisfaction with social media service | 0.12 | 0.02 | 0.09 – 0.16 | 0.15*** | ||
| Expenditure Less than $10 $10 - $30a $30 or more |
Ref -- 0.54 |
0.18 | 0.19 – 0.88 | 0.06** | ||
explained the additional 39.3% of the variance in total percent of FPSPS, after controlling for the demographic variables in step 1. In the final model, all except mid-level expenditure (EAV $10 - $30) were significant in predicting FPSPS. High-level expenditure (EAV $30 or more) remained a significant predictor of FPSPS.
CONCLUSION AND DISCUSSION
This study sought to investigate whether fan attitudes (SF, SLBS, SLSMS) and current and future expenditures (EAV, FPSPS) are associated with and different by demographic variables (e.g., gender, education, age) and secondly, whether fan attitudes (SF, SLBS, SLSMS) and expenditure (EAV) positively predict and explain the variance of, Future Propensity to Spend on Products and Service (FPSPS). An examination of 1,612 fans attending 10 professional baseball games during 2015 season in Korea revealed several interesting findings and points of discussion with regards to fan attitudes, current and future expenditures, and demographic variables.
The results of MAVOVAs indicated that gender failed to be a significant factor to influence SL, SLBS, SLSMS, and FPSPS. It is somewhat different from Kim (2007)’s study, which assert male and female baseball fans have different levels of behavioral, socio-psychological, and psychological involvement. However, this study confirmed Lee and Yoon (2012)’s research in a way that gender is not a significant variable with respect to satisfaction levels of ballpark and physical environment. This indicates that Korean professional baseball has become gender-neutral entertainment and thus there exist some similarities on fan attitude and expenditures between male and female baseball fans in Korea.
Secondly, this study successfully revealed the meaningful relationships among the variables of demographics and SF, SLBS, SLSMS, and EAV where SLSMS and EAV have not been touched in the realm of sport marketing and management research in Korea. As Reichheld (1994) described, this study confirmed that SF, SLBS, and SLSMS took a significant impact on FPSPS which was likely to lead to quantifiable returns in the long term (Bernhardt, Donthu, & Kennett, 2000; Cronin, Brady, & Hult, 2000; Greenwell et al., 2002; Oliver, 1999; Trail, Anderson, & Fink, 2005). However, it was interesting to see that EAV did not explain the significant proportion of variance of FPSPS. It may be not only because the majority of fans are apt to spend their monies mainly on food and drinks at the venue, but also because other merchandise products are not as fancy and attractive as those in Major League Baseball (Waddell, 2006).
Thirdly, this study was in the same line with the previous studies of Wakefield et al. (1996), Hill and Green (2000), Greenwell et al. (2002) in a sense that physical environment of baseball parks played a key role to help increase fan satisfaction and future propensity to spend on products and services in baseball. This may indicate that it will be more difficult to meet fans’ satisfaction as their expectations increase when state-of-the-art stadiums are constructed. Despite the growing popularity of professional baseball, academic research and analytics techniques in Korea has lagged behind their counterparts in Japan and the United States of America. The development of scientific and data-driven research techniques could help sport managers and marketers better operate and market their baseball franchises. Based on the findings, it is hoped that this study will make a valuable contribution to the understanding of the Korean baseball fans and the future studies may benefit from this research.
This study contains a couple of key limitations. First of all, this study utilized convenience sampling methodology, which carries inherent problems of internal validity (bias) and external validity (generalization). Despite instructions to contrary, the survey crew may (perhaps unconsciously) approach some groups more than others. The crews were university students, and in fact, university students were heavily overrepresented among respondents: this is a known difference, but other differences may be unknown. Secondly, the sport managers should be cautious when applying the findings of this study to other franchises and sports due to the fact that all the research participants in this study were fans of Korean professional franchises. Therefore, in order to detect if this current hierarchical regression model is valid, a 5- or 10-year period of longitudinal study needs to be conducted. For various reasons, random sampling was not available for the current study. In Korean baseball research, convenience sampling is the norm. This was our research team’s first major survey of Korean fans, and we followed standard procedure to not inconvenience the team management. In future projects, we shall ask management permission to randomly select fans, such as using randomly selected sections and seats.