Performance and cycling efficiency after supra-maximal interval training in trained cross-country mountain bikers
International Journal of Applied Sports Sciences, Vol.28, No.1, pp.19-30
ⓒ Korea Institute of Sport Science
초록
The purpose was to examine improvements of performance and different physiological parameters in ten trained male cross-country mountain bikers after a supra-maximal interval training (SMIT) program of 8 sessions. Each session comprised 60 to 90 repeated 1-minute bouts consisting of a 20-s effort at 115% of maximal aerobic power (MAP), followed by 40-s recovery at 50% of MAP. Performance time to complete the virtual time-trial performance test was reduced significantly by -4.2%. Pulmonary sub-maximal oxygen consumption and deoxyhemoglobin in vastus lateralis decreased significantly by ‑4.7% and -21.9% respectively during the MAP test. Our findings suggest that SMIT program might improve performance and cycling efficiency in XC mountain bikers.
Abstract
The purpose was to examine improvements of performance and different physiological parameters in ten trained male cross-country mountain bikers after a supra-maximal interval training (SMIT) program of 8 sessions. Each session comprised 60 to 90 repeated 1-minute bouts consisting of a 20-s effort at 115% of maximal aerobic power (MAP), followed by 40-s recovery at 50% of MAP. Performance time to complete the virtual time-trial performance test was reduced significantly by -4.2%. Pulmonary sub-maximal oxygen consumption and deoxyhemoglobin in vastus lateralis decreased significantly by ‑4.7% and -21.9% respectively during the MAP test. Our findings suggest that SMIT program might improve performance and cycling efficiency in XC mountain bikers.
Introduction
Competitive cross-country (XC) mountain biking requires high rates of aerobic and anaerobic energy production (Stapelfeldt, Schwirtz, Schumacher, & Hillebrecht, 2004) for successful competition. According to Impellizzeri & Marcora (2007), over 82% of XC mountain biking race time occurs above the lactate threshold, with an average heart rate (HR) over 90% of maximum and a mean high percentage of maximal oxygen uptake (VO2max) corresponding to 84%. Data from our laboratory, collected with a portable power meter, during a XC mountain biking race of the 2007 World Cup Circuit in St-Félicien (Québec, Canada), showed frequent short effort bouts at 115% of maximal aerobic power (MAP), followed immediately by sub-maximal effort bouts. Because XC mountain biking events are high-intensity activities characterized by intermittent effort bouts, it is logical that training programs include bouts of supra-maximal intensity to improve performance. In reviews by Buchheit & Laursen (2013a, 2013b) and Laursen & Jenkins (2002), high-intensity interval training programs demonstrated a multitude of cardiac and peripheral adaptations that were correlated with gains in MAP and performance but little is known about which specific adaptations occur with a specific XC mountain biking race intensity training program. To our knowledge, no one has explored the improvements on cardiac output (Q) using bio-impedance and on skeletal muscle oxygenation with near infrared spectroscopy (NIRS) in synchronicity in trained XC mountain bikers after this type of training program.
Cardiac adaptations to endurance facilitate the improved delivery of oxygen to the muscles at exercise. Given that maximal HR (HRmax) remains unchanged in response to endurance training (Zavorsky, 2000), improvement during high-intensity exercise can be attributed to increased stroke volume (SV), increasing Q. Early studies demonstrated that SV plateaus at approximately 40-75% of VO2max (Åstrand, Cuddy, Saltin., & Stenberg, 1964) and may decrease as VO2max approaches (Spina et al., 1992). Some authors (Gledhill, Cox, & Jamnik, 1994) found that SV rises progressively in well-trained individuals, in response to increasing exercise intensity up to VO2max. However, it is unclear which exercise program might be more beneficial for subjects who are already well-trained to improve SV. MacPherson, Hazell, Olver, Paterson, & Lemon (2011) observed that sprint interval training (SIT) does not increase SV, whereas sub-maximal training at 65% VO2max tends (P = 0.076) to enhance it in healthy subjects. In contrast, Daussin et al. (2007) determined that SV was improved after an 8-week interval training program at 90% VO2max in sedentary subjects, whereas continuous training at 61% of aerobic power had no such effect. Because SV has been shown to rise up to the attainment of VO2max in athletes, to our knowledge, it is still unknown if a training program, using short supra-maximal effort bouts, could increase SV in trained XC mountain bikers.
Peripheral adaptations – such as increments in myoglobin, maximal arterial-mixed venous oxygen difference, capillary density, fiber type characteristics and mitochondrial content/density – which contribute to the enhanced endurance performance of highly-trained athletes after HIT, are well-described by Brooks, Fahey, & Baldwin (2005). Peripheral adaptations measured by near infrared spectroscopy (NIRS) after the completion of a short training program at intensities below 100% of VO2max have been reviewed by Neary (2004).
However, specific training programs that distinguish between cardiac and peripheral adaptations are not clearly documented in the literature with trained XC mountain bikers. Thus, it seems relevant to investigate the physiological improvements after a supra-maximal interval training (SMIT) above MAP in the hope of discriminating between cardiac and peripheral adaptations. The purpose of this study was to examine the improvements on time trial performance and on different physiological parameters in cross-country (XC) mountain bikers after a SMIT program.
Methods
Participants
Ten trained male XC mountain bikers (age 35 ± 8 years, height 174.7 ± 6.1 cm) volunteered to participate in our study. Their physical characteristics (Table 1) were measured before and after the training program before performing the MAPT. Skinfold thickness at 5 sites (biceps, triceps, iliac crest, subscapular and medial calf) was measured to the nearest 0.2 mm with a Harpenden caliper. All measurements were taken on the right side of the body using standard procedures (CSEP-PATH) and the average of two readings at each site was recorded. After approval by the institutional ethics committee of Université du Québec à Trois-Rivières (Canada), written informed consent was obtained from each participant after an explanation of all the tests and procedures involved in this study.
Table 1.
Physiological characteristics observed at pre- and post-MAPTs
| Parameters | PRE- | POST- |
|---|---|---|
| Body weight (kg) | 74.0 ± 7.6 | 73.7 ± 7.9 |
| VO2max (mL·kg-1·min-1) |
61.1 ± 6.6 | *63.1 ± 6.9 |
| VO2max (mL·min-1) | 4502 ± 561 | 4598 ± 530 |
| Skinfold sum (mm) | 36.9 ± 14.5 | *33.8 ± 13.1 |
| HRmax (beats/min) | 188 ± 8 | 189 ± 6 |
| MAP (W) | 289 ± 38 | **313 ± 26 |
| 4 mM (W) | 210 ± 25 | **237 ± 25 |
| 4 mM/MAP (%) | 72.7 ± 4.9 | 75.6 ± 3.6 |
| VEmax (L/min) | 170.5 ± 22.0 | 173.3 ± 26.6 |
| SVmax (mL/beat) | 118 ± 16 | 119 ± 16 |
| Qmax (L/min) | 21.6 ± 2.7 | 22.4 ± 2.6 |
Data are presented as means ± SD. VO2max: maximal oxygen uptake, W: Watts, MAP: maximal aerobic power, HRmax: maximal heart rate, VEmax: maximal pulmonary ventilation, 4 mM: power output at 4 mM of lactate, 4mM/MAP: 4 mM power percentage of MAP, SVmax: maximal stroke volume, Qmax: maximal cardiac output.
Experimental protocol
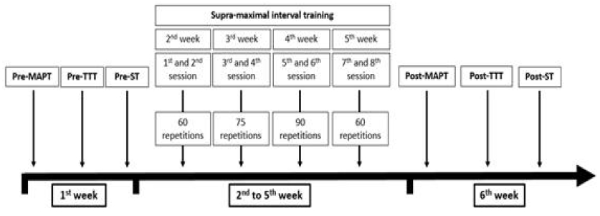
Each participant completed 3 laboratory visits on alternate days in the same week before and after the training program: for maximal oxygen uptake (VO2max) and MAP determination (MAPT), for the virtual time-trial performance test (TTT) and for the sprint test (ST), respectively (Fig. 1). Subjects were familiarized with the TTT before data collection. A detailed description of procedures and measured parameters of each test is given below.
Fig. 1.
Schema of the experimental design. Physiological variables were measured during pre- and post-MAPT, pre- and post-TTT, pre- and post-ST, 1st training session and 8th training session. MAPT: maximal aerobic power test, TTT: time-trial test, ST: sprint test.
VO2max testing
Participants were tested for their maximal oxygen consumption (VO2max) on their first visit to our laboratory. Pulmonary ventilation (VE) and pulmonary gas exchange (VO2 and VCO2) were measured by gas analyzer (Moxus, AEI Technologies, Pittsburgh, PA, USA). Each participant wore a Hans Rudolph 2700 series body style saliva trap 2-way NRBV mask (Hans Rudolph, Kansas City, MO, USA) and head support for Rudolph series 2726 valves. Prior to the test, the device was calibrated according to the manufacturer's instructions with 2 tanks of 4 different gases of known concentrations. Flow volume was calibrated with a 3.00-l Hans Rudolph 5530 series calibration syringe. All participants used their own bicycles. They were mounted on a Computrainer ergometer (Racermate, Computrainer Lab, Seattle, WA, USA), which had been validated and tested (Cane, Seidman, Sowash, & Otto, 1996; Westgarth-Taylor et al., 1997; Laursen & Jenkins, 2002). Rolling resistance calibration was set at 2.00 lbs. A pedal-frequency meter was employed to maintain cadence with visual feedback, and participants pedaled at their own preferred cadence (between 90-100 rpm) throughout all tests. They were asked to avoid heavy exercise 48 hrs before each test. The test began at 130 W and was stepped up in 30-W increments. The duration of effort bouts was 5 minutes, separated by 3-min recovery periods at 1 W per kilogram of body weight. VO2max was defined as the highest 30-s VO2 value reached during this incremental test with a respiratory exchange ratio greater than 1.1 and peak HR at least equal to 90% of the age-predicted maximum, or leveling off in the course of oxygen uptake until participants reached volitional exhaustion and/or the pedaling rate could no longer be maintained over 90 rpm. During this test, deoxyhemoglobin- myoglobin (Δ[HHb]) and total hemoglobin-myoglobin (Δ[THb]) was measured by NIRS (Portamon, Artinis Medical Systems BV, Utrecht, the Netherlands), SV by bio-impedance apparatus (Physio Flow PF-03, Manatac Biomedical, Macheren, France), HR by telemetry (Polar S 810i, Kempele, Finland), oxygen saturation (SpO2) by pulse oximetry (Sportstat, Nonin Medical, Plymouth, MN, USA) and blood lactate concentrations by lactate analyzer (Lactate Pro LT-1710, Arkray Inc., Kyoto, Japan).
Supra-maximal interval training (SMIT) program
The training program was specifically designed in light of our observations on the 2007 World Cup Circuit in St-Félicien, Québec, Canada. We noted that the race included frequent short effort bouts at 115% of MAP, followed immediately by sub-maximal effort bouts. To replicate this dynamic context, we designed a SMIT program which embodied a charging time ratio of 20 s at 115% of MAP, followed by 40 s of active recovery at about 50% of MAP. Thus, this study measured the improvements on cardiovascular functions and skeletal muscle oxygenation adaptations in XC mountain bikers after a 4-week program consisting of 8 SMIT sessions. Training progression was implemented by increasing the duration of exercise from 60 min (60 repetitions) during sessions 1 and 2, to 75 min (75 repetitions) during sessions 3 and 4, to 90 min (90 repetitions) during sessions 5 and 6 and, finally, returning to 60 min (60 repetitions) during sessions 7 and 8. Prior to every exercise session, a 10-minute self-determined warm-up within 100-160 watts was completed. Rolling resistance calibration of the Computrainer ergometer was set at 2.00 lbs. In sessions 1 and 8, pulmonary gas exchanges, Δ[HHb], Δ[THb], SV, HR, SpO2 and blood lactate concentrations were measured.
Virtual time-trial performance test (TTT)
Each participant completed a 13.2-km (two laps of 6.6 km) simulated ride on a Computrainer ergometer using their own bicycles. The TTT was conceived based on power output data collected with an instrumented wheel (PowerTap SL2.4, Saris Cycling Group, Madison, WI, USA) during the 2007 World Cup Circuit in St-Félicien (Québec, Canada) and subsequently downloaded and analyzed with processing software (TrainingPeak, WKO+3.0, Boulder, CO, USA). Rolling resistance calibration of the Computrainer ergometer was set at 2.00 lbs. Bicycle tire air pressure was checked before and after each ride to ensure that maximum tension (calibration) was maintained. HR was monitored continuously throughout the duration of the TTT. Blood lactate concentrations and SpO2 were recorded after the first 6.6-km lap and at the end of the TTT. Time duration and mean power output were recorded during the TTT, and the first and second segments were compared. Participants were encouraged to give their best effort until the end.
Sprint test (ST)
Participants completed a 320-meter maximal effort on a Computrainer ergometer with their own bicycles. They were instructed to begin pedaling as fast as possible when the Computrainer applied the load, receiving sustained verbal encouragement throughout the test. Rolling resistance calibration of the Computrainer ergometer was set at 3.50 lbs. Peak power, mean power and fatigue index ((peak power – end power) / peak power ∙ 100) were calculated and recorded by an online data acquisition system.
Skeletal muscle oxygenation
Skeletal muscle oxygenation changes were evaluated by near infrared spectroscopy (NIRS), a non-invasive method of monitoring local muscle oxy/deoxygenation. It is based on relative tissue transparency to light in the near infrared region and oxygen-dependent absorption changes of hemoglobin and myoglobin. In our study, the parameters measured by NIRS were deoxygenated hemoglobin/myoglobin (Δ[HHb]) and total hemoglobin/ myoglobin (Δ[THb]). These signals were “zeroed” during resting baseline and reported as relative differences in concentration during exercise. The Δ[HHb] signal can be regarded as being essentially blood volume-insensitive during exercise (De Blasi, Cope, Elwell, Safoue, & Ferrari, 1993). Thus, it is assumed to be a reliable estimator of changes in intramuscular oxygenation status and represents the balance between local muscle O2 delivery and O2 utilization within the NIRS field of interrogation. The NIRS-derived THb signal is a reliable indicator of changes in blood volume of working muscle (Wyatt et al., 1990). To record the NIRS signal, the probe was placed over the right vastus lateralis muscle, approximately 10-12 cm from the knee joint along the vertical axis of the thigh (Belardinelli, Barstow, Porszasz, & Wasserman, 1995). The thigh, with attached optodes and covering, was wrapped with elastic bandage to minimize movement of the optodes while still permitting freedom of movement for cycling. Black cloths were put around the probe and the skin to prevent contamination from ambient light. The skin was carefully shaven previously. Before each test, the NIRS probe was calibrated according to the manufacturer’s protocol and specifications. This was done while the participant was seated on his own bicycle with the right leg in a relaxed position at the lowest point of the pedal (dead bottom center). A setting time of 120 s was allowed in each test to stabilize the readings. Calibration was repeated twice before each test to ensure accuracy of the data. The baseline value for each individual was taken both before and after the test to ascertain comparability of the NIRS data. Finally, baseline was set to a relative 0%, whereas peak Δ[HHb] and peak Δ[THb] were separately determined as the higher value averaged over 30 s of the corresponding tests and respectively set to a 100%.
Measurement of cardiac output (Q)
Stroke volume (SV) was measured by impedance cardiograph during cardiac ejection. Q was calculated from SV and HR. The Physio Flow emits high frequency (75 kHz) and low amperage (1.8 mA) alternating electrical current via electrodes. Autocalibration was achieved after entry of the athlete’s age, height, body weight, and systolic/diastolic blood pressure assessed by standard sphygmomanometer. For autocalibration, the athletes had to be immobile and relaxed.
Statistics
Data are presented as means ± SD. Occasional missing data were cared for (Winer, Brown, & Michels, 1991), with corresponding modifications of degrees of freedom. Two factor repeated measures ANOVAs were used to assess significance between sets of pre- and post-test values. Paired t-tests were used to assess significance between pre- and post-test maximal values. Statistical significance was considered at P<0.05. One-tailed tests were applied for all parameters in Fig. 2 and 4, the sub-maximal conditions allowing no increase in their values after training (Brooks et al. 2005). Statistical analyses were performed with Microsoft Excel 2007 (‘Analysis tool-kit’). Graphics were created with Sigma Plot 10.0 (San Jose, CA, USA).
Fig. 2.
*P<0.05 and ***P<0.001 indicate significant differences from pre-testing. Data are presented as means ± SD.
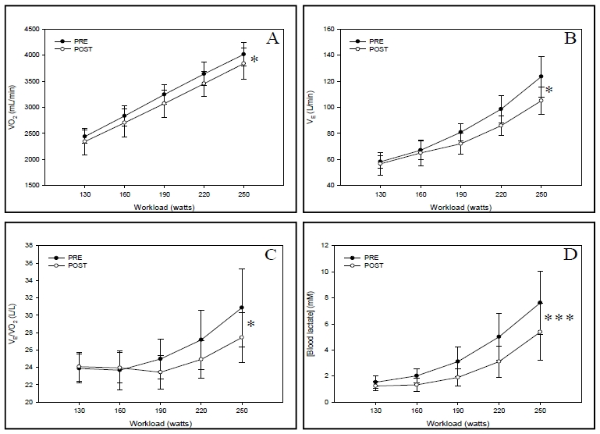
Fig. 3.
*P<0.05 indicates significant differences from pre-testing. Data are presented as means ± SD. n=9.
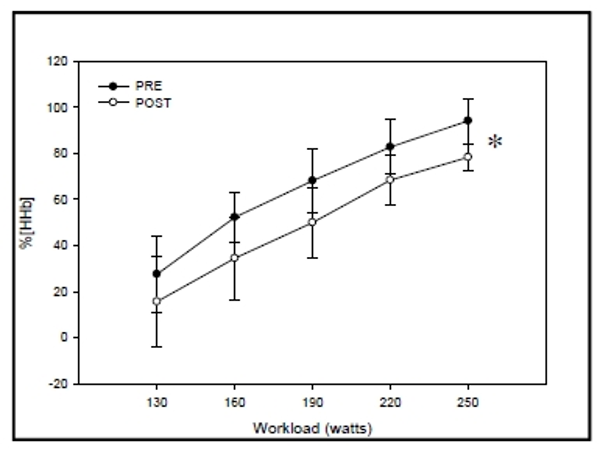
Fig. 4.
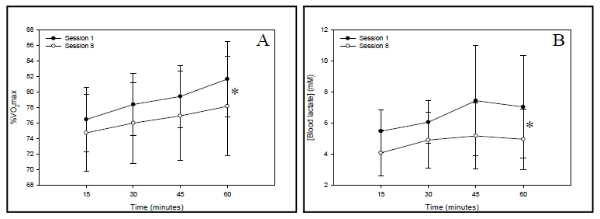
*P<0.05 indicates significant differences from pre-testing. Data are presented as means ± SD.
Results
Maximal and sub-maximal physiological response during the MAP test (MAPT)
Table 1 reports the descriptive physiological characteristics and peak values obtained during the initial and final MAPT of the 10 participants. No statistical improvement was observed in maximal Δ[HHb] and maximal Δ[THb].
In sub-maximal workloads between 130 and 250 W, no significant difference was observed in SV, Q and SpO2 between pre- and post-MAPTs. HR was significantly decreased by a mean of -4.1% (pre-: 156 ± 9 beats, post-: 149 ± 9 beats; P<0.05, F=8.01) between pre- and post-MAPTs, ranging from -13.0% to 1.7%. VO2 was significantly decreased by a mean of -4.7% (pre-: 3234 ± 178 mL, post-: 3082 ± 261 mL; P<0.05, F=5.49) between pre- and post-MAPTs, ranging from -20.1% to 1.5% (Fig. 2-A). VE was significantly decreased by a mean of -9.6% (pre-: 85.6 ± 7.2 L, post-: 76.9 ± 7.5 L; P<0.01, F=6.54) between pre- and post-MAPTs, ranging from -38.0% to 2.8% (Fig. 2-B). Respiratory equivalent for oxygen (VE/VO2) was significantly decreased by a mean of -4.7% (pre-: 26.1 ± 2.5 L/L, post-: 24.8 ± 1.5 L/L; P<0.05, F=3.81) between pre- and post-MAPTs, ranging from -22.0% to 4.1% (Fig. 2-C). Blood lactate concentrations were significantly diminished by a mean of -32.6% (pre-: 3.9 ± 1.2 mM, post-: 2.6 ± 0.9 mM; P<0.001, F=29.28) between pre- and post-MAPTs, ranging from -54.4% to -9.5% (Fig. 2-D). %Δ[HHb] was significantly reduced by a mean of -21.9% (pre-: 64.9 ± 9.4%, post-: 49.4 ± 13.2%; P<0.05, F=6.68) between pre- and post-MAPTs, ranging from -49.2% to 25.4% (Fig. 3). %Δ[THb] was not significantly different between pre- and post-MAPTs.
Physiological responses during training session after the training program
%VO2max was significantly reduced by a mean of -3.2% (pre-: 79.0 ± 4.1%, post-: 76.5 ± 5.5%; P<0.05, F=5.49), ranging from -12.4% to 2.1% between the first and eighth training sessions (Fig. 4-A). Blood lactate concentrations were significantly reduced by a mean of -20.3% (pre-: 6.5 ± 2.0 mM, post-: 4.9 ± 1.6 mM; P<0.05, F=4.56), ranging from -68.8% to 26.7% between the first and eighth training sessions (Fig. 4-B). SpO2, Δ[HHb] and Δ[THb] responses did not differ between the first and last sessions of the training protocol.
Sprint test (ST)
The SMIT program did not significantly improve the mean power output between the pre- (713.4 ± 83.4 W) and post- (740.9 ± 92.3 W) ST. The peak power output was not improved between the pre- (1029 ± 39 W) and post- (1017 ± 41 W) ST. However, the fatigue index was significantly decreased by -7.3% (pre-: 43.7 ± 5.9%, post-: 40.6 ± 6.7%; P<0.01, t=3.42) between pre- and post-STs, ranging from -19.5% to 2.6%. The completion time was significantly decreased by -5.6% (pre-: 26.57 ± 2.04 s, post-: 24.86 ± 1.46 s; P<0.01, t=4.02) between pre- and post-STs, ranging from -10.5 to 1.2%.
Virtual time-trial performance test (TTT)
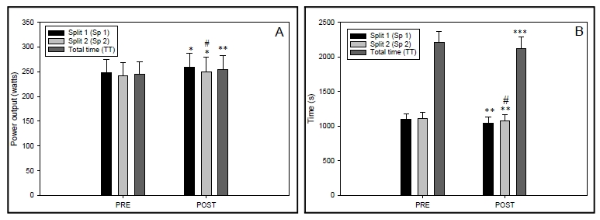
Mean performance time taken by the cyclists to complete the TTT was decreased by -4.2% (pre-: 2207 ± 161 s, post-: 2116 ± 175 s; P<0.001, t=4.81) between pre- and post-TTTs, ranging from -8.1% to 0.3%. (Fig. 5-A). More precisely, first and second split times were reduced significantly (P<0.01) by -4.6% and -3.7%, respectively, during pre- and post-TTTs. Mean total power output during the TTT was significantly improved by 4.1% (pre-: 244 ± 26 W vs post-: 255 ± 29 W; P<0.05, t=3.22) between pre- and post-TTTs, ranging from -4.3% to 12.3%. (Fig. 5-B). A correlation of -0.852 (P<0.001) was observed between the improvement in mean power output and the decrease in completion time during the TTT. We did not see any significant difference in blood lactate concentrations between the end of pre- and post-TTTs.
Fig. 5.
*P<0.05, **P<0.01 and ***P<0.001 indicate significant differences from pre-testing. #P<0.01: significantly different from split 1. Data are presented as means ± SD.
Discussion
Our data indicate that the improvement in cycling performance during the TTT in response to the training program was mainly the result of changes in peripheral physiological variables rather than by enhancement of maximal physiological values. Despite the fact that the workload of repeated high intensity interval bouts was 15% over MAP, only physiological sub-maximal parameters were improved.
Cardiac adaptations
Although training program effort bouts were over MAP (115%), maximal cardiac physiological parameters were unchanged, including HRmax, SVmax and Qmax. We suggest that average load, the ratio between high intensity and recovery bout times in our protocol, was insufficient to induce maximal cardiac adaptations. Indeed, with intervals of 20 s at 115% of MAP with recovery periods of 40 s at 50% of MAP, measured maximum average load ranged from 78.4 to 80.6% VO2max (Δ15 min - 60 min; ↑2.2%) in pre-training session and from 74.8 to 76.5% VO2max (Δ15 min - 60 min; ↑1.7%) in post-training session. Neary et al. (2002) reported that cardiac adaptations were observed in a training program that targeted a higher average intensity load, apparently ranging from 85 to 90% of VO2max, with HR monitoring during exercise training rather than monitoring cycling power output. Laursen, Shing, Peake, Coombes, & Jenkins (2005) suggested that peripheral adaptations rather than cardiac adaptations are likely responsible for the improved performance witnessed in well-trained endurance athletes after various forms of HIT programs. According to Blomqvist & Saltin (1983), the increases in Q and SV seem to depend on a period of prolonged, sub-maximal, constant work for the heart. Daussin et al. (2007) observed increased Qmax measured with a Physio Flow apparatus in untrained participants performing 8 weeks of HIT. However, the average load of their training intensity intervals was apparently lower (1 min at 90% of MAP - 4 min at ≈50%) than in our study. Gorostiaga, Walter, Foster, & Hickson (1991) showed that interval training programs in the form of 30 s of intense effort at 100% of MAP and 30 s of recovery effort at 50% of MAP, 30 min a day, 3 times a week, for 8 weeks in untrained participants, was effective in increasing absolute and relative VO2max. On the other hand, Prieur & Mucci (2012) determined that 3 sets of 6 intervals of 30 s at 120% of maximal aerobic running speed separated by 30 s of passive recovery between intervals and 6 min of passive recovery between sets, repeated 3 times per week for 6 weeks in untrained males did not enhance VO2max. In the present study, no significant gain was associated with absolute VO2max (L/min) in our participants, even if 7 of the 10 participants improved their absolute VO2max (L/min).
Skeletal muscle oxygenation
The training program did not significantly change maximal Δ[HHb] and maximal Δ[THb], a result that is consistent with other studies with non-athletic (Costes et al., 2001) and athletic participants (Neary, McKenzie, & Bhambhani, 2002) but is in contrast to others with non-athletic subjects (Prieur & Mucci, 2012; Proctor, Miller, Dietz, Minson, & Joyner, 2001). However, we observed decreased Δ[HHb] during sub-maximal stages of MAPT. Proctor et al. (2001) observed decreased leg O2 uptake during sub-maximal cycling after high-intensity aerobic training in healthy non-athletic men and women. In contrast, Prieur & Mucci (2012) found that Δ[HHb] was greater during sub-maximal intensity after a HIT program. This discrepancy may be attributed to the fact that our results and those of Proctor et al. (2001) were presented in absolute power output (W) and those of Prieur & Mucci (2012) were expressed in %VO2max. Since their data were reported as percent of pre- and post-training VO2max, a given increase in relative intensity may represent a higher workload increment after than before training, resulting in higher Δ[HHb]. To better appreciate improvement in cycling efficiency, we suggest that data should be presented for the same absolute exercise intensity between pre- and post-training. The Δ[HHb] reduction observed in this study was consistent with decreases in VO2 and VE during the incremental test, indicating better sub-maximal cycling efficiency. Boone, Koppo, Barstow, & Bouckaert (2009) observed that well-trained cyclists demonstrated lower Δ[HHb] for a given power output during a ramp exercise test compared to physically-active students.
Several physiological mechanisms may explain why oxygenation in skeletal muscles for a given sub-maximal intensity was increased after the training program in trained subjects. This increase in skeletal muscle oxygenation was perhaps a consequence of reduced ATP cost of muscle force production, lowering the O2 cost of sub-maximal exercise (Bailey et al., 2010). McDonough, Behnke, Padilla, Musch, & Poole (2005) also reported that the relationship between O2 delivery and O2 extraction depended on fiber type in rats. Fast-twitch fibers are characterized by greater fractional O2 extraction than slow-twitch fibers. Slow-twitch fibers have less O2 extraction and consequently lower arteriovenous oxygen difference (Boone et al., 2009). A higher percentage or recruitment of oxidative slow-twitch fibers may delay the recruitment of fast-twitch fibers during sub-maximal intensity. Szentesi, Zaremba, van Mechelen, & Stienen (2001) demonstrated that ATP utilization for sarcoplasmic reticulum calcium pumping in slow-twitch fibers was considerably lower than in fast fibers, increasing cycling efficiency during sub-maximal intensity in their study. Costes et al. (2001) showed that oxygen saturation in skeletal muscle measured by NIRS was improved during heavy sub-maximal workload and that adaptation was the result of increased capillary, blood volume and oxidative enzyme capacities, thus increasing the surface available for blood-tissue exchange and enhanced ATP turnover. In our study, skeletal muscle THb was not significantly different between pre- and post-MAPTs and between the first and eighth training sessions. It suggests that lower Δ[HHb] in our study was related to a greater oxidative cellular efficiency resulting in better sub-maximal cycling efficiency. Moreover, blood lactate concentrations were decreased for a given workload in post-MAPT, a condition that may improve oxygenation. According to Grassi, Quaresima, Marconi, Ferrari, & Cerretelli (1999) and Stringer et al. (1994), lactic acidosis is an important contributor to O2 dissociation from hemoglobin during exercise.
The decreased metabolic cost of breathing, proposed by lower pulmonary ventilation, may participate in this reduction of VO2 as well as in lower myocardial O2 consumption, a consequence of diminished myocardial work at the same absolute workload, as reported by Blomqvist & Saltin (1983). HR in sub-maximal stages was significantly decreased between pre- and post-MAPTs. Moreover, it is possible that the significantly reduced VE/VO2 and VE could also be linked to better peripheral O2 delivery/use. This means that, for a given quantity of oxygen consumed, a lower quantity of air has to be ventilated.
Performance during the TTT and the ST
Our data demonstrated a significant relationship between improvement in absolute mean power output and improved performance duration during the 13.2-km TTT. Participants who completed the 13.2-km TTT in less time generated higher mean power, as in previous study (Westgarth-Taylor et al., 1997). On the other hand, in agreement with Westgarth-Taylor et al. (1997), no relationship was observed between the decrease in time-trial performance time and improvement in MAP. However, improved performance in our study was probably more attributable to peripheral than to cardiac adaptation increases, since we did not witness any change in Q, as opposed to alterations in sub-maximal skeletal oxygenation during MAPT. These results are in accordance with those of Neary et al. (2002) who showed that muscle deoxygenation was significantly greater without change in pulmonary oxygen consumption and in O2 pulse during faster simulated performance testing after short-term endurance training at 85-90% VO2max in experienced male cyclists. Also, increased maximal aerobic power was not correlated to improvement in performance time, and it is possible that cycling efficiency was related to enhanced performance. Moreover, the capacity of skeletal muscle to buffer H+ ions is another mechanism that could contribute to improved performance. Thus, improved skeletal muscle buffering capacity could indirectly contribute to enhanced glycolytic ATP yield and higher exercise intensity by ameliorating PKF activity (Laursen & Jenkins, 2002). Significant improvement of the TTT and fatigue index during the ST may indirectly indicate an improved buffering capacity in skeletal muscle with SMIT.