Temporal plasticity of the relative age effect in ice hockey: The case of elite minor players in Québec
International Journal of Applied Sports Sciences, Vol.27, No.1, pp.14-25
ⓒ Korea Institute of Sport Science
초록
In most sports which are age-grouped annually, players born in the early part of a grouping period are more frequently found in subsequent categories over others from their cohort. This phenomenon is called the relative age effect (RAE). The goal of this research is to determine the impact of shifting the eligibility period on the RAE in elite minor ice hockey players in Québec. From 2002 to 2008, the reference date for allocating categories began October 1. In 2008, it was moved back to January 1. The RAE is reported for 6 seasons, 3 before and 3 after the reference cut-off date was moved back to January 1. Data from the 2005-2006 to 2010-2011 seasons were available for 13,982 minor ice hockey players. The RAE was present in each season before and after the reference date shift in 2008, as indicated by a significant over-representation of players from the 1st quarter of each competitive year whether it began October 1 or January 1. As an example, players born in the first trimester (October to December) of the eligibility year 2007-2008 represented 44.94 % of all Midget AAA players. After the shift, players from the first trimester (now January to March) of the 2010-2011 season were representing 41.57 % of all Midget AAA players and players from the fourth quarter (now October to December) were representing 12.16 %. Results confirmed the presence of a RAE in elite minor ice hockey whatever the beginning of the eligibility period. The RAE is a robust phenomenon and its impact is re-established rather rapidly when the cut-off date is changed.
Abstract
In most sports which are age-grouped annually, players born in the early part of a grouping period are more frequently found in subsequent categories over others from their cohort. This phenomenon is called the relative age effect (RAE). The goal of this research is to determine the impact of shifting the eligibility period on the RAE in elite minor ice hockey players in Québec. From 2002 to 2008, the reference date for allocating categories began October 1. In 2008, it was moved back to January 1. The RAE is reported for 6 seasons, 3 before and 3 after the reference cut-off date was moved back to January 1. Data from the 2005-2006 to 2010-2011 seasons were available for 13,982 minor ice hockey players. The RAE was present in each season before and after the reference date shift in 2008, as indicated by a significant over-representation of players from the 1st quarter of each competitive year whether it began October 1 or January 1. As an example, players born in the first trimester (October to December) of the eligibility year 2007-2008 represented 44.94 % of all Midget AAA players. After the shift, players from the first trimester (now January to March) of the 2010-2011 season were representing 41.57 % of all Midget AAA players and players from the fourth quarter (now October to December) were representing 12.16 %. Results confirmed the presence of a RAE in elite minor ice hockey whatever the beginning of the eligibility period. The RAE is a robust phenomenon and its impact is re-established rather rapidly when the cut-off date is changed.
Introduction
Grouping by age is widespread in most sports. The intended goal of age grouping is to standardize the caliber of players and enable young people to have equal opportunities to develop in their sport (Cobley et al., 2009; Wattie et al., 2007). Nevertheless, birth date within an eligibility period still has a major impact on the selection of players in elite sports (Musch & Grondin, 2001). For most competitive sports, the likelihood of being selected in an elite league is uneven across birth months, with players born earlier within an eligibility period having better odds of reaching higher levels. This well-known phenomenon, referred to as the relative age effect (RAE), is present in most team sports like soccer (Ostapczuk & Musch, 2013), baseball (Nakata & Sakamoto, 2013), netball (Edwards & O'Donoghue, 2014) and handball (Schorer et al., 2013), as well as in individual sports, like junior and youth athletics (Hollings et al., 2014), swimming (Costa et al., 2013), ski jumping, cross-country skiing, alpine skiing, snowboarding, and Nordic combined (Baker at al., 2014). RAE has been well documented in ice hockey (Cobley et al., 2009). Numerous studies have first demonstrated its presence in National Hockey League (NHL) alignments in the 1980s (Barnsley et al., 1985; Daniel & Janssen 1987; Grondin et al., 1984). The phenomenon has subsequently been investigated under several angles. Some researchers have focused on NHL alignments (Barnsley et al., 1985; Boucher & Mutimer 1994; Côté et al., 2006; Daniel & Janssen 1987; Grondin & Trudeau, 1991; Nolan & Howell, 2010; Wattie et al., 2007), player drafts by NHL teams (Baker & Logan, 2007), Canadian junior hockey league (CJHL) player alignments (Barnsley et al., 1985; Grondin et al., 1984; Nolan & Howell, 2010), fast tracking (Sherar et al., 2007) and minor ice hockey (Baker et al., 2010; Barnsley & Thompson, 2010; Boucher & Mutimer, 1994; Grondin et al., 1984; Sherar et al., 2007).
The RAE was shown to change after modification of the cut-off date in Belgian soccer players (Helsen et al., 1998). Musch & Hay (1999) also observed a RAE in 2 cohorts of Australian soccer players with 2 different selection dates during different years. We defined this phenomenon as a temporal plasticity of the RAE. Plasticity refers to the « capacity for being molded or altered. » (Merriam-Webster Dictionnary, 2014). However, such results had never been obtained in ice hockey. The main purpose of our study is to determine how switching the cut-off date in minor ice hockey organisation in a large population affects the RAE. Cut-off dates in amateur sport are rarely changed (Helsen et al., 2000), but it just so happened that Hockey Québec decided to move the cut-off date of different amateur leagues in the province from January 1 to October 1 in 2002, and moved it back to January 1 in 2008. Indeed, ice hockey in Québec offers an opportunity to see how much time it takes before an initial RAE (due to a given cut-off date) is washed out by a new RAE. In Canada, each province has its own sport-governing organisation that regulates ice hockey. Moving the cut-off date to October 1 was motivated by a willingness to match the system with school dates in Québec, whereas the return to January 1 was an attempt to standardise age categories with the rest of Canada. From a scientific standpoint, these changes were a great occasion to test the RAE but also to verify its capacity to adapt to changes of the eligibility year.
We therefore analyzed the impact of birth date quarter on the selection of elite ice hockey players in Québec before and after the cut-off date was shifted in 2008. By assessing the proportions of elite players born in each quarter through the various playing levels [i.e., players from 11 to 16 years old (yo)], it was possible to verify when, if at all, the RAE was present in the minor ice hockey system in Québec, despite a change in the reference date. In other words, if children born between October and December were older in their age category during the first few years of their development, which should result in over-representation, would they still remain over-represented once their quarter of birth is moved back to the most disadvantageous position, as was the case in Québec hockey in 2008? Secondary purposes of the study were to verify RAE progression after change of the cut-off date according to different age categories, playing position, weight and height of players from specific groups, with available data (i.e., 15-16yo). Since elite team coaches tend to select athletes who are more advanced in terms of physical maturity, i.e., good players with big stature had more chances of being selected than smaller ones (Baker et al., 2010), and taller and heavier players could be associated with the RAE. Therefore, physical maturity is a variable in player selection that favours older players in their progression in a cohort (Sherar et al., 2007).
Methods
Data collection and processing
The study targeted the best minor ice hockey male players in Québec: all Peewee AA (11-12yo; n= 4849), Bantam AA (13-14yo; n=4779), Midget AAA (15-16yo; n=1541) and Midget espoir (15yo; n=2813). Hockey Québec (the provincial governing organisation) provided spreadsheet files (Microsoft Excel®) that included lists of players for the 2005-2006 to 2010-2011 seasons, at each of the afore-mentioned levels. Ice hockey in Québec has its own categorisation methods. Players are grouped in increments of 2 years, according to several hierarchical classifications. The selection of players is based on a subjective appraisal of ability and potential as perceived by coaches. Hancock et al. (2014) propose that players’ selection by coaches is usually «based on size and skill». This is a process where bias and coaches’ belief may be determinant in the selection of a player. Players from double letter categories (AA, BB, CC) are considered elite players. Players who do not qualify or do not want to play at these levels remain in the non-competitive league. Midget AAA is the highest levels of minor hockey and is composed of 16yo players completed with the 75 best 15yo players. Midget espoir is composed only with 15-yo that were not among the 75 players recruited in the Midget AAA.
All Excel® files included the same information, i.e., full name of players, their gender, birth date, locality, minor ice hockey association, team name and position. However, player names, team and association names were removed from our results on request from our ethics committee. In addition, all data were treated confidentially, and will be destroyed 5 years after the publication of this study. The Ethics Committee for Research on Human Participants of Université du Québec à Trois-Rivières approved the project.
Prior to analysis, we checked all files visually, to verify that all data were present and consistent. Player positions were limited to 2 terms, as either players or goalkeepers, because of lack of precision in the lists provided by Hockey Québec. Therefore, defence and forward players were pooled in the group. The only exceptions were 15-16yo players whose positions – defence, forward or goalkeeper – were reported accurately (Table 4). Once original spreadsheet (xls format) files were prepared, we created a single file containing all data. This file was subsequently transferred to the Statistical Package for Social Sciences (SPSS 17.0) for data analyses.
Data analyses
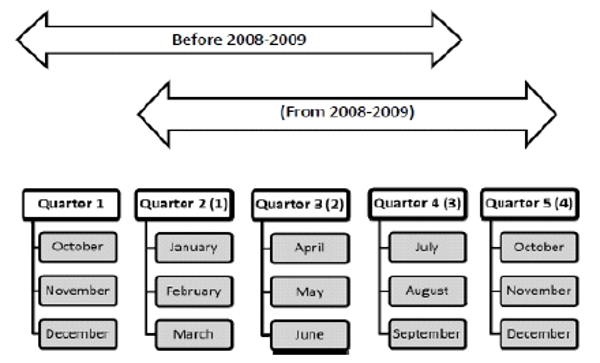
Breakdown into quarters. The main task was to examine whether the distribution of players across quarters (or trimesters) of birth dates corresponded to uniform distribution between quarters. In this research, the notion of 1st, 2nd, 3rd and 4th quarters refers to a partition of the yearly eligibility period and not necessarily to the calendar year. As we will see, the 1st quarter for the seasons 2005-2006 to 2007-2008 refers to the months October to December of the years 2005, 2006 and 2007, while the last quarter refers to the months of July-August-September of the years 2006, 2007 and 2008 (Figure 1). For the years 2008-2009 to 2010-2011 (after the switch), the eligibility year began on January 1 and ended on December 31.
Fig 1.
Composition of birth quarters before and after(parentheses) the cut-off date shift
First, we compared the distribution of players in each quarter for all players in the same category, for each of the 6 seasons. This process was repeated for every category (11-12yo (pee-wee), 13-14yo (bantam), 15-16yo (midget AAA) and 15yo (midget espoir) as shown in Table 1. The chi-square goodness-of-fit test was performed to study distributions in each category, in the 3 years before the age shift and for the next 3 seasons. Significance level (α) was set at 0.01, and Cramer’s V statistic, based on chi-square, estimated effect size. As for statistical power of the chi-square test, due to the relatively large sample sizes, estimated power values exceeded 0.999 for every significant result.
Table 1.
Percentage distribution of players in Peewee (11-12yo) and Bantam (13-14yo) categories (pooled) according to their position and birth quarter for the 2005-2006 to 2007-2008 and 2008-2009 to 2010-2011 seasons (arrows indicate the beginning of the eligibility year)
| 2005-2006 to 2007-2008 (before the switch) | |||||||
|---|---|---|---|---|---|---|---|
| N | →Oct-Nov-Dec | Jan-Feb-March | Apr-May-June | July-Aug-Sept | X2(df=3) | Cramer’s V | |
| Players | 4,081 | 35.92% | 30.73% | 20.44% | 12.91% | 520.77* | 0.206 |
| Goalkeepers | 521 | 39.16% | 29.37% | 18.62% | 12.86% | 84.93* | 0.233 |
The sample was also analysed by player position. First, to obtain a larger sample, 11-12yo and 13-14yo categories of all player positions (defencemen and forward) were pooled. Subsequently, the distribution of goalkeepers in each birth quarter for the 2005-2006 to 2007-2008 seasons was compared to that of the 2008-2009 to 2010-2011 seasons, with the chi-square test. The same procedure was subsequently performed with forwards and defencemen. This analysis was again undertaken with the chi-square test, comparing the distribution of players by position across quarters. Each of the 3 seasons before and after the age change was tested.
Birth quarter distribution in Québec. In the literature, as a reference group, birth distribution characterizing the population is recommended (Barnsley et al., 1985; Grondin et al., 1984). This was also done in our study. With statistics compiled by Statistics Canada (statcan.ca), it was possible to calculate the average number of births of Quebecers per quarter in the years 1991 to 2000 (total N=849,726), since the hockey player sample considered in our study came from this population.
Anthropometric data. The weight and height of 15-16yo players born in the different quarters as measured by the Drafting Support Committee of the Québec Major Junior Hockey League were analysed. Data for the 2005-2006 to 2010-2011 seasons were pooled for this analysis. Each of the 2 dependent variables was submitted to one-way analysis of variance (ANOVA).
Results
Birth quarter per category
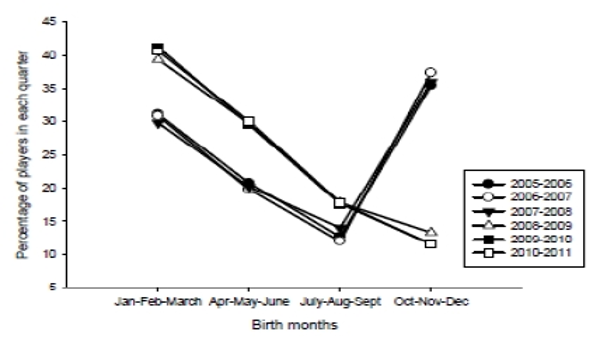
Peewee (11-12yo) and Bantam (13-14yo). Overall, the distribution of 11-12yo and that of 13-14yo players by birth quarter for each of the 2005-2006, 2006-2007 and 2007-2008 seasons, prior to change of the cut-off date, was very similar (Table 1, Figure 2). We then pooled the 3-year pre- and post-date shift and presented the data in Table 1 separated by position (players and goalkeepers). Over-representation of the October to December quarter (1st quarter of the eligibility year) along with growing under-representation of the following quarters was observed. After the cut-off date shift, the distribution of players by birth quarter changed towards over-representation of the “new” 1st quarter (January to March) and growing under-representation of the “previous” 1st quarter (October to December) (Table 1 and Figure 2). In either case, effect size (φ) ranged from medium (≈0.300) to large (≈0.500). The results were similar for goalkeepers and players.
Fig 2.
Distribution of Peewee (11-12yo) and Bantam (13-14yo) players according to their birth quarter before and after the cut-off change in 2008-2009. The cut-off date is October 1 for the seasons 2005-2006 to 2007-2008, and January 1 for 2008-2009 to 2010-2011.
Midget AAA (15-16yo). Table 2 reports the distribution of 15-16yo players for the 2005-2006 to 2010-2011 seasons. It is clear that changing the cut-off date had no significant effect on the distribution of 15-16yo players but still reproduced a RAE. Again, the only difference was that the RAE started at a different date. As shown in Table 2, when quarters were aligned by their order in their respective reference year, there was a clear effect of relative age on player distribution, notwithstanding the 2008-2009 date transition. Here again, effect sizes were large.
Table 2.
Percentage distribution of Midget AAA (15-16yo) players according to their birth quarter (the cut-off date was October 1for 2005-2006 to 2007-2008, and January 1for 2008-2009 to 2010-2011)
| 2005-2006 to 2007-2008 (before the switch) | |||||||
|---|---|---|---|---|---|---|---|
| Season | N | →Oct-Nov-Dec | Jan-Feb-March | Apr-May-June | July-Aug-Sept | X2(df=3) | Cramer’s V |
| 2005-2006† | 304 | 39.47% | 26.32% | 18.75% | 15.46% | 41.50* | 0.213 |
| 2006-2007† | 279 | 44.09% | 23.30% | 18.28% | 14.34% | 50.71* | 0.246 |
| 2007-2008† | 267 | 44.94% | 23.97% | 16.48% | 14.61% | 61.68* | 0.277 |
Table 3.
Percentage distribution of Midget espoir (15yo) players by birth quarter for the 2005-2006 to 2007-2008 seasons and after the shift in 2008-2009
| 2005-2006 to 2007-2008 (before the switch) | |||||||
|---|---|---|---|---|---|---|---|
| Season | N | →Oct-Nov-Dec | Jan-Feb-March | Apr-May-June | July-Aug-Sept | X2(df=3) | Cramer’s V |
| 2005-2006† | 460 | 29.35% | 30.65% | 24.57% | 15.43% | 26.23* | 0.138 |
| 2006-2007† | 463 | 30.89% | 27.65% | 23.76% | 17.71% | 17.84* | 0.113 |
| 2007-2008† | 465 | 32.90% | 29.25% | 24.95% | 12.90% | 42.19* | 0.174 |
Midget espoir (15yo). For 15yo players, the pattern was very similar to that of the 2 previous categories. However, the effect seemed less pronounced, although significant, than in the 11-12yo and 13-14yo categories, with effect sizes between small and medium, except for the 2010-2011 season where the V index was more pronounced. From 2005 to 2008, players were over-represented in the 4th quarter, whereas those of the 3rd quarter ended up being under-represented (Figure 3, Table 3). A new RAE in 15yo was reinstated for the 3 seasons after the cut-off date change in 2008. Interestingly, we discerned that after the cut-off change, the RAE moved gradually towards the new distribution. Although already significant in the 1st year, the effect got stronger from the 1st to the 3rd year after the cut-off shift (Table 4). Moreover, it was possible to visualise the distribution of players by birth quarter before and after the cut-off date change: the effect was less pronounced and less consistent than for 11-12yo and 13-14yo players.
Fig 3.
A. Distribution of 15-16y (Midget AAA) players according to their birth quarter for the 2005-2006 to 2010-2011 seasons. The cut-off date was October 1 for the seasons 2005-2006 to 2007-2008, and January 1 for 2008-2009 to 2010-2011.
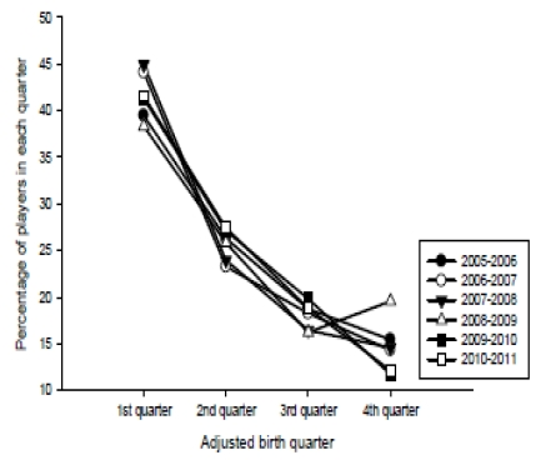
Table 4.
A. Distribution of 15yo Midget AAA players by birth quarter and position for the pooled seasons 2005-2006 to 2010-2011. The first quarter of the eligibility season began October 1 for the years 2005-2006 to 2007-2008, and the first eligibility quarter began January 1 for the years 2008-2009 (before the switch) to 2010-2011 (after the switch)
B. Mean height and weight (± SD) of 15yo Midget AAA players as a function of birth quarter during an eligibility year (seasons 2005-2006 to 2010-2011 pooled)
| Birth quarter | |||||||
|---|---|---|---|---|---|---|---|
| 1st(n=206) | 2nd(n=118) | 3rd(n=75) | 4th(n=37) | Total (n=436) | Cramer’s V | ||
| Height (m) | 1.77±0.14 | 1.78±0.05 | 1.78±0.05 | 1.78±0.05 | 1.78±0.10 | NS | |
| Weight (kg) | 75.26±7.67 | 74.52±7.30 | 74.37±6.34 | 75.73±8.59 | 74.95±7.43 | NS | |
Distribution of players by playing position and anthropometry
For the 11-12yo and 13-14yo categories, the RAE was found for all players regardless of their playing position (goalkeepers, forwards and defencemen combined). This observation applied to data obtained before as well as after the cut-off date move in 2008 (Table 1).
For 15yo players from Midget AAA, thanks to more detailed information available from rosters, we were able to consider goalkeepers, defencemen and forwards separately. Position analysis was performed for the 6 pooled seasons (Table 4A). Among forwards, 7.6 times more players were born in the 1st than in the 4th quarter (129 vs. 17) during the 6 seasons examined. For defencemen, nearly 6 times more players were born in the 1st quarter than in the 4th (65 vs. 11). Goalkeepers were not significantly affected by the RAE.
Anthropometric data in 15yo players. Analysis was performed of 15yo players for whom anthropometric data were available through player distribution according to their birth quarter (Table 4B). As confirmed by ANOVA, no differences were observed for average height (F(3,432) = 0.34, p > 0.05) or weight (F(3,432) = 0.55, p > 0.05) of players from the different birth quarters.
Discussion
The main objective of our study was to investigate the impact of shifting the age tables of Québec minor ice hockey players in 2008 from a cut-off date starting October 1 to January 1. Before the 2008-2009 season, players born in October, November or December were the oldest in their cohort. After the cut-off date shift, they suddenly became the youngest in their eligibility year. A second purpose of the study was to determine RAE progression in the selection of elite players in Québec according to the league, their playing position, height and weight.
The RAE in Québec ice hockey. According to our results, there is no doubt that the RAE is present in elite minor ice hockey in Québec. Our data tell us unequivocally that the oldest players in an eligibility year have more chances of being drafted at a higher level than younger players. This advantage is reflected in the disproportionate distribution of players by birth quarter, the 1st quarter of the eligibility year having more chances to be found in the roster of elite minor hockey teams. These results for 11-12yo and 13-14yo players are consistent with several studies conducted around elite minor ice hockey in Canada (Baker et al., 2010; Barnsley & Thompson, 1988; Boucher & Mutimer 1994; Grondin et al., 1984; Sherar et al., 2007). However, it is important to specify that our investigation shows a regular and distinctive decrease in the distribution of players from the 1st to the 4th quarter, whatever the eligibility period. In 6 consecutive years, we observed the distribution of players by relative age per quarter, year after year, which was indicative of a RAE despite a change in the cut-off date. Indeed, no study has demonstrated the RAE in several consecutive seasons of minor ice hockey cleaved by a cut-off date shift.
For the 15-16yo and 15yo player leagues (Midget AAA and Midget espoir), the results concur with those on 11-12yo and 13-14yo players although they are not as salient. Over-representation of the first 3 months of an eligibility year and under-representation of the last quarter are equally obvious, although they are mitigated. Moreover, these findings corroborate those of Grondin and colleagues (1984) who analyzed the birth dates of 15-16yo players in the 1981-1982 season. Furthermore, a Nova Scotia study reported an imbalance in birth quarters for 15-16yo players in this Canadian province (Boucher & Mutimer, 1994). The original aspect of our investigation is the demonstration that the RAE will obey the cut-off date shift so that players born 3 months after the start of the eligibility year will be more represented in elite ice hockey.
Montelpare et al. (2003) hypothesized that if Québec changed its cut-off date to October 1, instead of January 1, the last 3 months of the year would become the most represented. Our study confirms Montelpare’s hypothesis. From 2005 to 2008, when the cut-off date was October 1, higher proportions of 11-12yo and 13-14yo players were born in October, November or December as they were the oldest of their cohort. After the cut-off date shift in 2008, the overall portrait of players changed drastically. The distribution of 11-12yo and 13-14yo players born in October-December declined from 36% for the 2007-2008 season to 13.3% for the 2008-2009 season after the cut-off switch (589 vs. 221). This under-representation of players from the last quarter of the eligibility period persisted in the following seasons. Thus, there is no doubt that moving the cut-off date has almost instantly changed the distribution of players by birth quarter, advantaging older cohorts and disadvantaging younger ones. These results confirm those of Musch and Hay (1999), who observed the outcome of moving the cut-off date on the RAE in Australian soccer. Among others, they noted that moving the cut-off date in 1989 subsequently moved the quarterly birth breakdown of professional soccer players in Australia. The same phenomenon was noted by Helsen et al. (2000) in Belgian youth soccer players when the Belgian Soccer Federation changed the cut-off date in 1997-1998.
Moving the cut-off date for minor ice hockey in Québec was undoubtedly justified in order to comply with the rest of Canada, but it resulted in ejection of some players from the elite level. The months of October, November and December were represented by 589 11-12yo and 13-14yo players in 2007-2008 versus only 221 in 2008-2009, reflecting a decrease of 62.5% in the number of players in this quarter just through a cut-off date change.
An overview of the data pertaining to post-shift years, in Table 2, suggests a possible stepping up of the RAE across quarters in 15yo and, to a lesser extent, in 15-16yo players. Measuring this effect with δ = (4th trimester – 1st trimester) / n, we obtain δ ≈ 0.1591, 0.1694 and 0.2395 for the 3 post-shift seasons. These global results were analyzed first by transforming the above proportions according to Fisher’s arc sine method (Sokal & Rohl, 1995), with approximate variance 1/(4xn), then calculating the statistic of Barlow et al. (1972) to test the monotonic increase across seasons (Laurencelle & Dupuis, 2000). The obtained value, = 11,393, significant at the 0.01 threshold (critical value of 6.823), confirms an increment of the RAE from the 1st to the 3rd post-shift seasons. This helps unravel RAE dynamics, gaining in importance (and statistical significance) along the years immediately after the cut-off change in 15yo players. From another perspective, we can even say that before 2008, many players were developed who unfortunately ended up being 4th quarter-ejected from elite midget ice hockey without access to a higher playing level.
Playing position and the RAE. At the 11-12yo and 13-14yo levels, the results are clear: goalkeepers and other players are equally affected by this phenomenon. Regarding 15-16yo players, goalkeepers were not affected, but small sample size did not enable us to draw a definite conclusion. These results are not consistent with those of Grondin and Trudeau’s (1991) study where the RAE was found to be stronger among defencemen and goalkeepers. However, it is important to specify that their pool was restricted to NHL players and did not include minor league players.
Height and weight of elite players. Anthropometric measurements showed that the height and weight of 15-16yo players were equal from one birth quarter to another. Grondin and Trudeau (1991) obtained similar results with Canadian players in the NHL. Furthermore, Baker et al. (2010) determined that there were no significant anthropometric differences between players of different quarters in the Atom category (9-10yo). However, this does not preclude that other developmental characteristics are different across quarters (e.g. motor skills). In their study, Sherar and colleagues (2007) compared anthropometric data on selected ice hockey players vs. non-selected players. They found that selected players were taller and heavier than non-selected players (2007). According to them, the coaches selected more physically mature players. The results of Baker and colleagues (2010) go in the same direction. From the viewpoint where developing a national elite team would be the ultimate goal, such a selection mode would not serve a national sport system well. The Amsterdam Growth and Health Longitudinal Study has shown that individuals biologically delayed in terms of maturity tend to become stronger than biologically-advanced subjects (Kemper, 2004). The ice hockey community would therefore benefit by retaining able but actually less physically mature players who would reach their full potential later. Furthermore, it was shown that a substantial dropping out is observed amongst athlete who were successful at a young age (Barreiros et al., 2014). As for the remaining course in an ice hockey career, the literature shows that these inequalities in player distribution by birth quarter persist in the CJHL (Barnsley et al., 1985; Grondin et al., 1984; Nolan & Howell, 2010; Sherar et al., 2007) and the NHL (Barnsley et al., 1985; Boucher & Mutimer 1994; Grondin & Trudeau, 1991; Nolan & Howell, 2010; Wattie et al., 2007).
Solutions to reduce the RAE. It thus seems important to reduce the conditions favouring RAE to give the greatest possible number of young ice hockey players the chance to benefit from equally good facilities and coaching interventions. Many solutions have been proposed by different authors. For instance, we should give as much ice time to all young players, regardless of their class and birth quarter, and avoid early specialisation of players (Balyi et al., 2010).
Hurley et al. (2001) offered three potential solutions. First, they proposed to create smaller and shorter-span categories to allow more players of a given age to have access to the elite level. Secondly, they suggested dividing players according to physical maturity. Another similar suggestion would be to categorize players by their weight as it was shown that no RAE exists in France for boxing probably due to the weight categorization (Delorme, 2014). These solutions, although logical, may be far too complex and costly to manage. Some authors also proposed schedule turnover to advantage every birth quarter in turn over the curriculum of a player, along the lines of Grondin et al. (1984) and Boucher and Halliwell (1991). More recently, Grondin (2012) proposed to increase the number of ice hockey seasons from 1 to 2 within a year, with different cut-off dates for each season. Hancock et al. (2014) hypothesized an interesting succession of events to explain the advent of RAE at an early age that may be helpful for interventions wishing to decrease the RAE in ice hockey. For younger boys (<9 years old), parents seem to induce RAE by postponing the enrollment of their children if they feel that he is not ready or too small to a start playing hockey. Therefore, this creates an overrepresentation of boys born earlier in the eligibility year. Later, from the age of 9 years old, selection by coaches may become more important. At that point the coaches’ criteria are probably the players’ size and hockey skills (Hancock et al., 2014). As suggested by a recent paper on the talent development program in German football, motor and physiological performance tests used for selection of young players should be carefully chosen not to compound the relative age effect (Vottler & Höner, 2014). Indeed, if the result of a test is increased by maturation (i.e. if they show covariance), the player born later during the year will be further disadvantaged if coaches consider its stature and its results to the test. As pointed out by Helsen et al. (1998), this may be confused with talent whereas it is more related to level of maturity.
Study limitations and strengths
Although we analyzed data from 6 different seasons, we are aware that we are not facing a brand new sample of players each season. Some players remain in the top level season after season, for example, by playing 2 consecutive seasons in the 12-13yo category. It is difficult to assess the rate of transfer from one season to another. Certainly, it is neither 0% nor 100%. However, it is definite that, in each season, a new cohort graduates in the 11-12yo category and another transits to 13-14yo and 15yo. Moreover, new players enter and exit the AA level each year. A strength of our study is that it analyses the distribution of players across birth quarters before and after moving the cut-off date. Our study therefore confirmed Montelpare et al. (2003) hypothesis and adds evidence to the “plasticity” of RAE seen in soccer players (Helsen et al., 1998; Musch & Hay, 1999).
Conclusion
The purpose of our research was to determine the impact of shifting the eligibility period on the RAE in elite minor ice hockey players in Québec. From 2002 to 2008, the reference date for allocating categories began October 1. In 2008, it was moved back to January 1. Before the shift, a RAE was present in each season. After the shift the relative age effect reappeared in favour of player who became the older of their category, demonstrating the plasticity of the RAE phenomenon. Results confirmed the presence of a RAE in elite minor ice hockey whatever the beginning of the eligibility period. Also, we ascertained that the RAE remained robust, even after a shift of the eligibility date, the advantage moving toward the newly-defined 1st quarter. It is not only a problem of equal opportunity but also a problem of sports potentially losing gifted athletes because of an arbitrary classification system. There is no doubt that older players, physically and psychologically mature, have a significant advantage over others in their cohort when the competition gets fierce for places in elite teams. Our study demonstrates that this benefit persists at least until 15-16yo where the over-representation of players 15yo in the 1st quarter is highly significant. Yet, our results indicate that, at least in Québec’s minor ice hockey, the RAE is already present and is potentially detrimental to the global efficiency of the sport. It would certainly be relevant to extend this type of study to other countries with different ways of defining the eligibility year. It would also be interesting to study interventions that aim to cushion the impact of the RAE on the selection of ice hockey players or other sports teams.
Collaboration of Hockey Québec was paramount to completing this project. With the help of Ms. Eve Asselin, Director of Member Services, Hockey Québec was kind enough to accede to our request by providing us with player lists for the study. This study was supported by a grant from the Social Science and Humanity Research Council/Sport Canada Research Initiative.