The Reliability and Validity of Various Lateral Side-Step Tests
International Journal of Applied Sports Sciences, Vol.26, No.2, pp.67-75
ⓒ Korea Institute of Sport Science
초록
The ability to change directions, cut, and move quickly is paramount to success in basketball. Lateral shuffling movements or side-steps are common in basketball, but few tests incorporate these movements in measures of change-of-direction speed. Furthermore, no reliability or validity information has supported the most popular test, the Edgren Side-Step Test, and the procedures for the Edgren Test have been inconsistent. This study examined 4 lateral shuffle tests (LST), which combined different distances (8 feet and 12 feet) and durations (6 seconds and 10 seconds). All 4 conditions of the LST had very good internal consistency as the Cronbach’s α for each was above 0.889. All 4 conditions had very good test-retest reliability as the ICC (3,1) for each was above 0.930. None of the 4 conditions was found to have a significant relationship with a 20m sprint, whereas the 8x10-LST, r=-0.640, p = 0.046 and the 8x6-LST, r =-0.648, p = 0.043 had a moderate negative relationship with the Hexagon Agility Test. No condition was found to be a discriminator between recreational and competitive basketball players. Based on the results, the LST-8x6 and LST-8x10 appear to be valid and reliable tests for measuring change -of-direction speed.
Abstract
The ability to change directions, cut, and move quickly is paramount to success in basketball. Lateral shuffling movements or side-steps are common in basketball, but few tests incorporate these movements in measures of change-of-direction speed. Furthermore, no reliability or validity information has supported the most popular test, the Edgren Side-Step Test, and the procedures for the Edgren Test have been inconsistent. This study examined 4 lateral shuffle tests (LST), which combined different distances (8 feet and 12 feet) and durations (6 seconds and 10 seconds). All 4 conditions of the LST had very good internal consistency as the Cronbach’s α for each was above 0.889. All 4 conditions had very good test-retest reliability as the ICC (3,1) for each was above 0.930. None of the 4 conditions was found to have a significant relationship with a 20m sprint, whereas the 8x10-LST, r=-0.640, p = 0.046 and the 8x6-LST, r =-0.648, p = 0.043 had a moderate negative relationship with the Hexagon Agility Test. No condition was found to be a discriminator between recreational and competitive basketball players. Based on the results, the LST-8x6 and LST-8x10 appear to be valid and reliable tests for measuring change -of-direction speed.
Introduction
Tests of change-of-direction speed (CODS) have used predominantly sidestep cuts from a straight-ahead sprint and rarely incorporated side-to-side movements like lateral shuffling (Brughelli, Cronin, Levin, & Chaouachi, 2008). The Edgren Side-Step Test has been one of a few tests to incorporate lateral shuffling movements, and the only one to test solely side-to-side movements (Brughelli et al., 2008). Because of the scarcity of tests that have included and measured side-to-side movements, the Edgren Side-Step Test has held a distinct position within the CODS literature.
Despite its distinct position, there has been no single Edgren Side-Step Test. Edgren (1932) devised a coordination test to measure the ability of participants to shift their bodies from left to right similar to a defensive player in basketball. The coordination test measured the time for participants to move side to side 10 times over a distance of eight feet (2.44 m) without crossing their feet. Since the Edgren test appeared in the literature, the Edgren Side-Step Test has appeared repeatedly (Chu & Shiner, 2006; Ebben & Blackard, 1997; Harman, Grahammer, & Pandorf, 2000; Markovic, Misigoj-Durakovic, & Trninic, 2005; Monte & Monte, 2007; Spori., Nagli, Milanovi, Talovi, & Jele. kovi, 2010; Tomchuk, 2010; Waghmare, Bondade, & Surdi, 2012), although the procedures have varied, most with little connection to the original coordination test.
Basketball games have been found to require a change in movement category every two seconds (Abdelkrim, El Fazaa, & El Ati, 2007; McInnes, Carlson, Jones, & McKenna,1995), and basketball players are involved in almost constant lateral movements (King & Cipriani, 2010). Male basketball players spent approximately 41% of a basketball game in “specific movements” defined as “shuffling, as well as any foot action that is different from ordinary walking or running” (Abdelkrim et al., 2007, p. 70). The various Edgren Side-Step Tests have been the most prominent tests of these shuffling movements (Brughelli et al., 2008), attesting to the importance of a consistent test within the literature.
Despite the prevalence of the Edgren Side-Step Test, no reference has published reliability or validity data to support its use, and the reliability and validity of the Edgren Side-Step Test has not been established (Brown, 2012). The purpose of this study was to unify the various Edgren Side-Step Tests into one test and establish the reliability and validity of this Lateral Shuffle Test (LST).
There were four parts to the study: (1) Establish the inter-trial reliability of four lateral shuffle tests that combined different distances (8 feet or 12 feet) and times (6 seconds or 10 seconds); (2) Establish the test-retest reliability of the four lateral shuffle tests; (3) Establish the construct validity of the lateral shuffle test as a measure of CODS; and (4) Establish the predictive validity of the lateral shuffle test for use with basketball players.
Methods
Experimental Approach to the Problem
Because there has not been a standard Edgren Side Step Test, this investigation chose the distance of the coordination test (Edgren, 1932), and the distance described by the National Strength and Conditioning Association (NSCA; Harman et al., 2000). The time described by the NSCA was used, and 6 seconds was chosen as an alternative, shorter time frame. The four conditions of the Lateral Shuffle Test (LST) were: (a) a distance of 12 feet (3.66m) for 10 seconds (LST-12x10); (b) a distance of 12 feet (3.66m) for 6 seconds (LST-12x6); (c) a distance of 8 feet (2.44m) for 10 seconds (LST-8x10); and (d) a distance of 8 feet (2.44m) for 6 seconds (LST-8x6).
Participants
The participants for parts 1, 2, and 4 were male college students (n = 23) enrolled in a basketball activity class at a university in the western United States. The participant characteristics were: age 21.78 +/- 4.25, height 180.77 +/- 8.51 cm, weight 80.40 +/- 15.16 kg. The participants were Caucasian (n = 18), Asian (n = 3), and African-American (n = 2). The participants in part 3 and 4 were male college basketball players (n = 10) at a community college in the western United States. The participant characteristics were: age 20.30 +/- 1.42, height 193.55 +/- 8.70cm, weight 89.04 +/- 9.21kg. The participants were Caucasian (n = 5), Asian (n = 2), and African-American (n = 3). No participant had sustained a significant ankle, knee, hip, or back injury in the prior 6 months. The study was approved by the University Institutional Review Board, and written participant consent was completed prior to the data collection.
Study Design
The study used a within-groups repeated measures design. The first part was a one-session study to determine inter-trial reliability. Participants performed three trials of four conditions: LST-12x10, LST-12x6, LST-8x10, and LST-8x6 (12 total trials). For each trial, participants started to their left. After a familiarization period, participants completed three test trials of each condition. Participants were given 60-90 seconds to recover between trials (Farlinger, Kruisselbrink, & Fowles, 2007). The 12 trials were completed in a randomized order in one session. All three trials for each condition were used to compute a Cronbach’s α as a measure of internal consistency.
The second part was a second session with the same participants used to measure the test-retest reliability of the four conditions. The second session occurred 48 hours after the initial session. Participants followed the same procedures as in day 1 and completed the 12 trials. The average of the three trials from day 1 and the average of the three trials from day 2 for each condition were used to determine the intraclass correlation coefficient (ICC) model 3,1.
The third part was completed in one day using the college basketball players. The participants performed one trial of six tests: LST-12x10, LST-12x6, LST-8x10, LST-8x6, a 20m sprint, and the hexagon agility test (HAT). These 6 tests were completed in randomized order in one session. Participants were given a demonstration of each test and completed several submaximal and one maximal practice trial. Participants were given 60-90 seconds to recover between tests (Farlinger et al., 2007).
The fourth part compared the performance of the recreational basketball players on day 1 to the performance of the college basketball players on the four LST conditions. This comparison was used to determine whether any test differentiated basketball players of different competitive levels. For the recreational players, the average was used, whereas the one trial from the college basketball players was used.
Procedures
Day 1
Participants were asked to report to the basketball gym prior to their basketball activity class. They wore shorts, t-shirts, and shoes as they would to play basketball. Upon arrival, the participants presented a signed consent form, and filled out a survey that asked for their height, weight, race, and age. Next, the test was explained, and participants had the opportunity to practice.
There were four conditions of the test (LST-12x10, LST-12x6, LST-8x10, and LST-8x6). The testing occurred on the hardwood floor in the university’s gym. The test was marked with white athletic tape on the hardwood floor. Two distances were marked: The longer distance was 12 feet (3.66m) in length, and the shorter distance was 8 feet (2.44m) in length; each distance had lines marked every two feet (60.96cm; Figure 1). The participant’s score was the number of lines crossed during the duration of the test (6 or 10 seconds). A video camera (Flip Mino HD, Cisco Systems, Irvine, CA) was used to capture the trials, and the scores were counted and confirmed via video analysis. The time started on the participants’ first visible movement. The order of the tests was randomized.
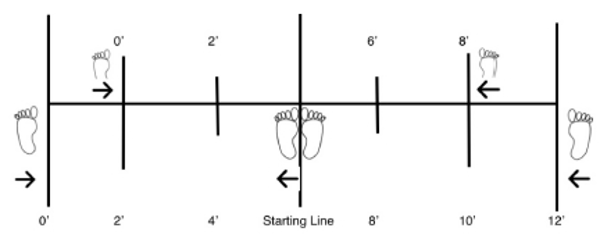
The participants started in an upright standing position straddling the center line. On the researcher’s verbal signal, participants shuffled from side to side continuously for the designated time (6 or 10 seconds). Participants were instructed not to cross their feet during the duration of the test, and a trial was discarded if a participant crossed his feet. The outside leg had to cross the outside line before changing directions. Each test started with the participants moving to their left.
Day 2
Forty-eight hours later, participants returned for the second day of their testing. The procedures for the second day were the same. The participants performed the same 12 trials in the same order as on day 1. Only 19 of the 23 participants returned to complete their second day of testing. Two participants sustained ankle injuries between the testing, and two participants were ill and skipped the second day of testing.
Day 3
Participants from the second group reported to their basketball practice gym prior to an off-season workout and wore their normal practice gear: shorts, reversible jersey, and shoes. The testing occurred approximately 2 weeks after the final game of their season. Upon arrival, the participants presented a signed consent form, and filled out a survey that asked for their height, weight, race, and age. Next, the tests were explained, and participants practiced the tests. Participants completed 6 tests: LST-12x10, LST-12x6, LST-8x10, LST-8x6, a 20m sprint, and the HAT. The six tests were completed in a randomized order. Due to the time demands, the participants performed one trial of each test. The testing occurred on the hardwood floor. The procedures for the four conditions of the LST were exactly as above.
The 20 m sprint test was chosen as a measure of speed and acceleration because the length of a basketball court precludes a full 40m sprint, which is the more common distance for sprint tests. A 20m distance was measured and marked with electric tape. Times were collected with wireless timing gates (Brower Timing Systems, Draper, UT) placed at the starting line and the finish line. The participants started from a stationary, upright position with the front foot in line with the starting gate (Pyne, Montgomery, Klusemann, & Drinkwater, 2012). When they were ready, the participants took off and sprinted through the finish line. The tester visually checked the TC-Timer on each trial to ensure that the participants did not inadvertently start the clock as they stepped to the starting line and prepared to start. The time was calculated to the nearest hundredth of a second and recorded from the TC-Timer after each trial. After the completion of the tests, the times were inputted into an Excel (Microsoft) file.
The Hexagon Agility Test (HAT) was chosen as the measure of CODS. Whereas there is no gold standard test for agility or CODS, the HAT has been used in a previous reliability study (Pauole, Madole, Garhammer, Lacourse, & Rozenek, 2000) and has been found to be a predictor of tennis performance despite the absence of twofoot jumps in tennis (Roetert, Garrett, Bran, & Camaione, 1992). A hexagon was marked with athletic tape using the protocols used by Beekhuizen, Davis, Kolber, and Cheng (2009). The length of each side of the hexagon was 24 inches (60.96cm) and each angle was 120 degrees. Participants started on their own, and the time started on their first movement. Participants jumped on two feet from the center of the hexagon over each side and back to the center in a clockwise direction. The participant completed three revolutions of the hexagon (18 jumps). A stopwatch was used to time the effort, and the time was calculated to the nearest hundredth for analysis. Participants faced forward for the duration of the test. If a participant landed on the tape, the trial was stopped and re-started.
Statistical Analysis
Data were analyzed with SPSS version 20. All data were screened and tested to ensure that the data met the statistical assumptions. A Cronbach’s α was calculated to determine the internal consistency of each of the four test conditions of the LST. The test-retest reliability was determined by the intraclass correlation coefficient (ICC) model 3,1 using the average performance from day 1 and day 2 for each of the four conditions of the LST. Paired t-tests were conducted for each of the four conditions to determine if there were significant differences for the mean scores between day 1 and day 2. A Pearson’s product-moment correlation was used to determine if there were any significant relationships between the participants’ ages, height, weight, LST-12x10, LST-12x6, LST-8x10, LST-8x6, HAT, and the 20m sprint. Finally, a one-way ANOVA was run to determine any mean differences between the group of recreational basketball players enrolled in a basketball activity class and the group of college basketball players. Significance was set at .05 for the analyses.
Results
Descriptive data from the three days is listed in Table 1. The recreational basketball players (Group 1) started with 23 participants for the first day of testing, but only 19 participants returned, which is reflected in the results on day 2. This group participated solely in the LST. The college basketball players (Group 2) participated in only one day of testing. These participants were tested for their speed (20m sprint) and CODS (HAT) in addition to the LST. The recreational basketball players did not participate in the 20m tests because of equipment constraints, whereas the college basketball players participated in only one day of testing due to time constraints.
Table 1.
Descriptive Statisttics
| N | Mean | Std. Deeviation | ||||
|---|---|---|---|---|---|---|
| Group 1 | Group 2 | Group 1 | Group 2 | Group 1 | Group 2 | |
| Age | 23 | 10 | 21.78 | 20.30 | 4.25 | 1.42 |
| Height (cm) | 23 | 10 | 180.77 | 193.55 | 8.51 | 8.70 |
| Weight (kg) | 23 | 10 | 80.40 | 89.04 | 15.16 | 9.21 |
| 20 m Sprint | 0 | 10 | 2.96 | 0.15 | ||
| HAT | 0 | 10 | 12.63 | 1.97 | ||
| 12x10 - Day 1 | 23 | 10 | 46.90 | 47.00 | 3.90 | 3.74 |
| 12x6 - Day 1 | 23 | 10 | 28.01 | 29.00 | 2.18 | 2.49 |
| 8x10 - Day 1 | 23 | 10 | 44.10 | 44.80 | 4.64 | 3.99 |
| 8x6 - Day 1 | 23 | 10 | 26.75 | 26.80 | 3.21 | 2.66 |
| 12x10 - Day 2 | 19 | 0 | 46.12 | 3.93 | ||
| 12x6 - Day 2 | 19 | 0 | 27.68 | 2.15 | ||
| 8x10 - Day 2 | 19 | 0 | 43.82 | 4.82 | ||
| 8x6 - Day 2 | 19 | 0 | 26.35 | 3.04 | ||
Part 1
A Cronbach’s α was calculated to determine the internal consistency of each of the four test conditions on the first day of testing. All four conditions of the LST had very good internal consistency: LST-12x10, α = 0.927; LST-12x6, α = 0.889; LST-8x10, α = 0.928; and LST-8x6, α = 0.960.
Part 2
The ICC, mean differences, minimal detectable change, and t-scores are presented in Table 2. All four conditions were found to have very good test-retest reliability as the ICC (3,1) for each was above 0.930. There was no statistically significant mean score between day 1 and day 2. The minimal detectable change (MDC) varied between 1.24 and 2.02 lines crossed during the test.
Table 2.
Test-retest rereliability for 4 condionditions of the LST
| ICC | Mean difference (95% CI) | MDC | MDC% | t-score | sig. | |
|---|---|---|---|---|---|---|
| LST-12x10 | 0.963 | 0.684 (-0.048, 1.415) | 1.64 | 3.5% | 1.964 | 0.065 |
| LST-12x6 | 0.957 | 0.122 (-0.300, 0.544) | 1.24 | 4.4% | 0.608 | 0.551 |
| LST-8x10 | 0.938 | 0.298 (-0.820, 1.416) | 2.02 | 4.6% | 0.56 | 0.582 |
| LST-8x6 | 0.946 | 0.246 (-0.461, 0.952) | 1.61 | 6.0% | 0.731 | 0.474 |
Part 3
Because all four conditions showed good inter-trial and test-retest reliability, the four conditions were tested in part 3. A Pearson’s product-moment correlation was used to determine the relationships between the participant characteristics and the six tests. The correlation matrix is shown in Table 3. The only significant relationships between a participant characteristic and a test were between height and the 8x10-LST, r =-0.744, p = 0.014 and between height and the 8x6-LST, r =-0.703, p = 0.023.
Table 3.
Correlation mon matrix for colollege basketballl players
There was no significant relationship between the 20m sprint test and the HAT or LST tests. There was a statistically significant negative relationship between the HAT and the 8x10-LST, r =-0.640, p = 0.046 and between the HAT and the 8x6-LST, r =-0.648, p = 0.043. There was not a statistically significant relationship between the HAT and the 12x10-LST or the 12x6-LST.
Part 4
A one-way ANOVA was run to determine the validity of the LST in terms of differentiating basketball players of different competitive levels. In the initial analysis, there was a statistically significant difference in the height of the two groups. Therefore, players from the basketball class were matched by height with the college basketball players to create two matched groups for the analysis. The new means, standard deviations, and F-test are shown in Table 4. With the matched groups, there was no statistically significant difference between the college-aged, recreational basketball players and the college basketball players for any condition.
Table 4.
Descriptives and ANOVA for recreaational (n = 10) and cnd college (n = 10) basketbaball players
| Mean | Std. Deviation | F | Sig. | ||
|---|---|---|---|---|---|
| Age | Recreational | 21.70 | 2.45 | 2.443 | 0.135 |
| College | 20.30 | 1.42 | |||
| Height (cm) | Recreational | 187.96 | 6.77 | 2.568 | 0.126 |
| College | 193.55 | 8.70 | |||
| Weight (kg) | Recreational | 88.81 | 15.64 | 0.002 | 0.969 |
| College | 89.04 | 9.21 | |||
| LST-12x10 | Recreational | 45.800 | 3.440 | 0.557 | 0.465 |
| College | 47.000 | 3.742 | |||
| LST-12x6 | Recreational | 27.433 | 1.811 | 2.585 | 0.125 |
| College | 29.000 | 2.494 | |||
| LST-8x10 | Recreational | 41.970 | 4.166 | 2.411 | 0.138 |
| College | 44.800 | 3.994 | |||
| LST-8x6 | Recreational | 25.767 | 3.584 | 0.536 | 0.474 |
| College | 26.800 | 2.658 |
Discussion
The Edgren Side-Step Test has been used widely in the field and within the literature without any consistent procedures or published reliability and validity data (Brown, 2012; Pauole et al., 2000). This study attempted to establish consistent, reliable, and valid procedures for a Lateral Shuffle Test (LST) for practical and theoretical use. Because few tests have incorporated any lateral movement (Brughelli et al., 2008), the LST differs from other tests of CODS, and therefore is an important test within the literature. Furthermore, other tests purported to measure CODS, such as the t-test, have been found to correlate more with speed than with another test of CODS (Pauole et al., 2000), increasing the necessity for a test of CODS.
This study was based on the procedures outlined by Edgren (1932) and the NSCA (Harman et al., 2000). Four conditions of the LST combining two distances and two lengths of time were proposed and tested. The four conditions were found to have very good internal consistency across three trials during the same testing period, and very good test-retest reliability with a 48-hour break between testing periods. The very good internal consistency and test-retest reliability suggested that the four conditions of the LST were reliable for use in research or the field.
In addition to reliability, it is important to understand the amount of change required to be certain that the change in one’s score is not due to measurement error. The MDC is the smallest amount of change between testing sessions that reflects a true change in performance and not measurement error (Beekhuizen et al., 2009). The MDC is important to consider when measuring an athlete’s improvement over time (Beekhuizen et al., 2009). As expected, the MDC was smallest for the 6-second tests; however, when taken as a percentage of the mean, LST-12x10 had the smallest MDC and LST-8x6 had the largest. These results suggested that the LST-12x10 would be the best test for differentiating scores on separate occasions, whether within one athlete or between athletes.
The 20m sprint test and HAT were used to establish the construct validity of the LST. The 20 m sprint was used to differentiate the LST from a test of speed to establish discriminant validity, and the HAT was used to test the similarity between the LST and another test of CODS to establish convergent validity. Whereas there is no gold standard test of agility or CODS, the HAT has been used in a previous study to determine the convergent validity of another test of CODS (Pauole et al., 2000). The four conditions were found to have a low and non-significant relationship with the 20 m sprint test using male college basketball players establishing discriminant validity between the LST and a test of acceleration and straight-ahead speed. Two of the four conditions (8x10 and 8x6) were found to have a strong relationship with the HAT establishing convergent validity. The other two conditions (12x10 and 12x6) had no statistically significant relationship with the HAT. Therefore, the LST-8x10 and LST-8x6 were found to have construct validity as a measure of CODS.
The LST would appear to have face validity due to the similarity in movement techniques between the test and the movements used by defensive players in basketball (Krause, Meyer, & Meyer, 2007). The two groups were used to establish the predictive validity. Even after controlling for height, none of the four conditions was found to have a statistically significant difference between the two groups. The lack of group divergent validity is problematic, but does not invalidate the test as a measure of CODS. Instead, the results have shown that the LST (8x6 and 8x10) is a reliable and valid test of CODS, but not a valid test for differentiating basketball players of different competitive levels. Expecting one test to differentiate basketball players of different playing abilities may be unrealistic. It took three significant variables to explain 38% of the variance in a study of males when divided by position (Hoare, 2000). The number of participants was too small in this study to separate positions, but a subsequent study with a larger pool of players may establish group divergent validity. This study has suggested the consistent procedures and provided reliability and validity data to validate a subsequent study.
The LST was a test of CODS, and not agility, because there was no reactive element or perceptual factors tested (Young, James, & Montgomery, 2002). Whereas agility and CODS are used interchangeably, more recent definitions have attempted to differentiate CODS or planned agility from agility or reactive agility (Cooke, Quinn, & Sibte, 2011; Farrow, Young, & Bruce, 2005; Oliver & Meyers, 2009; Safaric & Bird, 2011). These more recent definitions have attempted to add specificity to a construct that has had no consensus for its definition (Holmberg, 2009; Jeffreys, 2011; Sheppard & Young, 2006). Because the LST was a pre-planned test, it tested a participant’s CODS, not his agility. The lack of group divergent validity in the LST may have been due to the lack of perceptual factors in the test. Farrow et al. (2006) found that a moderately-skilled group compared to a lesser-skilled group was faster in a reactive test condition, but not in a planned test condition. An LST that incorporated a reactive component may have differentiated the recreational players from the college players.
One limitation for these findings was the high negative correlation between height and the LST-8x10 and LST-8x6, as these were the two tests found to have construct validity. The negative correlation between height and these tests would appear to be consistent with most expectations regarding height and lateral movement. Post players generally do not move as quickly as guards on defense. The position of these players was not tested due to the low number of participants and the flexibility of positions; despite the differences in height, only two players would have been considered post players. Whereas this is a limitation to the findings, it may not be a deficiency, but instead a confirmation of common perceptions about height and lateral quickness.
Other limitations associated with this investigation are associated with the second group of participants. Because it was the off-season, the full team did not participate, lowering the number of participants. Also, those who did participate were many of the taller players, meaning that the mean height became a problem when matching the group with the first group of recreational basketball players. Due to the time that the coach allowed, participants completed only one trial of each test after several practice trials. If time permitted, and participants completed multiple trials, it is possible that their scores may have improved.
The low number of total participants was the major limitation. This study was an initial attempt to establish consistent procedures and reliability and validity data for a Lateral Shuffle Test. Further studies are required to support or refute these findings, and should include studies with females and participants from sports other than basketball. Further studies would need to address the differences between CODS and agility in lateral movements. Adding a reactive element may differentiate recreational or low-skilled players from college or moderately-skilled players.
The results of this study indicate that the LST is a reliable and valid measure of CODS, but not a predictor of basketball performance. Specifically, a distance of 8 feet (2.44 m) and a time of 6 seconds or 10 seconds are the most reliable and valid distance and times based on the sample of college-aged male basketball players. The recommendation based on this population would be to use the LST-8x10 as a test of CODS because the MDC percentage was 4.6% compared to 6.0% for the LST-8x6, meaning that a smaller change in score is required to reflect a true change in performance, and not measurement error. However, the 10- second time frame may induce more fatigue, which may not be the purpose of the testing.
Practical Applications
CODS is an important component of success in many sports. The LST-8x10 is a reliable and valid test to measure CODS, and may be better than other alternatives that include straight-ahead sprinting. Because of the constant lateral movement and the short time frame, the LST-8x10 may be an appropriate test for sports that require quick change of directions in the frontal plane such as basketball and volleyball. However, the LST in this study was not shown to be a good indicator of a basketball player’s competitive level, and the test is influenced by a player’s height.
References
Pyne, D.B., Montgomery, P.G., Klusemann, M.J., & Drinkwater, E.J. (2012). Basketball players. In R.K. Tanner & C.J. Gore (Eds.) Physiological tests for elite athletes (2nd ed., 273-287). Champaign, IL: Human Kinetics. Roetert, E.P., Garrett, G.E., Bran, S.W., & Camaione, D.N. (1992). Establishing percentiles for junior tennis players based on physical fitness testing results. Clinical Journal of Sports Medicine, 14, 1-5.