Lower-leg cooling during halftime does not affect second-half performance in a football match
Article information
Abstract
Background
Cold application (e.g., lower-leg cooling: LLC) during halftime is becoming more popular in football matches. Therefore, we examined the effects of a 5-min halftime LLC (7.5±1.0℃; bare feet immersed up to the tibial tuberosity), as a recovery strategy on subsequent performance changes in the second-half.
Methods
Twenty male elite football players (age: 19±1 years; height: 176±6 cm; mass: 69±7 kg; athletic career: 9±1 years) participated in this crossover study (LLC or passive recovery: sitting on a bench without cooling). The 5-min FSP with a fixed intensity and distance, consisted of football-related activities (two trials of sprinting, jumping, dribbling, and kicking in various intensities and distances) and was repeated nine times (total 45-min) to mimic the first- and second-half of a football match. Calorie expenditure, heart rate, athletic performance, and passing accuracy were recorded. To determine feasibility, we compared our data to the normative values in previous reports. To test the condition effects over time, we performed a 2×6 mixed model analysis of variance for calorie expenditure and heart rate. For athletic performance and passing accuracy, we performed a 2×6 mixed model analysis of covariance (covariate: baseline measurement).
Results
There were no statistical differences between the LLC condition and passive recovery on athletic performance and passing accuracy at any time point (p>0.13 for all statistical tests). Recorded calorie expenditure (1,227±142kcal) and heart rate (163±11bpm) during our FSP were within the normative values of a typical football match (calorie expenditure: 1,200 to 1,500kcal; heart rate: 150 and 175bpm).
Conclusions
Since a 5-min halftime LLC (at 7.5℃) immersed up to the tibial tuberosity are not effective in delaying fatigue and passing accuracy, it is not recommended for a recovery strategy. Since simulated football matches using the FSP were similar to a typical football match in terms of calorie expenditure and heart rate, it could be used for future research or training purposes.
Introduction
Lower-leg cooling (LLC) during halftime in a football match is becoming popular as one of recovery methods (Yeung et al., 2016). A reduction in temperature (Wilson et al., 2018), blood lactate level (Bastos et al., 2012), and inflammatory response (Ascensão et al., 2011) are thought to enhance recovery from physical fatigue. Additionally, cold water immersion produces a psychological effect as it decreases the level of perceived fatigue and muscle soreness (Broatch et al., 2014; Rowsell et al., 2009). Although current literature (Wilson et al., 2018; Bastos et al., 2012; Ascensão et al., 2011; Broatch et al., 2014; Rowsell et al., 2009) shows physiological and psychological effects in recovery from exercise-induced fatigue, it does not support the use of LLC during halftime. Since LLC was applied after a football match in previous studies (Ascensão et al., 2011; Rowsell et al., 2009; Rowsell et al., 2011) data of performance change in the second-half as a result of halftime LLC are not yet available.
Collection of such data involves complications. First, it is difficult to administer LLC in the middle of a football match. Second, various modes, intensity, and volumes of football-related activities (e.g., running, kicking, cutting) confound objective comparisons. A simulated protocol specific to football would help us resolve these difficulties. A 90-min football simulation programme (FSP) (Lovell et al., 2013) including a 5-min halftime intervention during a 15-min halftime was previously conducted. However, this study (Lovell et al., 2013) tested different recovery strategies (exercise and whole body vibration). In addition, the simulated programme (Lovell et al., 2013) is lacking because it did not perform actions with a football (kicking and dribbling), but contained multi-directional running at various intensities.
Although the majority of the distance is covered by walking and low intensity running (Di Mascio & Bradley, 2013), many explosive activities such as kicking, passing, jumping, sprinting, turning, cutting, and tackling are frequent in football (Bangsbo, 2014; Stølen et al., 2005). Therefore, a 90-min long football match including a 15-min halftime period with football-related activities performed at a fixed intensity and distance, should be developed. A simulated match using the FSP should also yield similar calorie expenditure (1,360kcal) and distance covered (10-13km) (Mohr et al., 2003) as in a typical adult football match. Application of halftime LLC during the simulated football match would provide more practical recovery guidelines to football players, coaches, and sports medicine practitioners.
Hence, the purpose of this study was to observe performance changes in the second-half responding to a 5-min halftime LLC as compared with passive recovery (sitting on the bench without cooling). A 5-min football simulation programme (FSP) with a fixed intensity and distance was repeated 18 times to replicate a full 90-min football match. We hypothesised that performance changes from each conditions of halftime recovery strategies would be similar because the parameters of LLC (e.g., duration of cooling and the immersed body part) in this study were insufficient to influence thermal and physiological responses.
Methods
Study design
A 2×6 (condition by time) crossover field study with repeated measures on time was used. Participants experienced both conditions (LLC and control) in a random order. Dependent variables were calorie expenditure (kcal), heart rate (bpm), maximal vertical jump height (cm), 20-m sprint time (sec), arrowhead agility test time (sec), and scores of short-pass and long-kick. A 5-min long FSP with fixed intensity and distance was repeated 18 times to replicate a full 90-min (the first- and second-halves) of a simulated football match. Data recorded during the three consecutive FSP were combined (a total of 15-min) and analysed; thus, six time points (the first-half: T1 through T3; the second-half: T4 through T6) were compared.
Participants
Twenty male elite football players (age: 19±1 years; height: 176±6cm; mass: 69±7kg; athletic career: 9±1 years) volunteered and qualified for study participation. All participants had to be football trained for at least six years and registered in the Korean Football Association. Participants were excluded if they had any musculoskeletal lower-extremity injury in the past six months, history of lumbar spine or lower-extremity surgery, neuromuscular disorders, or allergy to cold. There was no dropping out throughout experiments, thus the initial 20 participants were finally analysed. We obtained approval from the __________ University’s Institutional Review Board before collecting data. Each participant read the study procedures and gave informed consent.
Procedures
Data were collected on a regular outdoor natural-grass football pitch. Participants visited three different days with 48-h between visits. On the first (orientation) day, baseline values of dependent measurements (maximal vertical jump height, 20-m sprint time, arrowhead agility test time, and the accuracy scores of short-pass and long-kick) were recorded. On the second day, participants performed nine repetitions of the 5-min FSP to represent the first- and second-halves. During halftime, participants randomly received one of the conditions (LLC or passive recovery). Afterwards, the second-half was performed in the same manner as the first-half. On the third day, the same experimental procedure was repeated after receiving another condition (that participants did not receive on the second day) during halftime. Calorie expenditure and heart rate were additionally recorded on the second and third days. A brief warm-up (light 10-min jog and dynamic stretching) was performed each day. Participants wore the same socks and shoes (football stud) each testing day.
Each testing day, air temperature and relative humidity were recorded by a digital thermometer (Kestrel Drop, Nielsen-Kellerman Co., Boothwyn, PA, USA). Data were not collected on rainy days. All participants consumed 1.5L of water during each day (500mL during each of the first- and second-halves; and halftime).
Football simulated programme (FSP)
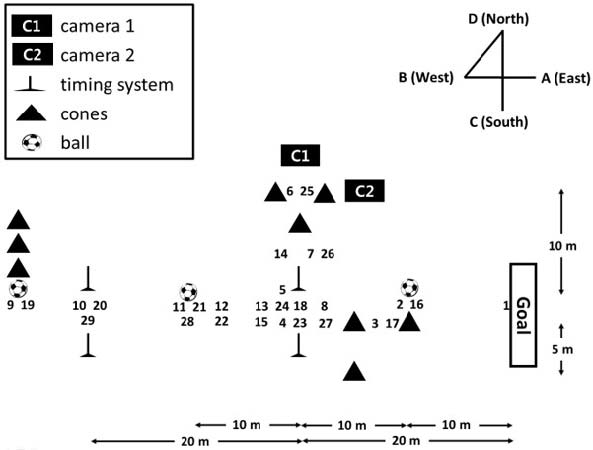
This 5-min long FSP was repeated nine times to represent the first- and second-halves. The FSP consists of football specific activities and movements such as walking, jogging, sprinting, cutting, side stepping, jumping, and kicking balls (Table 1, Figure 1, and supplemental video clip). If this FSP was completed sooner than 5-min, participants walked around for the rest of the time (less than 1-min). This FSP was established in consideration of calorie expenditure (Stølen et al., 2005), heart rate (Bangsbo, 1993), and total distance covered (Bradley et al., 2010).

The football simulated programme (FSP)
Football simulated protocol (5-min)
Conditions
Both conditions (LLC and control) were implemented during the middle of a 5-min halftime. After the first-half, participants walked to the shaded bench (150-m from the pitch), and took their shoes and socks off (this took approximately 5-min). While remaining in a seated position, participants immersed their bare feet and lower legs (up to the tibial tuberosity) in a plastic cold tub (water temperature: 7.5±1.0℃; container size: 45.5×57.7 cm) (Gregson et al., 2011; Leeder et al., 2011). The water temperature in the plastic tub was confirmed by a K-type temperature probe connected to a digital thermometer (Fluke 53 II B thermometer, Fluke Corp., Everett, WA, USA). Upon completion of LLC, participants put their socks and shoes on, and then walked back to the pitch for the second-half (this took approximately 5-min).
For the control condition, participants went through the same halftime procedure as described above, except sat quietly for 5-min on the bench while keeping their shoes and socks on.
Measurements
Calorie expenditure and heart rate
To monitor calorie expenditure and heart rate variability, participants wore a watch (Polar M400 GPS, Polar Electro Oy, Kempele, Finland: sampling rate: 60Hz) on their wrist and an associated strap around their chest. This method has been validated (Kendall et al., 2019). High measurement reliability has been reported as the intraclass correlation coefficient (ICC) of 0.80 to 0.86 (Nunan et al., 2009). Since the cumulated values of calorie expenditure were displayed, the value at the completion of each time point was recorded. To obtain the heart rate, the values within each time point (900 data points) were averaged.
Athletic performance
For maximal vertical jump height, participants placed their feet in a triangle cone (Figure 1) and vertically jumped off of both legs as high as they could. Take-off movement included pre-stretch using lower-extremity joints and arm swinging (countermovement jump). The distance between feet and the joint angles during pre-stretch and take-off were self-determined. This activity was performed twice per a FSP; thus, a total of six maximal vertical jumps were recorded and averaged to represent each time point. Two cameras were set upwith240fpsanda1/1000shutterspeed.Onecamera (C1 in Figure 1) was located on the grass (1-m from the centre of the jumping area and 1-m above the grass) and videotaped participants’ feet to determine the flight time, while another camera (C2: 1-m from the centre of the jumping area and 20-cm above the grass) videotaped the whole body to confirm participants. A pair of video clips for each jump was exported into motion analysis software (Kinovea 0.8.15, Kinovea Org., France) and synchronized (Balsalobre-Fernández et al., 2014). Flight time according to frame count from take-off to landing was calculated. Participants’ last foot to take off and the first foot to touch the ground were considered as take-off and landing, respectively. To obtain the maximal vertical jump height (cm), the flight time (s) was inserted into the formula (h=t2×122.625) (Glatthorn et al., 2011). This method has been validated (Balsalobre-Fernández et al., 2014) and shown high measurement consistency (ICC=0.99: Glatthorn et al., 2011).
To record a 20-m sprint time, participants were asked to ready (50-cm from the start line) and then sprint straight as fast as they could from a standing start position. Two pairs of infrared timing sensors (Brower Timing System, Salt Lake City, UT, USA) were set up at the start and finish lines (located 20-m apart). A total of six 20-m sprint times were averaged to represent each time point (three consecutive FSP). This method has been validated (Pauole et al., 2000) and shown high measurement consistency (ICC=0.84: Kim et al., 2016).
For the arrowhead agility test, participants were asked to run around five cones (clockwise direction: Figure 1) as fast as they could from a standing start position. The start line of the 20-m sprint test was used as the start and finish line in this test. Therefore, a pair of timing sensors, located at the start line of the 20-m sprint test, (Brower Timing System, Salt Lake City, UT, USA) recorded the arrowhead agility test time. A total of six arrowhead agility tests were averaged to represent each time point. This method has been validated (Di Mascio et al., 2015) and shown high measurement consistency (ICC=0.92: Lockie &Jalilvand, 2017).
Passing accuracy
To objectively assess ball kicking accuracy, the scores of short-pass (10-m) and long-kick (30-m) were recorded. For the short-pass, participants were asked to kick a football using the inner side of their foot and hit a step box (99× 35×15cm) located at the goal line (Figure 1). Six short-pass scores were averaged for each time point. Participants were instructed to kick another ball immediately after one kick had finished. If they hit the target twice, two points were awarded; if they hit the target one time, one point was awarded; otherwise zero points were allocated. A long-kick was performed once in a 5-min FSP, and three long-kick scores were averaged for each time point. Participants were asked to long-kick accurately to the goal (7.32×2.44m) one time from 30-m straight away. If the ball was scored with no bounce or hitting the goal post or cross bar, one point was awarded; if not, zero points were allocated. Participants were required to pass or kick as they do a traditional football match with either foot.
Statistical analyses
We performed a priori power analysis based on our pilot data in our laboratory to determine the sample size. Based on a mean difference in the 20-m sprint time of 0.15-s and a standard deviation (SD) of 0.19-s (effect size of 0.83), with an alpha of 0.05 and a beta of 0.2, it was estimated that 14 participants per group would be necessary.
To test the condition effects over time, we performed a 2×6 mixed model analysis of variance for calorie expenditure and heart rate. For athletic performance and passing accuracy, we performed a 2×6 mixed model analysis of covariance (covariate: baseline measurement). The significance level was chosen as 0.05, and the statistical package R3.4.3 (R development core team) was used for all tests.
Results
Calorie expenditure and heart rate
We did not observe condition effects throughout any time point on either value (calorie expenditure: F5,209=0.24, p=0.94; heart rate: F5,209=0.24, p=0.94; Table 2). Total calorie expenditure was 1,227±142 kcal, and the average heart rate for the whole match was 163±11bpm.

Calorie expenditure and heart rate
Athletic performance
The values of the three function performance tests did not change throughout the match (maximal vertical jump height: F5,209=0.44, p=0.82; 20-m sprint time: F5,209=0.57, p=0.73; arrowhead agility test: F5,209=0.26, p=0.93; Table 3).

Athletic performance
Passing accuracy
LLC did not influence participants’ passing accuracy throughout the match (short-pass: F5,209=1.75, p= 0.13; long-kick: F5,209=1.19, p=0.32; Table 4).

Passing accuracy of short-pass and long-kick
Air temperature and relative humidity
The average values of air temperature and relative humidity during the data collection period were 33.3±3.6℃ and 47.0±10.5%, respectively. Air temperature and relative humidity were not different throughout the data collection period (temperature: F5,209=0.30, p=0.91; humidity: F5,209=0.09, p=0.99).
Discussion
We demonstrated that simulated football matches using our FSP were similar to a typical adult football match in terms of calorie expenditure, heart rate, and distance covered. Our data in calorie expenditure (1,222kcal) and heart rate (163bpm) were within the normative ranges of a typical football match—calorie expenditure: 1,200 to 1,500 kcal (Stølen et al., 2005; Krustrup et al., 2005) and heart rate: 150 and 175bpm (Bangsbo, 1993; Ohashi et al., 1993). Distance covered by running without a ball possession in a typical football match was 542±214m (maximal) and 1,590±488m (submaximal) (Bradley et al., 2010). The distances of corresponding values in our matches were 720m (sprinting) and 1,514.5m (submaximal), respectively. Despite a lack of first-touches, headers, tackles, throws, and slight contact with opponents, our FSP consists of the most common football-specific activities at a fixed intensity and distance. Therefore, the FSP administered in this study could be used for research or training purposes. Calorie expenditure, heart rate, and maximal vertical jump height recorded during the first 15-min of the second-half (T4) were the lowest values throughout the entire matches. As previous studies (Mohr et al., 2003; Edholm et al., 2015; Weston et al., 2011) reported, a reduced body temperature and heart rate during halftime could have hindered subsequent athletic performance in the second-half.
Numerous studies reported the immediate effects of cooling in post-exercise recovery in terms of strength (Wilson et al., 2018), agility (Çakır & Şenel, 2017), anaerobic power (Hayter et al., 2016), and muscle soreness (Yeung et al., 2016). However, ideal treatment parameters to elicit specific neurophysiological responses do not seem to exist (Bleakley et al., 2012). Because of time and space constraints during halftime, our LLC protocol—a 5-min duration with a temperature of 7.5℃ leg immersion up to the tibial tuberosity—was the most suitable application, which may explain why it did not produce recovery effects. Previous studies using similar treatment parameters (5 to 8℃ of cold-water immersion for 4 to 5-min) as post-exercise recovery strategy to ours reported no physiological (e.g., blood lactate level and creatine kinase activity) (Junior et al., 2011) or biomechanical change (grip strength) (Kodejška et al., 2018). Studies reporting muscle and core temperature reduction with a duration of 5-min cooling had participants immersed up to the sternal level (Costello et al., 2012; Peiffer et al., 2009). Immersion to at least the iliac crest level with a minimum duration of 10-min appears to be required for physiological alterations in plasma C-reactive protein concentration (Wilson et al., 2018), muscle oxygenation (Yeung et al., 2016), and myoglobin (Ascensão et al., 2011). These reports suggest that our halftime LLC was less likely to accomplish any of the aforementioned cooling effects.
Existing literature on the effective water temperature for recovery after an intense physical activity varies from 5 to 35℃. Cooling rates of core body temperature were similar between immersed water temperature of 5 and 14℃ (Clements et al., 2002) and among 8, 14, and 20℃ (Proulx et al., 2003). Water immersion at 11 and 26℃ resulted in a similar pattern in lower-extremity kinetic and kinematic changes during walking (Fukuchi et al., 2015). In comparison to 10℃ water temperature, immersion in 35℃ produced greater thermal comfort and mental readiness for exercise, along with no difference in muscle strength (Broatch, et al., 2014). Therefore, the effectiveness of water immersion modality in post-exercise recovery may not be temperature dependent (Broatch, et al., 2014; Rowsell et al., 2009; Al Haddad et al., 2010). A recent study (Vieira et al., 2016) demonstrated that cold-water immersion at 15℃ produced a faster return in serum creatine kinase and countermovement jump levels compared with 5℃. Although there is scientific and anecdotal evidence in favour of cold application, perhaps warm water immersion (between 15 and 20℃) may be worth performing during halftime since our body loses heat with a temperature lower than the core body. Warmer temperature immersion would also eliminate an immediate adverse effect of cooling such as a subjective feeling of “stiffness”.
Cooled body parts may be the determinative factors for delaying fatigue or performance enhance. Previously, a 20-min bilateral knee joint cooling (two ice bags placed on the anterior and posterior surfaces of the knee joint) followed by an intermittent warm-up exercise reduced 0.09 second in 20-m sprint time (Kim et al., 2016). A 2.5-min bilateral palm cooling between sets of 85% 1RM bench press resulted in a 20% increase in total exercise volume (Kwon et al., 2010). On the contrary, studies cooled muscle tissues consistently reported a reduction in performance enhance (Macedo et al., 2016; Dixon et al., 2010; Patterson et al., 2008). Reduced temperature appears to alter normal neuromuscular, mechanical, metabolic, and enzymatic process (Richendollar et al., 2006). Since the cooled area in our study included the triceps surae, our LLC may have been detrimental. However, the measurement curves at the two conditions showed very similar patterns, indicating that our LLC neither enhanced nor reduced athletic performance. Thus, a type of active recovery exercise that maintains body temperature and heart rate at a certain degree, rather than reducing local body temperature, might be a better halftime recovery strategy during a football match (Edholm et al., 2015; Mohr et al., 2004).
Conclusions
Subsequent performance changes between the halftime LLC (7.5℃ barefoot immersed up to the tibial tuberosity) and passive recovery were very similar, suggesting that halftime LLC neither improves nor hinders calorie expenditure, heart rate, athletic performance, and passing accuracy. Since our simulated football matches (nine repetitions of a novel 5-min FSP) requires similar amount of calorie expenditure, heart rate, and distance covered, our FSP could be administrated for future research or training purpose.
Acknowledgements
This work was supported by the Ministry of Education of the Republic of Korea and the National Research Foundation of Korea (NRF-2015S1A5A8017643). We also thank Jaewoong Lee and Jongsoo Yoo for their data collection and reduction.
Conflict of Interest
There are no competing interests for any author.
References
Al Haddad H., Laursen P. B., Chollet D., Frédéric L., Said A., & Martin B. (2010). Effect of cold or thermoneutral water immersion on post-exercise heart rate recovery and heart rate variability indices. Autonomic Neuroscience, 156,111-116.
Al Haddad H., Laursen P. B., Chollet D., Frédéric L., Said A., et al, Martin B.. 2010;Effect of cold or thermoneutral water immersion on post-exercise heart rate recovery and heart rate variability indices. Autonomic Neuroscience 156:111–116. 10.1016/j.autneu.2010.03.017.Ascensão A., Leite, M., Rebelo, A. N., Magalhäes, S., & Magalhäes, J. (2011) Effects of cold water immersion on the recovery of physical performance and muscle damage following a one-off soccer match. Journal of Sports Sciences, 29, 217-225.
Ascensão A., Leite M., Rebelo A. N., Magalhäes S., et al, Magalhäes J.. 2011;Effects of cold water immersion on the recovery of physical performance and muscle damage following a one-off soccer match. Journal of Sports Sciences 29:217–225. 10.1080/02640414.2010.526132.Balsalobre-Fernández, C., Tejero-González, C. M, del Campo-Vecino, J., & Bavaresco, N. (2014). The concurrent validity and reliability of a low-cost, high-speed camera-based method for measuring the flight time of vertical jumps. The Journal of Strength and Conditioning Research, 28, 528-533.
Balsalobre-Fernández C., Tejero-González C. M, del Campo-Vecino J., et al, Bavaresco N.. 2014;The concurrent validity and reliability of a low-cost, high-speed camera-based method for measuring the flight time of vertical jumps. The Journal of Strength and Conditioning Research 28:528–533. 10.1519/jsc.0b013e318299a52e.Bangsbo, J. (2014). Physiological demands of football. Sports Science Exchange, 27,1-6.
Bangsbo J.. 2014;Physiological demands of football. Sports Science Exchange 27:1–6.Bangsbo, J. (1993). The physiology of soccer ― with special reference to intense intermittent exercise. Acta Physiologica Scandinavica. Supplementum, 619, 1-155.
Bangsbo J.. 1993;The physiology of soccer ― with special reference to intense intermittent exercise. Acta Physiologica Scandinavica. Supplementum 619:1–155.Bastos, F. N., Vanderlei, L. C. M., Nakamura, F. Y., Bertollo, M., Godoy, M. F., Hoshi, R. A., Junior, J. N., & Pastre, C. M. (2012). Effects of cold water immersion and active recovery on post-exercise heart rate variability. International Journal of Sports Medicine, 3, 873.
Bastos F. N., Vanderlei L. C. M., Nakamura F. Y., Bertollo M., Godoy M. F., Hoshi R. A., Junior J. N., et al, Pastre C. M.. 2012;Effects of cold water immersion and active recovery on post-exercise heart rate variability. International Journal of Sports Medicine 3:873.Bleakley, C., McDonough, S., Gardner, E., Baxter, D. G., Hopkins, T. J., Davison, G. W., & Costa, M. T. (2012). Cold-water immersion (cryotherapy) for preventing and treating muscle soreness after exercise. Sao Paulo Medical Journal, 130, 348-348.
Bleakley C., McDonough S., Gardner E., Baxter D. G., Hopkins T. J., Davison G. W., et al, Costa M. T.. 2012;Cold-water immersion (cryotherapy) for preventing and treating muscle soreness after exercise. Sao Paulo Medical Journal 130:348–348. 10.1590/s1516-31802012000500015.Bradley, P. S., Di Mascio, M., Peart, D., Olsen, P., & Sheldon, B. (2010). High-intensity activity profiles of elite soccer players at different performance levels. The Journal of Strength and Conditioning Research, 24, 2343-2351.
Bradley P. S., Di Mascio M., Peart D., Olsen P., et al, Sheldon B.. 2010;High-intensity activity profiles of elite soccer players at different performance levels. The Journal of Strength and Conditioning Research 24:2343–2351. 10.1519/jsc.0b013e3181aeb1b3.Broatch, J. R., Petersen, A., & Bishop, D. J. (2014). Post exercise cold-water immersion benefits are not greater than the placebo effect. Medicine Science Sports Exercise, 46, 2139-2147.
Broatch J. R., Petersen A., et al, Bishop D. J.. 2014;Post exercise cold-water immersion benefits are not greater than the placebo effect. Medicine Science Sports Exercise 46:2139–2147. 10.1249/mss.0000000000000348.Çakır, E., & Şenel, Ö. (2017). Effect of cold water immersion on performance. European Journal of Physical Education and Sport Science. 3.
Çakır E., et al, Şenel Ö.. 2017;Effect of cold water immersion on performance. European Journal of Physical Education and Sport Science 3Clements, J. M., Casa, D. J., Knight, J. C., McClung, J. M., Blake, A. S., Meenen, P. M., Gilmer A. M., & Caldwell, K. A. (2002). Ice-water immersion and cold-water immersion provide similar cooling rates in runners with exercise-induced hyperthermia. Journal of Athletic Training, 37, 146.
Clements J. M., Casa D. J., Knight J. C., McClung J. M., Blake A. S., Meenen P. M., Gilmer A. M., et al, Caldwell K. A.. 2002;Ice-water immersion and cold-water immersion provide similar cooling rates in runners with exercise-induced hyperthermia. Journal of Athletic Training 37:146.Costello, J. T., Culligan, K., Selfe, J., & Donnelly, A. E. (2012). Muscle, skin and core temperature after−110 C cold air and 8 C water treatment. PloS One, 7, e48190.
Costello J. T., Culligan K., Selfe J., et al, Donnelly A. E.. 2012;Muscle, skin and core temperature after−110 C cold air and 8 C water treatment. PloS One 7:e48190. 10.1371/journal.pone.0048190.Di Mascio, M., & Bradley, P. S. (2013). Evaluation of the most intense high-intensity running period in English FA premier league soccer matches. The Journal of Strength and Conditioning Research, 27, 909-915.
Di Mascio M., et al, Bradley P. S.. 2013;Evaluation of the most intense high-intensity running period in English FA premier league soccer matches. The Journal of Strength and Conditioning Research 27:909–915. 10.1519/jsc.0b013e31825ff099.Dixon, P. G., Kraemer, W. J., Volek, J. S., Howard, R. L., Gomez, A. L., & Comstock, B. A. (2010). The impact of cold-water immersion on power production in the vertical jump and the benefits of a dynamic exercise warm-up. The Journal of Strength and Conditioning Research, 24, 3313-3317.
Dixon P. G., Kraemer W. J., Volek J. S., Howard R. L., Gomez A. L., et al, Comstock B. A.. 2010;The impact of cold-water immersion on power production in the vertical jump and the benefits of a dynamic exercise warm-up. The Journal of Strength and Conditioning Research 24:3313–3317. 10.1519/jsc.0b013e3181f212e2.Edholm, P., Krustrup, P., & Randers M. (2015). Half‐time re‐warm up increases performance capacity in male elite soccer players. Scandinavian Journal of Medicine and Science in Sports, 25, e40-e49.
Edholm P., Krustrup P., et al, Randers M.. 2015;Half‐time re‐warm up increases performance capacity in male elite soccer players. Scandinavian Journal of Medicine and Science in Sports 25:e40–e49. 10.1111/sms.12236.Fukuchi, C. A., Da Rocha, E.S., & Stefanyshyn, D. J. (2015). Effects of cold water immersion on lower extremity joint biomechanics during running. Journal of Sports Sciences, 33, 449-456.
Fukuchi C. A., Da Rocha E.S., et al, Stefanyshyn D. J.. 2015;Effects of cold water immersion on lower extremity joint biomechanics during running. Journal of Sports Sciences 33:449–456. 10.1080/02640414.2014.946952.Glatthorn, J. F., Gouge, S., Nussbaumer, S., Stauffacher, S., Impellizzeri, F. M., & Maffiuletti, N. A. (2011). Validity and reliability of Optojump photoelectric cells for estimating vertical jump height. The Journal of Strength and Conditioning Research, 25, 556-560.
Glatthorn J. F., Gouge S., Nussbaumer S., Stauffacher S., Impellizzeri F. M., et al, Maffiuletti N. A.. 2011;Validity and reliability of Optojump photoelectric cells for estimating vertical jump height. The Journal of Strength and Conditioning Research 25:556–560. 10.1519/jsc.0b013e3181ccb18d.Gregson, W., Black, M. A., Jones, H., Milson, J., Morton, J., Dawson, B., Atkinson, G., & Green, D. J. (2011). Influence of cold water immersion on limb and cutaneous blood flow at rest. American Journal of Sports Medicine, 39, 1316-1323.
Gregson W., Black M. A., Jones H., Milson J., Morton J., Dawson B., Atkinson G., et al, Green D. J.. 2011;Influence of cold water immersion on limb and cutaneous blood flow at rest. American Journal of Sports Medicine 39:1316–1323. 10.1177/0363546510395497.Hayter, K. J., Doma, K., Schumann, M., & Deakin, G. B. (2016). The comparison of cold-water immersion and cold air therapy on maximal cycling performance and recovery markers following strength exercises. PeerJ, 4, e1841.
. Hayter K. J., Doma K., Schumann M., et al, Deakin G. B.. 2016;The comparison of cold-water immersion and cold air therapy on maximal cycling performance and recovery markers following strength exercises. PeerJ 4:e1841. 10.7717/peerj.1841.Junior, E. C. L., de Godoi, V., Mancalossi, J. L., Rossi, R. P., De Marchi, T., Parente, M., Grosselli, D., Generosi, R. A., Basso, M., Frigo, L., Tomazoni, S. S., Bjordal, J. M., & Lopez-Martins A. B. (2011). Comparison between cold water immersion therapy (CWIT) and light emitting diode therapy (LEDT) in short-term skeletal muscle recovery after high-intensity exercise in athletes—preliminary results. Lasers in Medical Science, 26, 493-501.
Junior E. C. L., de Godoi V., Mancalossi J. L., Rossi R. P., De Marchi T., Parente M., Grosselli D., Generosi R. A., Basso M., Frigo L., Tomazoni S. S., Bjordal J. M., et al, Lopez-Martins A. B.. 2011;Comparison between cold water immersion therapy (CWIT) and light emitting diode therapy (LEDT) in short-term skeletal muscle recovery after high-intensity exercise in athletes—preliminary results. Lasers in Medical Science 26:493–501.Kendall, B., Bellovary, B., & Gothe, N. P. (2019). Validity of wearable activity monitors for tracking steps and estimating energy expenditure during a graded maximal treadmill test. Journal of Sports Sciences, 37, 42-49.
Kendall B., Bellovary B., et al, Gothe N. P.. 2019;Validity of wearable activity monitors for tracking steps and estimating energy expenditure during a graded maximal treadmill test. Journal of Sports Sciences 37:42–49. 10.1080/02640414.2018.1481723.Kim, H., Lee, D., Choi, H.-M., & Park, J. (2016). Joint cooling does not hinder athletic performance during high-intensity intermittent exercise. International Journal of Sports Medicine, 37, 641-646.
Kim H., Lee D., Choi H.-M., et al, Park J.. 2016;Joint cooling does not hinder athletic performance during high-intensity intermittent exercise. International Journal of Sports Medicine 37:641–646. 10.1055/s-0035-1559687.Kwon, Y. S., Robergs, R. A., Kravitz, L. R., Gurney, B. A., Mermier, C. M., & Schneider, S. M. (2010). Palm cooling delays fatigue during high-intensity bench press exercise. Medicine & Science in Sports & Exercise, 42, 1557-1565.
Kwon Y. S., Robergs R. A., Kravitz L. R., Gurney B. A., Mermier C. M., et al, Schneider S. M.. 2010;Palm cooling delays fatigue during high-intensity bench press exercise. Medicine & Science in Sports & Exercise 42:1557–1565. 10.1249/mss.0b013e3181d34a53.Kodejška, J., Baláš, J., & Draper, N. (2018). Effect of cold water immersion on handgrip performance in rock climbers. International Journal of Sports Physiology and Performance, 21, 1-13.
Kodejška J., Baláš J., et al, Draper N.. 2018;Effect of cold water immersion on handgrip performance in rock climbers. International Journal of Sports Physiology and Performance 21:1–13.Krustrup, P., Mohr, M., Ellingsgaard, H., & Bangsbo, J. (2005). Physical demands during an elite female soccer game: Importance of training status. Medicine & Science in Sports & Exercise, 37, 1242-1248.
Krustrup P., Mohr M., Ellingsgaard H., et al, Bangsbo J.. 2005;Physical demands during an elite female soccer game: Importance of training status. Medicine & Science in Sports & Exercise 37:1242–1248. 10.1249/01.mss.0000170062.73981.94.Leeder, J., Gissane, C., Van Someren, K., Gregson, W., & Howatson, G. (2011). Cold water immersion and recovery from strenuous exercise: A meta-analysis. British Journal of Sports Medicine, 46, 233-240.
Leeder J., Gissane C., Van Someren K., Gregson W., et al, Howatson G.. 2011;Cold water immersion and recovery from strenuous exercise: A meta-analysis. British Journal of Sports Medicine 46:233–240.Lockie, R. G., & Jalilvand, F. (2017). Reliability and criterion validity of the Arrowhead change-of-direction speed test for soccer. Facta Universitatis, Series: Physical Education and Sport, 15, 139-151.
Lockie R. G., et al, Jalilvand F.. 2017;Reliability and criterion validity of the Arrowhead change-of-direction speed test for soccer. Facta Universitatis, Series: Physical Education and Sport 15:139–151.Lovell, R., Midgley, A., Barrett, S., Carter, D., & Small, K. (2013). Effects of different half‐time strategies on second half soccer‐specific speed, power and dynamic strength. Scandinavian Journal of Medicine and Science in Sports, 23, 105-113.
Lovell R., Midgley A., Barrett S., Carter D., et al, Small K.. 2013;Effects of different half‐time strategies on second half soccer‐specific speed, power and dynamic strength. Scandinavian Journal of Medicine and Science in Sports 23:105–113. 10.1111/j.1600-0838.2011.01353.x.Macedo, C. D. S. G., Vicente, R. C., Cesário, M.D., & Guirro, R. R. D. J. (2016). Cold-water immersion alters muscle recruitment and balance of basketball players during vertical jump landing. Journal of Sports Sciences, 34, 348-357.
Macedo C. D. S. G., Vicente R. C., Cesário M.D., et al, Guirro R. R. D. J.. 2016;Cold-water immersion alters muscle recruitment and balance of basketball players during vertical jump landing. Journal of Sports Sciences 34:348–357. 10.1080/02640414.2015.1054861.Mohr, M., Krustrup, P., & Bangsbo, J. (2003). Match performance of high-standard soccer players with special reference to development of fatigue. Journal of Sports Sciences, 21, 519-528.
Mohr M., Krustrup P., et al, Bangsbo J.. 2003;Match performance of high-standard soccer players with special reference to development of fatigue. Journal of Sports Sciences 21:519–528. 10.1080/0264041031000071182.Mohr, M., Krustrup, P., Nybo, L., Nielsen, J. J., & Bangsbo, J. (2004). Muscle temperature and sprint performance during soccer matches–beneficial effect of re‐warm‐up at half‐time. Scandinavian Journal of Medicine and Science in Sports, 14, 156-162.
Mohr M., Krustrup P., Nybo L., Nielsen J. J., et al, Bangsbo J.. 2004;Muscle temperature and sprint performance during soccer matches–beneficial effect of re‐warm‐up at half‐time. Scandinavian Journal of Medicine and Science in Sports 14:156–162. 10.1111/j.1600-0838.2004.00349.x.Nunan, D., Donovan, G., Jakovljevic, D. G., Hodges, L. D., Sandercock, G. R., & Brodie, D. A. (2009). Validity and reliability of short-term heart-rate variability from the Polar S810. Medicine & Science in Sports & Exercise, 41, 243-250.
Nunan D., Donovan G., Jakovljevic D. G., Hodges L. D., Sandercock G. R., et al, Brodie D. A.. 2009;Validity and reliability of short-term heart-rate variability from the Polar S810. Medicine & Science in Sports & Exercise 41:243–250. 10.1249/mss.0b013e318184a4b1.Ohashi, J., Isokawa, M., Nagahama, H., & Ogushi, T. (1993). The ratio of physiological intensity of movements during soccer match-play. Science and Football II, 124-128.
Ohashi J., Isokawa M., Nagahama H., et al, Ogushi T.. 1993;The ratio of physiological intensity of movements during soccer match-play. Science and Football II :124–128.Pauole, K., Madole, K., Garhammer, J., Lacourse, M., & Rozenek, R. (2000). Reliability and validity of the T-test as a measure of agility, leg power, and leg speed in college-aged men and women. The Journal of Strength and Conditioning Research, 14, 443-450.
Pauole K., Madole K., Garhammer J., Lacourse M., et al, Rozenek R.. 2000;Reliability and validity of the T-test as a measure of agility, leg power, and leg speed in college-aged men and women. The Journal of Strength and Conditioning Research 14:443–450. 10.1519/00124278-200011000-00012.Patterson, S. M., Udermann, B. E., Doberstein, S. T., & Reineke, D. K. (2008). The effects of cold whirlpool on power, speed, agility, and range of motion. Journal of Sports Science & Medicine, 7, 387-394.
Patterson S. M., Udermann B. E., Doberstein S. T., et al, Reineke D. K.. 2008;The effects of cold whirlpool on power, speed, agility, and range of motion. Journal of Sports Science & Medicine 7:387–394.Peiffer, J. J., Abbiss, C. R., Watson, G., Nosaka, K., & Laursen, P. B. (2009). Effect of cold-water immersion duration on body temperature and muscle function. Journal of Sports Sciences, 27, 987-993.
Peiffer J. J., Abbiss C. R., Watson G., Nosaka K., et al, Laursen P. B.. 2009;Effect of cold-water immersion duration on body temperature and muscle function. Journal of Sports Sciences 27:987–993. 10.1080/02640410903207424.Proulx, C. I., Ducharme, M. B., & Kenny, G. P. (2003). Effect of water temperature on cooling efficiency during hyperthermia in humans. Journal of Applied Physiology, 94, 1317-1323.
Proulx C. I., Ducharme M. B., et al, Kenny G. P.. 2003;Effect of water temperature on cooling efficiency during hyperthermia in humans. Journal of Applied Physiology 94:1317–1323. 10.1152/japplphysiol.00541.2002.Richendollar, M. L., Darby, L. A., & Brown, T. M. (2006). Ice bag application, active warm-up, and 3 measures of maximal functional performance. Journal of Athletic Training, 41, 364-370.
Richendollar M. L., Darby L. A., et al, Brown T. M.. 2006;Ice bag application, active warm-up, and 3 measures of maximal functional performance. Journal of Athletic Training 41:364–370.Rowsell, G. J., Coutts, A. J., Reaburn, P., & Hill-Haas, S. (2011). Effect of post-match cold-water immersion on subsequent match running performance in junior soccer players during tournament play. Journal of Sports Sciences, 29, 1-6.
Rowsell G. J., Coutts A. J., Reaburn P., et al, Hill-Haas S.. 2011;Effect of post-match cold-water immersion on subsequent match running performance in junior soccer players during tournament play. Journal of Sports Sciences 29:1–6. 10.1080/02640414.2010.512640.Rowsell, G. J., Coutts, A. J., Reaburn, P., & Hill-Haas, S. (2009). Effects of cold-water immersion on physical performance between successive matches in high-performance junior male soccer players. Journal of Sports Sciences, 27, 565-573.
Rowsell G. J., Coutts A. J., Reaburn P., et al, Hill-Haas S.. 2009;Effects of cold-water immersion on physical performance between successive matches in high-performance junior male soccer players. Journal of Sports Sciences 27:565–573. 10.1080/02640410802603855.Stølen, T., Chamari, K., Castagna, C., & Wisløff, U. (2005). Physiology of soccer. Sports Medicine, 35, 501-536.
Stølen T., Chamari K., Castagna C., et al, Wisløff U.. 2005;Physiology of soccer. Sports Medicine 35:501–536.Vieira, A., Siqueira, A. F., Ferreira-Junior, J. B., do Carmo, J., Durigan, J. L., Blazevich, A., & Bottaro, M. (2016). The effect of water temperature during cold-water immersion on recovery from exercise-induced muscle damage. International Journal of Sports Medicine, 37, 937-943.
Vieira A., Siqueira A. F., Ferreira-Junior J. B., do Carmo J., Durigan J. L., Blazevich A., et al, Bottaro M.. 2016;The effect of water temperature during cold-water immersion on recovery from exercise-induced muscle damage. International Journal of Sports Medicine 37:937–943. 10.1055/s-0042-111438.Weston, M., Batterham, A. M., Castagna, C., Portas, M. D., Barnes, C., Harley, J., & Lovell, R. J. (2011). Reduction in physical match performance at the start of the second half in elite soccer. International Journal of Sports Physiology and Performance, 6, 174-182.
Weston M., Batterham A. M., Castagna C., Portas M. D., Barnes C., Harley J., et al, Lovell R. J.. 2011;Reduction in physical match performance at the start of the second half in elite soccer. International Journal of Sports Physiology and Performance 6:174–182. 10.1123/ijspp.6.2.174.Wilson, L. J., Cockburn, E., Paice, K., Sinclair, S., Faki, T., Hills, F. A., Gondek, M. B., Wood, A., & Dimitriou, L. (2018). Recovery following a marathon: A comparison of cold water immersion, whole body cryotherapy and a placebo control. European Journal of Applied Physiology, 118, 153-163.
Wilson L. J., Cockburn E., Paice K., Sinclair S., Faki T., Hills F. A., Gondek M. B., Wood A., et al, Dimitriou L.. 2018;Recovery following a marathon: A comparison of cold water immersion, whole body cryotherapy and a placebo control. European Journal of Applied Physiology 118:153–163. 10.1007/s00421-017-3757-z.Yeung, S. S., Ting, K. H., Hon, M., Fung, N. Y., Choi, M., Cheng, J. C., & Yeung, E. W. (2016). Effects of cold water immersion on muscle oxygenation during repeated bouts of fatiguing exercise: A randomized controlled study. Medicine, 95(1), e2455.
Yeung S. S., Ting K. H., Hon M., Fung N. Y., Choi M., Cheng J. C., et al, Yeung E. W.. 2016;Effects of cold water immersion on muscle oxygenation during repeated bouts of fatiguing exercise: A randomized controlled study. Medicine 95(1):e2455.