Pacing Strategy of Single Scullers during Rowing World Championships
Article information
Abstract
This study aimed to describe and compare the pacing strategy and performance of world level under 19 (U19), under 23(U23) and senior single scullers during world championship races. Data are from 8 years of Rowing World Championships A and B finals of single scull races for U19, U23 and senior age scullers. Pacing was determined for velocity, stroke rate and, distance per stroke (SD). Scullers presented a fast start strategy for all races investigated. There was no significant difference in pacing between age groups. Velocity peaked at the 100m (U19) and 150m (U23 and senior) mark. The scullers in the older age groups showed superior performance scores of the studied variables. U19, Under 23 and senior single scullers present similar pacing regardless of their age group. Performance of single sculler improve from U19, to U23 to senior for both lightweight and heavyweight classes. The results of this study may serve as a reference for athletes, coaches, and sports scientists to be implemented in training.
Introduction
There are 14 gold medals contested at the Olympic Games in rowing in different boat classes. Rowers can use a single (sweep boats) or a pair (scull boats) of oars to propel the boat, configured as either single (scull only) or crew (scull or sweep) of multiple athletes as well. Races occur over a six-lane, 2000m-long regatta course and last between ~ 5 and 8 minutes, depending on the boat class, athletes’ weight class and gender (Dimakopoulou et al., 2018; Garland, 2005; Muehlbauer & Melges, 2011). The duration of rowing races requires the athletes to manage their effort implementing their best pacing strategy. Further, the optimal pacing strategy may vary depending on race duration and format (Abbiss & Laursen, 2008; Dimakopoulou et al., 2018; Konings & Hettinga, 2018). Therefore, the study of pacing strategy in rowing plays an important role in understanding rowing performance and insights on optimal pacing strategy may increase the likelihood of competition success.
Studies investigating pacing strategy in rowing have examined performance of both simulated and official races over 2000m (Brown et al., 2010; Kleshnev & Nolte, 2001; Muehlbauer & Melges, 2011; Muehlbauer et al., 2010). These studies have used 500m splits, where researchers detected a commonly used “reversed J-shaped” pattern, with the first and last 500-m splits presenting higher velocities, compared to the mid-section (at the 1000-m and 1500-m marks) (Muehlbauer & Melges, 2011; Muehlbauer et al., 2010). Although these data inform how rowers race, they may be misleading due to a large distance between each split and the use of the average of 500m for each split. In fact, the analysis of few splits registered in longer intervals (four datapoints over 2000m) during the race may prevent the detection of important fluctuations in pacing (Goreham et al., 2020; Thiel et al., 2012). Moreover, it has been suggested that the analysis of splits every 5-to-10% of the race distance would yield important insights (Foster et al., 1994). It is surprising, however, that despite the availability of race splits at 50m intervals from race reports over the last decade, no study used such detailed information to investigate pacing strategies in more detail in rowing. Furthermore, not only the official race reports offer the velocity data for each race but also provide the stroke rate for each of these splits. Even though the distance per stroke (SD) can be derived from velocity and stroke rate data, it is surprising this variable has yet to be explored in the literature, since is often used by coaches and sport scientists in training (personal communication).
Besides the need for a more detailed information on pacing strategy of elite rowers in international competition, it is important to recognise that data from pacing strategy of rowers in different age groups is also lacking. Rowers start racing at the world championship level at the U19 World Championships (FISA, 2019). However, most of the studies on pacing strategy in rowing have been conducted with athletes from a narrow age window, which makes it difficult to understand the entire spectrum of pacing over different age stages. Increasing the understanding of how scullers pace their boat velocity, stroke rate and SD, and how scullers implement such pacing according to their age group is warranted in rowing. This knowledge could aid coaches and athletes in planning and monitoring training during long-term training process, and contribute to the advance of knowledge of the evolution and changes of pacing strategy. Therefore, this study aimed to describe and compare the pacing strategy and performance of world level U19, under 23 and senior single scullers in world championship races. It has been hypothesized that the pacing strategy of single scullers is a tactical quality that is developed since younger age, and do not differ between age groups. Also, single scullers present an increase in the scores of performance from younger to older age groups.
Methods
Study Design
This study used data collected from the website of the World Rowing (FISA, 2019). The on-water races from the Rowing World Championships, occurred between 2010 and 2018, were collected for analysis. Data for boat velocity (m · s−1), stroke rate (stroke · min−1) and SD (m · stroke cycle−1) from the A and B finals of under 19 (U19), under 23 (U23) and Senior (SR) data from the single scull races were concatenated for analysis.
Sample
Single sculls racing data (n=947) were subset to women single scull races (U19: n=70, 17.77±0.72 years; U23 heavyweight: n=107, 20.91±1.17 years; Senior heavyweight: n=84, 28.75±4.79 years; U23 lightweight: n=101, 20.81±1.30 years; Senior lightweight: n=103, 26.53±4.50 years) and men single scull races (U19: n=71, 17.99±0.45 years; U23 heavyweight: n=107, 21.13±1.18 years; Senior heavyweight: n=92, 28.61±4.56 years; U23 lightweight: n=106, 20.96±1.21 years; Senior lightweight: n=106, 26.02±3.36 years). Data from the finals A and B were concatenated before any data processing. Such a procedure aimed to represent the top 12 athletes in the world. All the data were collected from public access website and all the participants were de-identified so that no consent form was necessary.
Data Collection, Storage, and Processing
At the end of each Rowing World Championships, the International Rowing Federation (World Rowing (FISA, 2019) – https://www.worldrowing.com/events/results) provides reports in PDF format containing racing statistics, including boat velocity, stroke rate for each boat in the Finals. These values are produced and registered during the races by electronic units containing global positioning system (GPS) and accelerometers. These electronic units are approved for official using by FISA (FISA, 2019) Data were then transferred from the PDF files to a spreadsheet (Excel, Microsoft, Vermont, USA) (Microsoft, 2019) for processing. Data from velocity and stroke rate were subset by weight class and sex. The electronic units registered the scores for velocity and stroke rate every 50m throughout the 2000m course, providing 40 splits per boat per race. A new variable was created using the velocity and stroke rate to estimate the distance covered per stroke cycle, for every 50m split (equation 1).
Where SD is the distance per stroke estimation (in metres per stroke cycle), velocity is the average velocity for the 50m split, 60 represents one minute, and stroke rate is the average stroke rate in the 50m split. velocity and stroke rate were provided by the electronic unit attached to the boat. Each split was then normalized according to the average of the 40 splits and represented a percentage from the average (Borges et al., 2013; Brown et al., 2010; Foster et al., 1994; Garland, 2005). Equations 2, 3 and 4 describe the procedure:
After all the normalization procedures, data was scanned and filtered for outliers, using the 1.5 times interquartile range method. Data processing was performed using Excel ((Microsoft Excel, Microsoft, Vermont, USA) (Microsoft, 2019), R statistical software (R Development Core Team, 2021) and the package dplyr for R (Wickham et al., 2015).
Statistical Analysis
Results are presented as mean and standard deviation. The processed data were log-transformed to reduce non-uniform errors and back transformed for the parameter estimates. Mixed modelling procedures analysed the dependent variables velocity, stroke rate and SD and the independent variable age group was treated as the fixed effects in the model, whilst the athletes’ individual results were the random effects. 95% confidence interval was set for the model parameter estimates. Each 50m split, registered by the electronic unit was treated as the repeated measure of the dependent variables. The building of the model that best represented the data followed the initial adjustment of a linear model, and the degree of the polynomials tested up to a fourth-degree polynomial. Post hoc analysis with Bonferroni correction were performed when significant main effects were found. The t-statistic and the Chi-square derived from the models were then converted to coefficient of correlation r (Cohen, 1988) and interpreted as the effect size of that model using the thresholds 0.1, 0.3, 0.5, 0.7, 0.9 and 1 and interpreted as Trivial, Small, Moderate, Large, Very Large, Nearly Perfect and Perfect, respectively (Hopkins, 2002). All analysis were performed using the statistical software R (R Development Core Team, 2021) the multilevel package for R (Bliese, 2013) as well as a tailored function in R to calculate the effect size statistics. Significance level was set at p<0.05.
Results
Pacing of World Class Scullers
Heavy Weight
The pacing for velocity data from the heavy weight scullers presented a significant quadratic model adjustment for both women and men (p < 0.001, ES = 0.05 – Trivial, p < 0.001, ES = 0.05 – Trivial, respectively) (Figure 1. A (top) row and Figure 2. A (top) row – left panel). There were no significant differences in pacing for velocity data between U19, U23 and SR single scullers. Overall, peak velocity for women and men was reached at the 100m for U19 and 150m for U23 and SR, followed by a velocity decrease until the scullers either stabilize or increase velocity (Table 1). The percent decrease in table 1 represent the average of the percent velocity decrease of the split related to its immediate previous one. This calculation started after the first split after peak velocity and ended when velocity either stabilizes or starts increasing again (Figure 1. A (top) row and Figure 2. A (top) row – left panel). Pacing for stroke rate data displayed a significant quadratic model adjustment for both women and men scullers (p < 0.001, ES = 0.49 – Moderate, p < 0.001, ES = 0.33 – Moderate, respectively) (Figure 1. B (mid) row and Figure 2. B (mid) row – left panel). There were no differences in pacing for stroke rate data between U19, U23 and, SR scullers. Finally, the pacing for SD data presented a significant quadratic model adjustment for both women and men scullers (p < 0.0001, ES = 0.33 – Moderate, p < 0.0001, ES = 0.30 – Moderate, respectively) (Figure 1. C (bottom) row and Figure 2. C (bottom) row – left panel). No significant difference was found between U19, U23 and, SR for pacing.
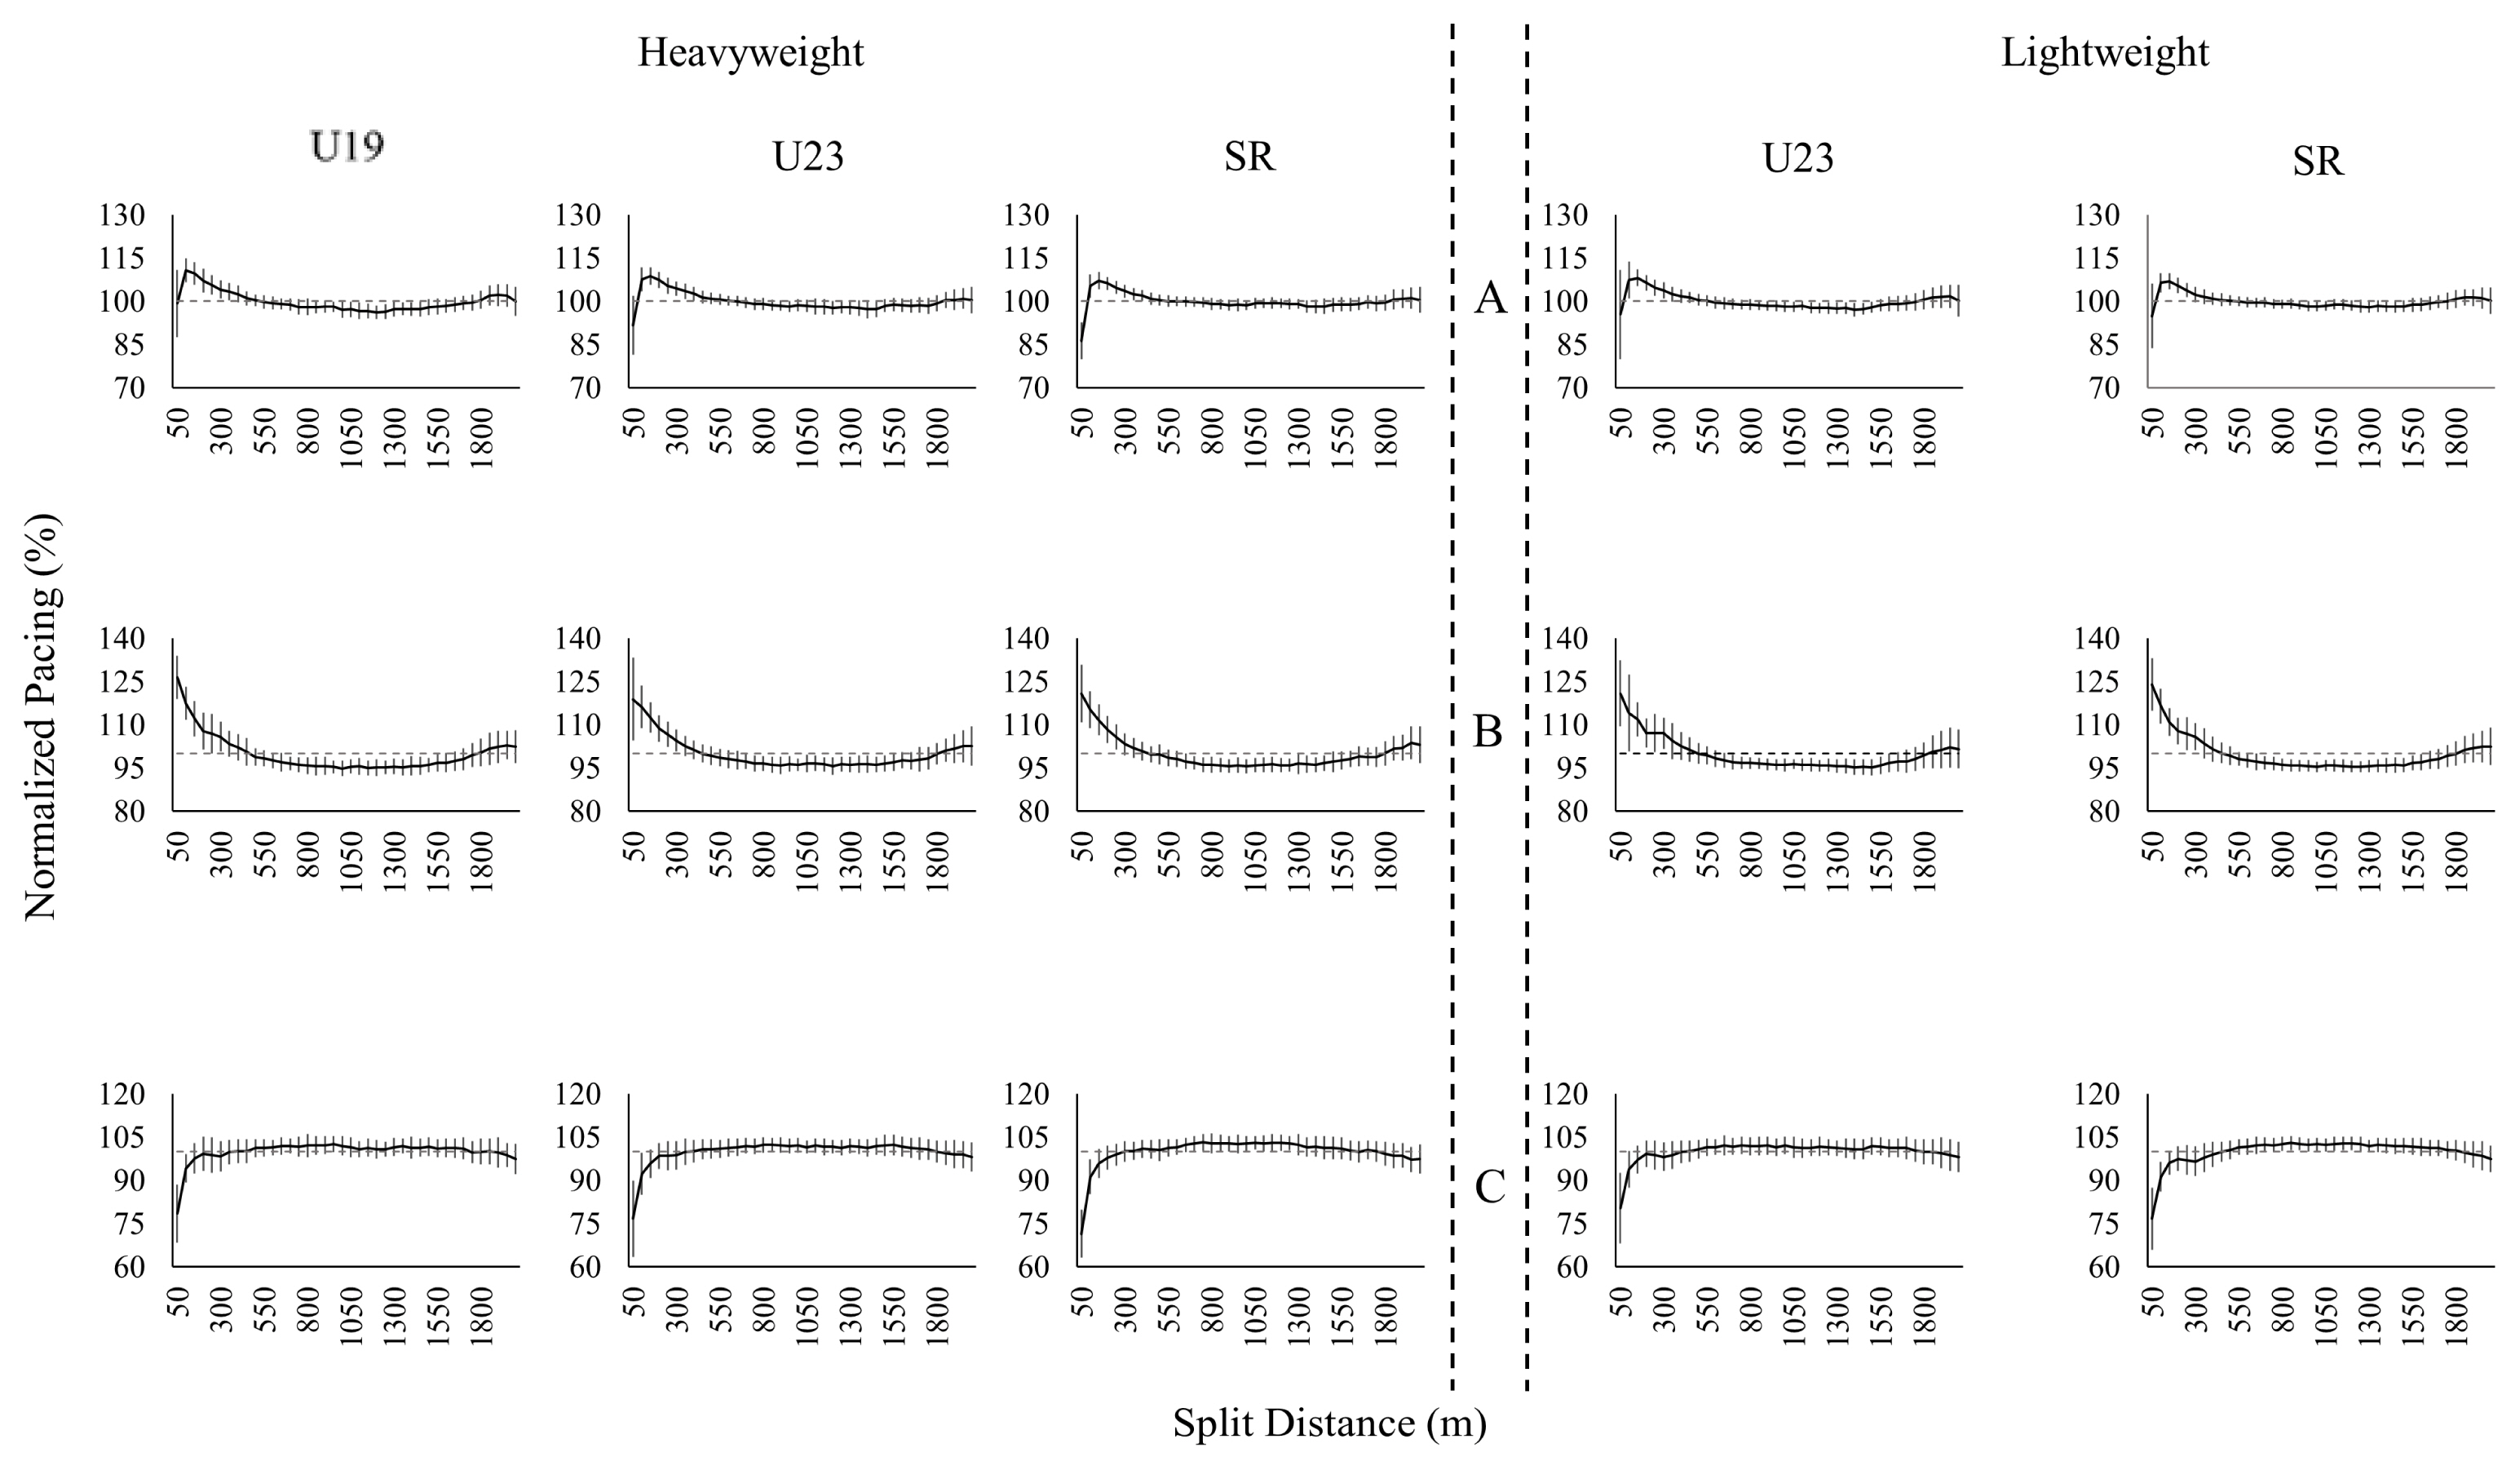
Women pacing results for normalized (%) pacing strategy for velocity (A panels), stroke rate (B panels) and distance per stroke (C panels) for heavyweight (left panel) and lightweight (right panel) classes

Men pacing results for normalized (%) pacing strategy for velocity (A panels), stroke rate (B panels) and distance per stroke (C panels) for heavyweight (left panel) and lightweight (right panel) classes

Splits of peak velocity location (average), end of velocity decrease (average), and percent velocity decrease of heavy and lightweight women and men scullers of different age groups
Lightweight Scullers
The pacing for velocity data of lightweight scullers presented a significant quadratic model adjustment for both women and men (p < 0.001, ES = 0.05 – Trivial, p < 0.001, ES = 0.05 – Trivial, respectively) (Figure 1. A (top) row and Figure 2. A (top) row – right panel). There were no significant differences in pacing for velocity data between lightweight U23 and lightweight SR single scullers. Peak velocity for both women and men was reached at the 150m mark (Figure 1. A (top) row and Figure 2. A (top) row – right panel). Pacing for the stroke rate data presented a significant quadratic model adjustment for both lightweight women and lightweight men scullers (p < 0.0001, ES = 0.75 – Very Large, p < 0.0001, ES = 0.33 – Moderate, respectively) (Figure 1. B (mid) row and Figure 2. B (mid) row – right panel). There were no differences in pacing for stroke rate data between lightweight U23 and, lightweight SR scullers. Lastly, pacing for the SD data presented a significant model adjustment for both women and men scullers (p < 0.0001, ES = 0.33 – Moderate, p < 0.001, ES = 0.33 – Moderate, respectively) (Figure 1. C (bottom) row and Figure 2. C (bottom) row – right panel). No significant difference was found between lightweight U23 and, lightweight SR for SD pacing.
Performance of World Class Scullers
Heavy Weight
Velocity
The performance data between the different age groups showed a significant main effect for the women (p < 0.0001, ES = 0.73 – Very Large) and the men scullers (p < 0.0001, ES = 0.70 – Very Large) with the athletes in the older age groups outperforming their younger counterparts (SR > U23 > U19) (Table 2).

Mean ±SD of the performances for velocity (m · s−1), stroke rate(stroke · min−1) and distance per stroke(m · stroke−1) in heavy and lightweight women and men scullers of different age groups
Stroke Rate
Stroke rate performance presented a significant increasing trend from the younger to the older age groups for both heavyweight and lightweight classes. Data presented a significant main effect for the women (p < 0.0001, ES = 0.47 – Moderate) and men (p < 0.0001, ES = 0.57 – Large) (Table 2).
Lightweight
Velocity
The performance for velocity showed a significant main effect for women (p = 0.03, ES = 0.26 – Small) (Table 2).
Stroke Rate
The performance for the stroke rate data showed significant main effects for the women (p = 0.03, ES = 0.26 – Small) and men (p = 0.006, ES = 0.30 – Moderate) (Table 2).
Discussion
This study investigated the pacing and performance of different age group scullers in regattas of a series of World Rowing Championships. The main findings of this investigation showed that single scullers implement a fast start, regardless of their age group, weight class and gender. However, the peak velocity occurs at the 100m mark for the U19 and 150m for U23 and SR for both weight classes. The pacing strategy follows a similar pattern and does not change significantly from U19 to U23 to SR for velocity, SR, and SD. The performance of single scullers significantly improved from U19, to U23, to SR age groups.
The literature in rowing has established that rowers present a reversed J-shaped pacing strategy (Brown et al., 2010; Garland, 2005; Muehlbauer et al., 2010), when analysing 500-m splits of the 2000-m regatta course. In the reversed J-shaped pacing strategy, the average velocity of the first split (500m mark) is higher than the other splits. However, these scores correspond to the averaged velocity calculated as the ratio between the distance and time. The present study confirms that world class scullers of different age groups start significantly fast (main effect of pacing of p < 0.001 for the age groups analysed). Surprisingly, the pacing strategy was not significantly different between the age groups investigated. A possible explanation is that since pacing is a tactical quality, athletes are taught their pacing strategy from the U19 age group and may optimize it over the years of training and competition.
Using lower resolution data such as four data points in a 2000-m long race may overshadow the actual details of a race. For example, whilst the literature presents peak velocity at the 500m mark (Garland, 2005; Kleshnev & Nolte, 2001; Muehlbauer et al., 2010), the present study showed that single scullers of different age groups actually peak velocity at the 100m mark (U19) and 150m mark (U23 and SR) (Figures 1 and 2) and continuously decrease velocity until stabilization or a new increase, towards the finish line (Table 1). This is the first study to describe the actual peak velocity in scullers of different age groups. The U19 scullers might still lack experience to manage their races since they are at the beginning of their racing development. Moreover, they may lack the physical requirements to be able to prolong their start and point of peak velocity. This also applies to the rate of decrement during the races, since the younger athletes decreased velocity for a longer distance (Table 1). Additionally, the U19 age group is considered an ‘open weight class’, where scullers from a range of body mass compete and are not divided according to their body mass. Not only this present an additional noise to this data, but also, requires comparison with their heavyweight, older counterparts (the heavyweight can be considered as an open weight class). Therefore, these finding expand on the current knowledge that fast start is common practice, but velocity peaks earlier in the race and depends on the age group. Finally, each age group presented their own decreasing rate. These findings confirms that the analysis of splits every 5-to-10% of the race distance would yield important insights (Foster et al., 1994).
The studies that investigated pacing in rowing have used four 500-m splits to characterize pacing and the variable of choice, not surprisingly was boat velocity (Garland, 2005; Muehlbauer & Melges, 2011; Muehlbauer et al., 2010). On the other hand, other factors seem to impact rowing performance, including stroke rate. Despite stroke rate of rowing races having been available on the race reports, this is the first study to investigate this component of rowing regattas in single scullers of different weight class and age groups. Stroke rate plays a key role in mechanical power (Held et al., 2020) and distribution of net mechanical power (Hofmijster et al., 2007). For instance, Held et al. (Held et al., 2020) found that in experienced sub-elite young scullers, as stroke rate increases, there is a 4.4% gain in power output per stroke (r=0.98, p < 0.001). The same study also presented a significant relationship between work-per-stroke and stroke rate (r=0.79, p < 0.001). The pacing strategy for stroke rate in the present study presented similar results to pacing of velocity. The fast start is also reflected in stroke rate, with significant main effect for all the age groups in the present study (p < 0.001). Surprisingly, however is the lack of significant difference in pacing for stroke rate between the age groups. A possible explanation for these results is that pacing represents a tactical component of rowing and athletes may be taught to race following this standard since younger age. Moreover, the current findings suggest that world class single scullers of different age groups managed their pacing strategy for boat velocity and stroke rate, simultaneously. The data presented herein, and the literature suggest an interplay between velocity and stroke rate. In fact, the interaction between stroke rate and gain in power as well as the relationship between work per stroke and stroke rate (Held et al., 2020) may be one of the reasons why the fluctuations in velocity and stroke rate in a race follow similar patterns. Moreover, the stroke rate data of the present study significantly increases from U19 to U23 to SR, which is followed by increases in velocity. This response seems to confirm the dependence of the velocity on the stroke rate. Regarding pacing for the SD (derived from boat velocity and stroke rate), a similar response compared to velocity and stroke rate was encountered. Although this is not surprising since SD a derived variable, this finding adds on the current knowledge of pacing strategy of single scullers. The scores for SD remained consistent across all age groups and weight classes (Table 2). It appears that scullers manage to move their boats for each stroke cycle similarly regardless of their age groups. Again, SD is a derived feature, and its scores relies on the relationships between velocity and stroke rate. Since the scullers managed to increase both stroke rate and velocity, the SD remained similar because of these relationships. This study was the first to examine the development of pacing strategies of single scull athletes from different age groups for velocity, stroke rate and SD.
Increasing the understanding of factors that affect competitive performance is of interest of coaches, athletes and, sport scientists alike. These factors include the velocity, stroke rate and the SD. These factors relate to technical and physiological development for the scullers over time (Bourgois et al., 2014; Brown et al., 2010; Spinks, 1986). The results describe the development of sculler’s performances (Table 2). As the athletes age, the enhancement of biological, technical, and tactical aspects of performance occurs. For example, Bourgois et al. (Bourgois et al., 2014) found that through a 15-year period, a successful sculler (placed 4th at both Olympic Games and World Championship) increased boat velocity reaching a 12 % gain as well as an improvement of approximately of 2 L · min−1 in maximal oxygen consumption. The current results showed significant increments of velocity and stroke rate between the scullers of different age groups (from U19 to U23 to SR). Such evidence suggests that there might exist a learning effect on how to race more effectively, along with the natural development from training and biologically-induced adaptations. Finally, the findings of this study suggest the importance of ongoing monitoring of athletes from different age groups to increase the understanding of factors affecting performance.
This study investigated the best scullers in a series of World Rowing Championships. It was found that the pacing strategy presented by the senior scullers seems to be taught to their younger counterparts as a model of success. The results of this study suggest that scullers from younger age groups fine-tune their racing strategies as they move to older age groups.
Limitations
Pacing strategy is an important component of rowing racing and may be part of the preparation of the athletes for competition. There is a pacing strategy that appears to be optimal in the best scullers in the world. However, a limitation of this study is that the data come from the best 12 best scullers in the world for each year and the generalization of the finding should take that into consideration.
Conclusion
This study investigated the pacing strategy and performance of single scullers in World Championship regattas of women and men from U19, U23 and SR age groups. The results confirms that a fast start is common practice in world class scullers of different age groups and weight classes. Also, the pacing strategy implemented by the different age groups are similar, suggesting scullers are prepared to race similarly from U19 to U23 to SR. Secondly, single scullers peak velocity between the 100 and 150m split, depending on the age group. Thirdly, detailed data shed light on the understanding of pacing strategy of world class single scullers, with smaller portions of the race yielding more details of pacing strategies compared to using larger (500-m) intervals. Fourth, elite scullers utilized a more subtle reversed J-shaped pacing strategy, with a fast start occurring sooner than what had been believed. Finally, the scullers showed improved performance scores according to the age group. The results of the present study may serve as a reference for athletes, coaches, and sport scientist to be implemented in training and competition.
Acknowledgements
The authors would like to thank Dr. Tom Kempton for his invaluable inputs and reviewing of this paper.