Bone mineral density and specific physical performance in Korean national amateur male boxers
Article information
Abstract
Background
The objective of this study was to investigate the relationships between bone mineral density, the level of anaerobic capacity and muscle strength in Korean national amateur male boxers.
Methods
We carried out a cross-sectional population-based study where fifty-six Korean national amateur male boxers were enrolled. The participants’ whole-body bone and regional mineral density (BMD) and bone mineral content (BMC) were assessed using dual-energy X-ray absorptiometry as the main outcome. The anaerobic capacity was assessed using the Upper and lower Wingate test, and muscle strength was assessed using Isokinetic muscle strength and Maximal strength.
Results
Of the fifty-six boxer, 37.5% were classified as LWC, 32.1% as MWC, and 30.3% as HWC. Linear regression analyses showed that the severity of bone variable was associated with upper and lower-body anaerobic capacity. Isokinetic muscle strength and Maximal strength were positively associated with bone variables.
Conclusions
Within athletes of Korean national amateur male boxers, anaerobic capacity, and muscle strength measurements were positively associated with bone variables. Further research is needed to elucidate mechanisms underlying this positive association that is, undertaking studies involving effective exercise and nutrition supplements treatments, and developing the study designs to facilitate analysis of this relationship.
Introduction
Boxing is a combat sport that requires complex energy pathway and physical functions, and is a high-intensity intermittent combat sport that relies mostly on aerobic energy pathway during the competition (Slimani et al., 2017). In fact, this energy system is reported to contribute to boxers' ability to repeat attacks at the highest strength and speed during the competition. In contrast, the muscle strength and power in both the upper and lower limbs are involved in the generation of the explosiveness of punches, and the absolute punch force exceeds 4000 Nm for the highly developed elites. Thus, punches occurring during the competition are anaerobic metabolic pathways, providing energy for short and violent attacks with maximum output (Chaabene et al., 2015; Nassib et al., 2017; Slimani et al., 2017).
Muscle strength and bone mass are closely linked throughout lifetime, and previous studies have reported a link between parameters of bone and lean body mass (Khawaja et al., 2019). However, cross-sectional studies showed that athletes involved in sports with high muscular contraction or ground-reaction forces on the skeleton, such as weight lifting (Nasri et al., 2015) and gymnastics (Bolam, Skinner, Sax, Adlard, & Taaffe, 2016; Nasri et al., 2015), have a higher bone mineral density (BMD) at the hip and lumbar spine compared to non-athletes. Thus, it is well established that exercise may play an important role in improving bone health as a result, it is suggested that exercise interventions involving resistance training or multicomponent exercise are the most beneficial to improve BMD (Bolam, van Uffelen, & Taaffe, 2013; Gomez-Cabello, Ara, Gonzalez-Aguero, Casajus, & Vicente-Rodriguez, 2012; Guadalupe-Grau, Fuentes, Guerra, & Calbet, 2009). However, although it is widely accepted that muscle strength has such a significant correlation with bone mass, little is known about the relationship between maximum power and BMD for boxing athletes. In addition, multiple reports examine demonstrated the relationship between types of sports and BMD and BMC, and demonstrated the relationships between types of sports that athletes are concomitant with BMC and BMC, there are very few reports demonstrating the relationship between BMD and BMC with boxing.
While some studies have reported bone parameter differences in male boxers, however, the evidence is limited (Sabo, Bernd, Pfeil, & Reiter, 1996; Trutschnigg, Chong, Habermayerova, Karelis, & Komorowski, 2008). Thus, in order to enhance the understanding of the effects of boxing on BMD, the studies with a greater subject number need to be undertaken with parameters of bone and muscle power as the primary outcomes in the male boxers population. In addition, the relationship between anaerobic power and parameters of bone needs to be more clarified. Therefore, the purpose of this study is to investigate the relationships between the level of anaerobic capacity and muscle strength with bone mineral density (BMD) in Korean national amateur male boxers.
Methods
Study Sample
The study carried out a cross-sectional population-based study that enrolled fifty-six Korean national amateur male boxers (21.5±2.19yrs, 177.8±8.30cm, 74.4±18.43kg). Fifty-six male athletes were classified into 3 categories light-weight category (LWC; the light fly to the light), middle-weight category (MWC; the light welter to the middle), and Heavy-weight category (HWC; the light heavy to the heavy) (Kim, Song, & Min, 2016). Cross-sectional data included demographic, and height and body mass were measures in a standing position wearing minimal clothing following standardized procedures. A body mass index (BMI) (kg/m2) was calculated by dividing weight (kg) by height in squared (m2).
Bone Parameter Measurements
Bone mass was determined by dual-energy X-ray absorptiometry (DXA) scan using the GE Lunar Prodigy Advance Scanner (Lunar Prodigy; GE Medical Systems Lunar, US). The mass of lumbar spine (vertebrae L2-4) and femoral neck (FN) were assessed by the DXA scan (Dolan et al., 2012; Khawaja et al., 2019; Nasri et al., 2015), and positioning for all scans was completed in accordance with manufacturer instructions. Bone mineral density (BMD) was reported as grams of absolute bone mineral content (BMC) per cm2 of projected bone area (BA).
Anaerobic Power assessment: Upper and lower Wingate test
All out test for Wingate Anaerobic test was undertaken using an arm-ergometer (Brachumera Sports, LODE, NLD) and cycle-ergometer (Excalibur Sports, LODE, NLD) for 30 seconds. Before the test, a standard warm-up was executed by the participants (single bouts of 3 min at 60 rpm, 50 W). The test started after a computer sound simultaneously with the beginning of load registration (MacIntosh, Rishaug, & Svedahl, 2003). Participants were told to start pedaling immediately after the signal, with maximal speed and held at maximal levels during the entire test. The load was set at 7.5% (4.41J)/kg of body mass, based on previous recommendations. Power output was measured every second and the highest value was considered the Peak Power, whereas the average in the 30-sec period was defined as Average Power. Peak Power and Average Power were expressed in absolute values (W) and relative to body mass (W/kg) as previously reported (Franchini, 2019). They had a 60-minute break between each Wingate test (Kim et al., 2016).
Strength assessment: Isokinetic muscle strength and Maximal strength
On the same day, maximal isokinetic peak torque of trunk extension/flexion and knee extension/flexion of dominant leg were measured using a HUMAC NORM Isokinetic Dynamometer (Humac Norm CSMi, Stoughton MA, USA). Prior to testing each movement, isokinetic testing procedures were explained and a five-minute warm-up was given to participants. The participants undertake the maximal test for three-time repetitions. Each maximal strength test was carried out with an angular speed of 60°/s (velocity of 60°/s) for the knee, and an angular speed of 30°/s (velocity of 30°/s) for the trunk. Maximal peak torques of each muscle group were defined as the highest torque produced in one trial. Five minute rest periods were given between every set of contractions. The maximal strength was determined for upper and lower limbs through bench press and squat exercise, both performed on the Smith Machine (ACE-2000 Multi-function, Ariel Dynamics, USA). Bench press at an angular bar velocity of 10˚/s approximately 20˚ of the subject’s functional range of motion (ROM) of the bar range. Barbell was positioned across the boxers’ chest. The athletes held the barbell with an initial elbow angle of 90, shoulder width (Grooten, Puttemans, & Larsson, 2002). Squat exercise was performed at an angular bar velocity of 10˚/s extension and unloaded flexion close to 15˚ of the bar’s range, at the subject’s functional ROM. The subject was standing straight with a lever arm of a constant length attached to the subject’s shoulders (Jablonowsky, Inbar, Rotstein, & Tenenbaum, 1992). A short break was provided between each repetition and between each set 1min to record the data. The total experiment took 10–20min. The subjects were instructed to push the bar ‘as fast as possible’ during expiration, and they were verbally encouraged to perform at their maximal capacity.
Statistical analyses
Statistical analyses were performed using SPSS 22.0 (IBM Corporation, Chicago, IL). The basic characteristics of the study sample were stratified by weight category status. The light-weight category (LWC), the middle-weight category (MWC), and the heavy-weight category (HWC) were compared using the x2 test (categorical variables) and Student t-test (continuous variables). Moreover, linear regression was used to analyze the relationship between bone variables, as the dependent variable, and several measures of anaerobic power and muscle strength, as independent variables. In addition, the regression model of both unadjusted results and adjusted results with age and BMI were used. The threshold for statistical significance was considered with a p-value < .05.
Results
At baseline, the mean age of the study participants was 21.5 years (± 2.19 SD). Table 1 presents the characteristics of LWC (n=21, 37.5% of total), MWC (n=18, 32.1%), and HWC (n=17, 30.4%) participants. The differences among the three groups were significant. Differences were significant in age (p = 0.012), height (p = 0.000), body weight (p = 0.000), body fat (p = 0.000), BMI (p = 0.000), L2-4 BMD (p = 0.000), L2-4 BMC (p = 0.000), L2-4 BA (p = 0.000), FN BMD (p = 0.000), FN BMC (p = 0.000), and FN BA (p = 0.000) between the groups (Table 1).

Characteristics of study participants by group
The upper-body anaerobic Average power was correlated to L2-4 BMD (p = 0.001), L2-4 BMC (p <0.001), FN BMD (p < 0.001), and FN BMC (p < 0.001). Of the specific area, Maximal power was significantly correlated to L2-4 BMD (p < 0.001), L2-4 BMC (p < 0.001), FN BMD (p < 0.001), and FN BMC (p < 0.001). Power drop rate was significantly correlated to L2-4 BMD (p = 0.003), L2-4 BMC (p <0.001), FN BMD (p = 0.002), and FN BMC (p < 0.001). Total KPM presented significant correlated with L2-4 BMD (p = 0.001), L2-4 BMC (p <0.001), FN BMD (p < 0.001), and FN BMC (p < 0.001) (Table 2).

Association Between Upper Anaerobic Power With Measures of Bone Variables.
Lower-body anaerobic maximal power was positively correlated to L2-4 BMD (R2 = 0.275; p < 0.001), L2-4 BMC (R2 = 0.483; p <0.001), FN BMD (R2 = 0.308; p < 0.001), and FN BMC (R2 = 0.510; p < 0.001). Average power was positively correlated to L2-4 BMD (R2 = 0.266; p < 0.001), L2-4 BMC (R2 = 0.490; p <0.001), FN BMD (R2 = 0.327; p < 0.001), and FN BMC (R2 = 0.545; p < 0.001) (Figure 1).
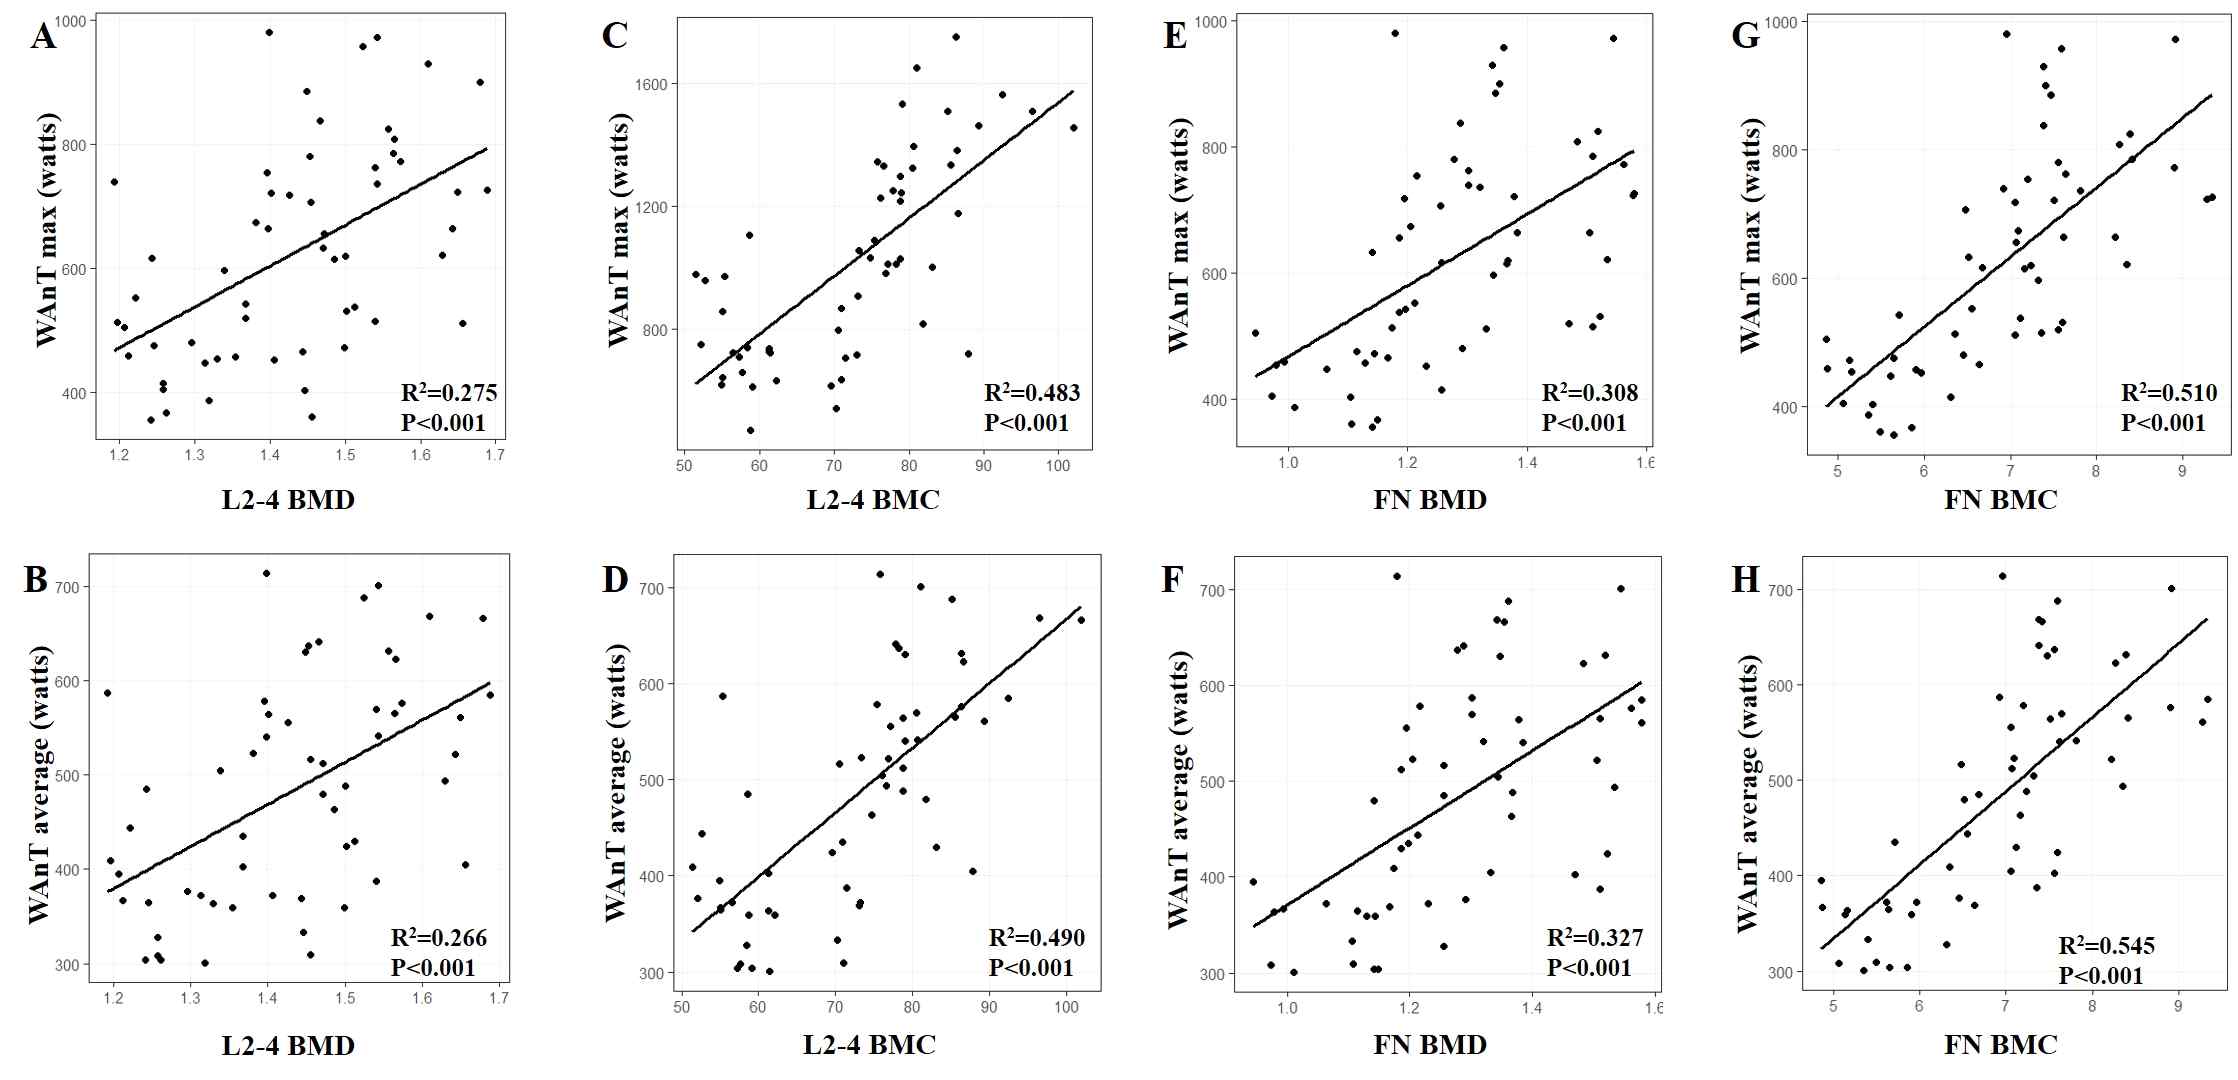
Association between Lower Anaerobic power and Bone Variables. Arithmetic mean of L2-4 BMD, L2-4 BMC, FN BMD, and FN BMC.
Knee flexor and extensor was significantly correlated to L2-4 BMD (p = 0.001, p < 0.001; respectively), L2-4 BMC (p < 0.001, p < 0.001; respectively), FN BMD (p < 0.001, p < 0.001; respectively), and FN BMC (p < 0.001, p < 0.001; respectively). Trunk flexor and extensor was significantly correlated to L2-4 BMD (p < 0.001, p < 0.001; respectively), L2-4 BMC (p < 0.001, p < 0.001; respectively), FN BMD (p < 0.001, p < 0.001; respectively), and FN BMC (p < 0.001, p < 0.001; respectively). Chest press was significantly correlated to L2-4 BMD (p = 0.004), L2-4 BMC (p < 0.001), FN BMD (p = 0.002), and FN BMC (p < 0.001). Squat was significantly correlated to L2-4 BMD (p = 0.002), L2-4 BMC (p <0.001), FN BMD (p = 0.002), and FN BMC (p < 0.001) (Table 3).

Association Between Isokinetic Knee strength and Maximal Strength With Measures of Bone Variables.
After adjusting for BMI and age, Upper anaerobic Average power, Maximal power, and Total KPM remained positively correlated to L2-4 BMC (p = 0.028, p < 0.001, p = 0.027; respectively), and FN BMC (p = 0.003, p < 0.001, p = 0.003; respectively). After adjusting for BMI and age, knee and trunk flexor/extensor remained positively correlated to L2-4 BMC (p = 0.001, p < 0.002, p < 0.001, p < 0.001; respectively), and FN BMC (p = 0.021, p < 0.001, p = 0.005; respectively). However, Knee extensor was not significantly correlated to FN BMC, whereas Trunk extensor was only significant correlated to L2-4 BMD (p = 0.002) (table2 and Table 3).
Discussion
In this study, this study examined the association between Bone mineral density and physical performance (anaerobic capacity and muscle strength assessment) in Korean national amateur male boxers. To the best of our knowledge, this is one of the first studies describing the relationship between BMD and anaerobic power in Korean national amateur male boxers. The results of this study showed significant correlation between parameters of bone (BMD and BMC) and anaerobic power (Upper and lower Wingate test), and between parameters of bone (BMD and BMC) and the muscle strength (Isokinetic muscle strength and Maximal strength) as the major findings. The presences of these relationships were not surprising given the well-established positive muscle-bone relationship (Edwards et al., 2013; Frank, Lorbergs, Chilibeck, Farthing, & Kontulainen, 2010), Moreover, the result of this study reinforces the importance of muscle strength for bone health. And previous studies have reported the associations of muscle mass with BMC and BMD (Khawaja et al., 2019).
Multiple studies have found that BMD is higher in athletes participating in high-impact loading and multidirectional loading sports including volleyball, basketball, gymnastics, boxing, and softball. In contrast, the population of athletes participating in running, bicycling, swimming, rowing, and cross-country running had lower average BMD. Based on these results, the bone stress associated with exercise has been shown to be effective in maintaining and increasing the BMD, and the bone load appears to be increasing in parallel with the increased strength of exercise (Arasheben, Barzee, & Morley, 2011). Similarly, the short and forceful stimulation induced by bone loading activities has a greater increase in BMD compared to long, moderate, repetitive stresses. Multiple studies have demonstrated a congruent positive correlation between muscle strength and BMD and have indicated that peak BMD is influenced by acquired muscle mass (Khawaja et al., 2019). Our results agree with the results of previous studies, and demonstrated a positive correlation between isokinetic muscle strength and maximal strength with BMD (Table 3.). In the same way, In particular, the Judo and Karate athletes, who practice a high-intensity loading sport, had greater muscle strength and BMD values compared with the other athletes. Furthermore, previous studies have shown that athletes practicing judo and taekwondo have bigger BMDs compared to runners.(Nasri et al., 2015). Therefore, believe that the benefits of bone density may be related to long-term combat sports practices.
This study demonstrated a positive correlation between upper-body anaerobic average power and maximal power with BMD and BMC (L2-4 and FN; respectively). Although, there is no prior study on the skeletal value and anaerobic power to compare directly, Emeterio et al., (2011) confirmed the correlation between the skiers' countermovement jump and BMD by suggesting the effect of training. Bone mineralization is stimulated by activities inducing impacts on the bone, such as jumping, and these activities may provide stimulations that induce muscular strength improvement of the legs. This will account for a significant relationship between changes in the BMD and CMJ in L2-L4 (Alvarez-San Emeterio, Antunano, Lopez-Sobaler, & Gonzalez-Badillo, 2011). After adjusting for age and BMI, anaerobic power and muscle strength remained significantly correlated to BMC, whereas BMD was not significantly correlated to anaerobic power and muscle strength. Accordingly, the relationships between specific physical performance and bone variables in amateur male boxers seem to be influenced by age and BMI. In addition, power drop rate also failed to correlate after adjusting, which is believed to be related to other physiological mechanisms, not age or BMI.
There are some limitations to this study to be commented on. First, this is a cross-sectional study, and we can only report the association and not infer causality. Second, a relatively small sample size that includes subjects from a single organ. Third, multi-instrument research involving more subjects is needed to confirm the results of this study.
Conclusions
In conclusion, current research shows that BMD and BMC are positive factors determining the anaerobic power and maximal power of Korean national amateur male boxers. Also, our research shows that maximum power is an independent determinant of FN BMD and L1-L4 BMD in male boxers. Our study is one of very few studies that demonstrated positive correlations between maximum power and bone variables in amateur male boxers. However, additional studies are needed to confirm or refute our findings. Further research is needed to elucidate mechanisms underlying this positive association, that is, undertaking studies involving effective exercise and nutrition supplements treatments, and developing the study designs to facilitate analysis of this relationship.
Conflicts of Interest
The authors declare no conflict of interest.
References
Alvarez-San Emeterio, C., Antunano, N. P., Lopez-Sobaler, A. M., & Gonzalez-Badillo, J. J. (2011). Effect of strength training and the practice of Alpine skiing on bone mass density, growth, body composition, and the strength and power of the legs of adolescent skiers. J Strength Cond Res, 25(10), 2879-2890.
10.1519/JSC.0b013e31820c8687.Arasheben, A., Barzee, K. A., & Morley, C. P. (2011). A meta-analysis of bone mineral density in collegiate female athletes. J Am Board Fam Med, 24(6), 728-734.
10.3122/jabfm.2011.06.100289.Bolam, K. A., Skinner, T. L., Sax, A. T., Adlard, K. N., & Taaffe, D. R. (2016). A Comparison of Bone Mineral Density in Amateur Male Boxers and Active Non-boxers. Int J Sports Med, 37(9), 694-699.
10.1055/s-0042-104200.Bolam, K. A., van Uffelen, J. G., & Taaffe, D. R. (2013). The effect of physical exercise on bone density in middle-aged and older men: a systematic review. Osteoporos Int, 24(11), 2749-2762.
10.1007/s00198-013-2346-1.Chaabene, H., Tabben, M., Mkaouer, B., Franchini, E., Negra, Y., Hammami, M., . . . Hachana, Y. (2015). Amateur boxing: physical and physiological attributes. Sports Med, 45(3), 337-352.
10.1007/s40279-014-0274-7.Dolan, E., Crabtree, N., McGoldrick, A., Ashley, D. T., McCaffrey, N., & Warrington, G. D. (2012). Weight regulation and bone mass: a comparison between professional jockeys, elite amateur boxers, and age, gender and BMI matched controls. J Bone Miner Metab, 30(2), 164-170.
10.1007/s00774-011-0297-1.Edwards, M. H., Gregson, C. L., Patel, H. P., Jameson, K. A., Harvey, N. C., Sayer, A. A., . . . Cooper, C. (2013). Muscle size, strength, and physical performance and their associations with bone structure in the Hertfordshire Cohort Study. J Bone Miner Res, 28(11), 2295-2304.
10.1002/jbmr.1972.Franchini, E. (2019). Upper-body Wingate test classificatory table for adult judo athletes. J Exerc Rehabil, 15(1), 55-59.
10.12965/jer.1836520.260.Frank, A. W., Lorbergs, A. L., Chilibeck, P. D., Farthing, J. P., & Kontulainen, S. A. (2010). Muscle cross sectional area and grip torque contraction types are similarly related to pQCT derived bone strength indices in the radii of older healthy adults. J Musculoskelet Neuronal Interact, 10(2), 136-141.
Gomez-Cabello, A., Ara, I., Gonzalez-Aguero, A., Casajus, J. A., & Vicente-Rodriguez, G. (2012). Effects of training on bone mass in older adults: a systematic review. Sports Med, 42(4), 301-325.
10.2165/11597670-000000000-00000.Grooten, W., Puttemans, V., & Larsson, R. (2002). Reliability of isokinetic supine bench press in healthy women using the Ariel Computerized Exercise System. Scandinavian journal of medicine & science in sports, 12(4), 218-222.
10.1034/j.1600-0838.2002.00142.x.Guadalupe-Grau, A., Fuentes, T., Guerra, B., & Calbet, J. A. (2009). Exercise and bone mass in adults. Sports Med, 39(6), 439-468.
10.2165/00007256-200939060-00002.Jablonowsky, R., Inbar, O., Rotstein, A., & Tenenbaum, G. (1992). Evaluation of anaerobic performance capacity by the isokinetic ariel computerized exercise. J Sports Med Phys Fitness, 32, 262-270.
Khawaja, A., Sabbagh, P., Prioux, J., Zunquin, G., Baquet, G., Maalouf, G., & El Hage, R. (2019). Does Muscular Power Predict Bone Mineral Density in Young Adults? Journal of Clinical Densitometry.
10.1016/j.jocd.2019.01.005.Kim, K.-J., Song, H.-S., & Min, S.-K. (2016). Body Composition and specific physical fitness profiles of the Korean national amateur boxers. Exercise Science, 25(1), 33-42.
10.15857/ksep.2016.25.1.33.MacIntosh, B. R., Rishaug, P., & Svedahl, K. (2003). Assessment of peak power and short-term work capacity. Exercise Science, 2588(6), 572-579.
10.1007/s00421-002-0742-x.Nasri, R., Hassen Zrour, S., Rebai, H., Neffeti, F., Najjar, M. F., Bergaoui, N., . . . Tabka, Z. (2015). Combat sports practice favors bone mineral density among adolescent male athletes. J Clin Densitom, 18(1), 54-59.
10.1016/j.jocd.2013.09.012.Nassib, S., Hammoudi-Nassib, S., Chtara, M., Mkaouer, B., Maaouia, G., Bezrati-Benayed, I., & Chamari, K. (2017). Energetics demands and physiological responses to boxing match and subsequent recovery. J Sports Med Phys Fitness, 57(1-2), 8-17.
10.23736/S0022-4707.16.05958-2.Sabo, D., Bernd, L., Pfeil, J., & Reiter, A. (1996). Bone quality in the lumbar spine in high-performance athletes. Eur Spine J, 5(4), 258-263.
10.1007/BF00301329.Slimani, M., Chaabene, H., Davis, P., Franchini, E., Cheour, F., & Chamari, K. (2017). Performance Aspects and Physiological Responses in Male Amateur Boxing Competitions: A Brief Review. J Strength Cond Res, 31(4), 1132-1141.
10.1519/JSC.0000000000001643.Trutschnigg, B., Chong, C., Habermayerova, L., Karelis, A. D., & Komorowski, J. (2008). Female boxers have high bone mineral density despite low body fat mass, high energy expenditure, and a high incidence of oligomenorrhea. Appl Physiol Nutr Metab, 33(5), 863-869.
10.1139/H08-071.