Scale development for measuring social capital in sports club
Article information
Abstract
In this article, I develop a scale for measuring social capital scale in a sports club (SCSSC) to review the concept of social capital based on sports club members and construct social capital scale in a sports club context. This article employees the methodology of scale development, which involves three studies: Study 1, qualitative assessment for scale generation was insisted with an in-depth interview and focus group interview. To address scale development, two times quantitative surveys were conducted. Study 2, for scale refinement, used parallel analysis and exploratory factor analysis. Study 3, confirmatory factor analysis to confirm the essence of the SCSSC construct and its' dimensionality. In order to verify the hierarchical properties of the factor structure, higher-order factor analysis was implemented by dividing the above factors into a single factor and double factors. After comparing the two types of factors, results reflected a hierarchical relationship between the single factor and 5 sub-factors of social capital in sports clubs. Lastly, in order to verify the predictability of the deduced scale, satisfaction of life was used as a dependent variable to conduct a causality analysis in which results showed a statistical signification relationship.
Introduction
Participants in sports tend to very actively interact with other participants while playing sports or when they are not exercising. This is closely related to social capital that is formed by interaction among individuals. Attempt in explaining the effect of social capital through sports has been made in the study by Hanifan (1916) that the term, social capital, was firstly emerged. In her study that emphasized the role of the local community for school education in suburbs, the role of the baseball league has been given priority as a core element to develop local social capital. The coach of the baseball team said, "They (these older boys) stayed in school not only to the end of the baseball season; they got a taste of books and have been regular in attendance to the end of the year. Some who had not been in school for over two years won their Free School Diplomas this year and are planning to go to high school next year?" (Hanifan, 1916: 137). In other words, she has explained how passion for sports activities was led to an interest in academic studies among adolescents.
“To build bridging social capital requires that we transcend our social and political and professional identities to connect with people unlike ourselves. This is why team sports provide good venues for social capital creation.” (Putnam, 2000: 411). As pointed out by Putnam, sports organizations are the carriers of sound social capital. In addition, Putnam (2002) has explained that the issue of how American society became 'atomized' was related to an increase in population who enjoyed bowling and also decrease in bowling club in the 『Bowling alone. Interaction among members in official group is a core element of social capital (Blackshaw & Long, 2005). The number of bowling clubs, generalized in American society, has been decreased. However, they pointed out that the number of participants has been increased while symbolically suggesting the dissolution of social interaction.
Social capital includes topics that social behaviors of individuals or groups, density of relationship, quantity, a sense of belonging, and bond. Therefore, it acts as the most fundamental basis for social integration (Jenson, 1998; Wooley, 1998). It is recognized as an important element for solving social inequality, crisis, conflict, and other important areas and components of social cohesion (Côté, 2005).
Social capital is relevant to investment about social relationship that expects the profit in the market (Lin, 2001). Bourdieu suggested that social capital is "the aggregate of the actual or potential resources which are linked to possession of a durable network of more or less institutionalized relationships of mutual acquaintance or recognition" (Bourdieu, 1985: 248). It also consists of "social obligations" ("connections") and, under certain conditions, may be converted into economic capital and institutionalized in the form of the title of the nobility." (Bourdieu, 1985: 243). Coleman defined social capital as a function. In his view, social capital has two kinds of characteristics in common: "They all consist of some aspect of social structure, and they facilitate certain actions of individuals who are within the structure" (Coleman, 1990: 302). Another scholar, Putnam said the social capital is "social organization such as networks, norms, and social trust that facilitate coordination and cooperation for mutual benefit" (Putnam, 1995: 67). There are different opinions on the function/component/level of capital depending on scholars. However, social capital is 'a form of capital that occurs in the group sharing specific goals.'
Social capital occurs in various levels including individuals, groups, and nations (Coleman, 1988; Forrest & Kerarns, 2001; Onyx & Bullen, 2000). Efforts in measuring and utilizing social capital have been made in various fields. However, there has not been an agreement due to multi-lateral and multi-faceted characteristics of definition and scale of social capital to be interpreted and applied by scholars in each field. Debate over the concept of social capital has still been repetitively suggested as much as the usability and utilization of it. The reason why discussion of social capital has been remained as to why it existed was because the attempt was made to identify the essence of social capital in terms of logistics of traditional capital, in other words; finance, or physical/human/environment factors.
An approach made on the essence of multi-lateral and multi-faceted social capital by finding appropriate components of the concept instead of directly clarifying the concept might be much better. However, different components are applied depending on the direction of usability for social capital. Therefore, social capital has been measured in various fields. However, it is still required to define conceptual components and expressive factors in the context of sports clubs. In addition, it is required to develop scale indices that reflect them.
Discussion about social capital is classified as individual and group level. In other words, it is classified into 'profit' and 'return.' First of all, functional perspective of regarding the result of social capital as 'profit' is a 'good will' that is represented by Coleman and Putnam (Adler & Kwon, 2002). They focus on functional aspects of social capital. However, scholars such as Bourdieu or Lin who focused on 'inequality' related to closed feature and exclusiveness of social relationships suggested how social capital might provide a negative role depending on the types of interactions among participants and also the types of group.
On the other hand, sports policies from the government before and after the 2000s have been promoting physical activities of citizens based on 'sports for all'. Government of the people started in the IMF economic crisis in 1998 has reduced the size of sports group for 'small government' but proceeded decentralization and private initiative of sports. 5-year national sports plans proceeded from 1998 to 2002 have established the environment for people to participate in sports for all, expanded sports facilities as a place for residents in communities to participate in physical activities, extended the program for 'sports for all' for non-participating population, and also diffused privately-led 'sports for all' (Sport white paper, 2010). Such a trend of policies has led to participatory government from the government of the people expanding resident-friendly sports space, systematically cultivating sports clubs, and operating various programs for expanding the participation in physical activities to improve quality of lives of citizens through promotion in sports for all.
The government led by former president Myung-bak Lee from 2008 has established/promoted local sports clubs, expanded facilities of 'sports for all', improved usability of them, and proceeded the expansion for leisure sports and space to enhance conditions of participation in physical activities. They have expanded the participation of sports for the handicapped, minor groups. In addition, they have developed volunteer activities. The government led by current president, Geun-hye Park, in 2013 has been supporting the improvement of environment including outstanding sports clubs and sports facilities in schoolyard to accomplish the vision, 'Happiness for Citizens, New Era of Hope.' They have been distributing the customized programs in each life-cycle, providing authentication policy for sports, physical strength of the citizens, and establishment of comprehensive sports clubs (Sport white paper, 2014)
Hereupon, policy keynote of government for the support of sports for all has been consistently maintained in spite of replacement of regime. Ministry of Culture, Sports, and Tourism has been operating classes of sports for all in each cities and dos as well as various programs of sports for all to 'provide an opportunity of participating in sports for all.' In addition, they have been promoting national sport event committee to promote and cultivate club and holding and operating sports club league policies. A wide range of policy projects are in progress. Participations in sports club provides a positive opportunity on exchange of information, cooperation, competition, community spirit, formation of communitarianism, and relationship based on the promotion of cooperative relationship with sport activities.
The purpose of this study is to review the concept of social capital and to construct social capital scale in sports club (below SCSSC) context. In the sports club context, the meaning, structure, and dimensions of social capital were examined to develop theoretically sound, statistically valid, and reliable scale.
Methods
An indicator is a scale instrument that is to measure a certain phenomenon. Composite indicator provides a way to understand the complex phenomenon (Fetscherin & Stephano, 2016). It provides a simple number for a complex phenomenon. The process of scale development denotes a careful and meticulous methodology for arriving at a scale. A scale must confirm reliability and validity.
Following the instructions by Churchill (1979) and other scale-development studies (Fetscherin & Stephano, 2016; Ridfler, Diamantopoulos, & Siguaw, 2012; Rossiter 2002), I conducted the qualitative research and the quantitative researches. To expend previous research on social capital measurement and to develop the social capital scale in sports club members, the premise for using scale development for this study was that, if social capital does exist in sports club, then it ought to be definable and measurable. After discussing the process of selecting the scale development for this study, this chapter describes the methodology of scale development and evaluation, as demonstrated in Figure 1.
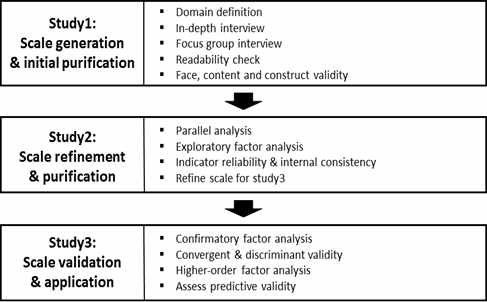
Scale development process
Study 1 carries out the scale generation and initial purification. Conducted literature review to set domain definition out, and then focus group interview for the initial item generation. Study 2 conducts the first scale refinement and purification with exploratory factor analysis. Confirm the content and face validity. Also, check the reliability and internal consistency of the indicators. Study 3 is the scale validation and application. Confirmatory factor analysis was conducted to confirm the dimensional structure of the sports club's social capital scale and to establish the effectiveness of convergent and discriminant validity. Higher-order factor analysis was conducted to confirm the number of second-order factor. And then, assess predictive validity.
Results
Study 1: item generation
In this study 1 was conducted two kinds of search for item generation. First, literature search specified the social capital scale concept appropriate for the sports club context. The composition factors of individual level were selected through precedent research on social capital, and factors suitable in the context of the sports club were used to form the scale index of this study. The social capital at an individual level is generally composed of three factors as the following: social trust, network, and reciprocal norms. Depending on the research purpose, trust is generally divided into three factors: interpersonal trust, intergroup trust, and governmental trust. Lastly, network is classified into horizontal network and vertical network while norms are composed of an individual’s sense of community, altruism, and tolerance. Table 1 and 2 provide details of the literature search. Second, qualitative search was conducted for extracting initial items. The interview was conducted on seven administrators and 4 target groups. A total of seven factors were deduced and the scale concept and sub factors are as follows:

Components of general context of social capital

Components of sports club context of social capital
First, details on trust included i) trust between the members; and ii) trust in the club itself. Sub factors included trust in the sports club members, trust regarding the athletic level of the sports club members, the trust culture within the sports club, mutual consideration between the members, etc., A total of 10 items on trust were selected including to measure trust including ‘trust regarding the members’, ‘trust regarding the athletic level’, and ‘trust regarding the management’.
Second, details on network included communication methods regarding interactions between sports club members or cooperation methods. Sub factors included club participation and structure, regular meetings, exchange with other clubs, etc., A total of 12 items were deduced to measure sports club networks including ‘communication methods’, ‘initiatives in club participation’, ‘exchange with other clubs’, etc.
Fourth, details on collective norms included language or behaviour patterns shared at the club. Sub factors included establishment of rules and decision making process. A total of 10 items were deduced to measure collective norms including ‘organization of club internal regulations’, ‘conformance to rules by the members’, ‘the club’s democratic problems solving methods’.
Third, details on reciprocity included intentions by the sports club participants in assisting each other while focusing on circularity of benefits and relevant details. Furthermore, the range was expanded to include mutual benefit between members, and profit sharing between members and random people. The sub factors included provision of information, sports related assistance, assistance in social life, etc. A total of 11 items were deduced to measure reciprocity including assistance in sports skills, assistance related to the sports, assistance expanded to social life, etc.
Fifth, details on sense of community included the intimacy felt by the club participants, mutual influence, affiliation, emotional ties, etc. Sub factors included affiliation, intimacy, emotional ties, pride towards the community, satisfaction of desires, etc. A total of 12 items were deduced to measure sense of community including ‘ties with the members’, ‘satisfaction of desires through sports participation’, ‘club values’, etc.
Sixth, details on social sorting included the club member’s income levels, social status, social ranking, and sub factors included sorting based on socioeconomic status, connections, or gender. A total of 12 items were deduced to measure social sorting in relation to club participation including ‘social sorting based on economic or social status’, ‘sorting based on specific locations or age’, ‘sorting based on athletic levels', etc.
Seventh, details of selective exclusion included exclusive relationships due to personal influencing relationships of the sports club participants. Sub factors included exclusion based on norms, discrimination based on an athletic level, rejection of excessive competitive spirit, etc. A total of 11 items were deduced to measure selective exclusion including ‘member sorting based on inclination differences', ‘partner selection based on athletic skill’, ‘rejection of excessive competitive spirit’, etc.
In order to develop objective and applicable social capital scale items in sports clubs, this study conducted two types of interviews to participants from diverse sports. Furthermore, a directed approach to content analysis was applied to objectively construct a relationship between the coding scheme and codes. For data diversification purposes, the transcribed data, research notes, debriefings of colleagues were applied to the research analysis. A total of 78 items were deduced. In order to secure objectivity, validity, reliability in the data analysis and result deduction process, the aforementioned procedures were applied.
Study 2: scale refinement & purification Sample size and analysis
All 78 items included in the survey. Survey items addressed demographic information and the sports club which participated in the seven dimensions of SCSSC. The data for this research was collected through an online survey specialist company. The subjects of the study were Korean people who have joined sports clubs and are actively participating. The metropolis which contains large populations of sports and sports club participation such as Seoul, Gyeonggi-do, Incheon, Daejeon, Daegu, and Busan was selected as samples (Sports white paper, 2014). Roughly 30 minutes were consumed for the survey, and incentives were not provided in relation to surveys which did not contain all information or contained incomplete information. Furthermore, multiple responses by the respondents were not permitted. Accordingly, out of 347 surveys which contained complete information without any missing data, 12 undependable surveys were excluded, resulting in 335 surveys to be used for analysis. Table 3 displays the demographic information of participants.

Demographic information (exploratory factor analysis)
This study which used the Likert scale constructed all items into 6 points. The Likert scale is a subject-centred rating method which measures the psychological ranking of positivity or negativity of the subjects. Accordingly, respondents have tendencies to avoid both extremes when the response category range is small and an odd number (Shin, 2000). Furthermore, the reliability of the differential does not increase any further if the response category number of an item exceeds 5 or 7 (Cicchetti, Showalter, & Tyrer, 1985). In order to check the validity of the research information, the content was reviewed by 1 sports administration professor, 5 sports management majors, and 3 sports sociology majors. Furthermore, the content was reviewed by 3 sports club administrators to confirm the face validity.
Factor analysis
SPSS 23.0 and Mplus 7.0 were used for the exploratory factor analysis. Maximum likelihood estimation was used for factor extraction while the direct oblimin out of the oblique rotation methods was applied for implementation. In order to confirm the appropriateness of the factor structure, eigenvalue, KMO (Kaiser-Meyer-Olkin Measure), and Bartlett’s test of sphericity were implemented. Standards for item selection were based on factor loadings of 0.40 or below and cross loadings of at least 0.30 (Pett, Lackey, & Sullivan, 2003). Lastly, the RMSEA value of each factor model was compared for statistical testing of the factor number.
Determining the factor number in the exploratory factor analysis is a very tricky procedure. However, the factor number must be predetermined for the appropriate extraction of factors. In the case of the scree plot, the researcher must subjectively make decisions if the bending point is unclear which can decrease the reliability of the factor number extracted, based on the sample size (Preacher, Zhang, Kim, & Mels, 2013). Accordingly, a parallel analysis was implemented for the appropriate extraction of the factor numbers (Fabrigar et al., 1999; Worthington & Whittaker, 2006). The Syntax editor of SPSS 23 was used to conduct the parallel analysis. The results of parallel analysis was reported in Table 4.

Results of parallel analysis
Purification by EFA
The exploratory factor analysis was conducted to assess whether the concept of scale of the sports club social capital is appropriately quantified based on scale. Maximum likelihood (ML) was used as the factor extraction method, and the direct oblique rotation method was used for analysis. The mean, standard deviation, common factor, factor loading of each factor resulting from the analysis are presented Table 5. 35 items were extracted out of the total 77 items based on the analysis results. The criteria in item selection is as the following: 1. Items with less communality at .3 or below (Briggs & MacCallum, 2003); 2. Items with factor loading at .40 or below; 3. Items with double loading at .30 and above (Pett, Lackey & Sullivan, 2003). Based on the criteria, a total of 35 items were deduced. Additionally, the KMO (Kaiser-Meyer-Olkin measure) and Bartlett’s test of sphericity was set .932 and χ²=8528.506 (p=.000) respectively, all reflected to be appropriate for the factor analysis. The extracted factors explained to be roughly 60% of the overall variables. The reliability of the 5 extracted factors exceeded Cronbach's α=.7, thereby securing the internal consistency of the items (Hair, Anderson, Tatham, & Black, 1998; Nunnally, 1978).

Exploratory factor analysis (pattern matrix)
Factors naming
The exploratory factor analysis resulted in a total of 5 factor structures. This shows a difference between the 7 factors of the qualitative research. In regards to the factor structure of the qualitative method, the researcher’s interpretation of items and directed approach of content analysis on the transcribed data was used to determine the initial coding scheme or relationship between the codes. Because the sub-concepts of social capital are deeply correlated, a flexible selection within social capital is necessary. Ultimately it must be reduced to five factors. The factor name regarding the five factors was selected based on the item within each factor.
Factor 1 was designated as ‘trust'. This factor consists of trust regarding the athletic level of the members. This is because the sports club participants’ goals are sports activities or have the relative sport as their common interest. Items of factor 2 are related to participation level of official and non-official meetings in the sports club. The sports club members form social relationships within the sports club. Factor 3 includes sports club norms, systematic communication, mutual respect between the members, etc. Accordingly, this factor was designated as ‘reciprocal norms'. There is a high possibility that this factor involves positivity regarding the sports club operation and mutual respect between the Management and the members. Factor 4 is ‘social sorting'. This factor includes cognitive sorting based on athletic level, economic level, gender, and age, etc., in relation to sports club participation. Factor 5 which is designated as ‘selective exclusion’ includes items such as intimacy and sports participation between members with common inclinations. This is related to the cognitive element of exclusion based on inclinations or personalities within the relationships of sports club members.
Study 3: Scale Validation Sample size and analysis
In order to test the appropriateness of the factor structure of social capital scale in sports clubs, a confirmatory factor analysis and validity analysis was implemented. 35 purified items were included in the research through the exploratory factor analysis on the items related to demographic characteristics and sports club participation. A confirmatory factor analysis was implemented on a total of 343 people who had joined sports clubs and were actively participating. Similar to the previous survey, data was collected through an online survey specialist institution, and excluding the subjects who participated in the 1st survey, a total of 343 data was secured. Table 6 provides a description of the demographic information of participants. Take less than 10 minutes to fill in the survey. After excluding 30 undependable responses, a confirmatory factor analysis was implemented on the 313 data.

Demographic information (exploratory factor analysis)
N=313
In order to confirm the 5 factor structure, the confirmatory factor analysis was implemented using the Mplus 7.0. In addition to confirming the 5 factor structure of the 35 items, an item purification process was implemented for simplification purposes. Through the hierarchical secondary model, it was compared whether the 5 sub factors corresponded to 1 parent factor or two parent factors.
Furthermore, a correlation analysis was implemented to check the relationship between the sub factors and the unidimensional scale test on the items. The Cronbach' α value was calculated for the overall result and for each sub factor to implement the reliability test. Additionally, a standardized estimation, concept reliability (C.R.), and average variance extracted (AVE) was calculated to check the convergent validity and discriminant validity. Lastly, in order to evaluate the predictive validity, the satisfaction with life scale (SWLS) was set as the dependent variable to test the causal relationship.
Factor analysis
After implementing the analysis, items with high error variance in regards to individual items and for simplicity purposes, items in relation to networks, reciprocal norms, social sorting which had low factor loadings were deleted sequentially. The error variance of the 4th item under social sorting (I am from a former district or school) and item 5 (I work or am engaged in a special workplace or occupation) reflected to be 1.417 and 1.519 respectively and were deleted accordingly. The total purified 19 items consisted of 3 items under trust, 5 items under network, 5 items under reciprocal norms, 3 items under social sorting, and 3 items under selective exclusion.
A confirmatory factor analysis was implemented on the purified 19 items and results overall satisfied the goodness-of-fit model. Specifically, the CFI, TLI, and RMSEA resulted in .939, .926, and .074(90% CI .065-.083) respectively, satisfying the goodness-of-fit (Hooper, Coughlan & R. Mullen, 2008). The SRMR value of .056 also satisfied the standard presented by Hu and Bentler (1999) of .08 or less. The Cronbach's α value of each factor all resulted in .8 or above, thereby securing reliability. In line with Kline (2011)’s proposal, the non-standardized estimate, standard error, and standardized estimate are presented in Table 7 and Figure 2.

The results of CFA

CFA diagram tru-Trust, net-Network, rec-Reciprocal norms, sor-Social sorting, exc-Selective exclusion
In order to test the convergent validity and discriminant validity of each factor, a correlation coefficient with the factor estimate, concept reliability, and AVE was calculated. Kline (2011) stated the following: i) convergent validity would be secured if the factor estimate was .7 or above and ii) discriminant validity would be secured if the covariance between the factors was .9 or below. The standardized estimate of the 2nd item of reciprocal norms was slightly below the criteria at .682. However, the covariance between the factors all satisfied the criteria. Although the 2nd item of reciprocal norms fell slightly below Kline’s criteria, it exceeded the criteria presented by Fornell and Lacker(1981) of C.R. at 0.7 and above and AVE at 0.5 and above.
Higher-order factor analysis
In order to verify the higher-order factor, one secondary factor and at least three primary factor is needed (Kim, 2016). Accordingly, the higher-order factor in this study was verified because the sub factors of social capital in sports clubs consisted of 5 primary factors. Furthermore, the secondary factor model was satisfied as there was hardly any difference in the model fit of the CFA and higher-order factor. This suggests that the 5 factors extracted through the exploratory factor analysis can be well explained by the social capital in sports clubs. The detailed goodness-of-fit index for comparison purposes is presented in Table 8.

Model fit of CFA & HFA
After verifying the higher-order factor model, we checked to assess whether sports club social capital could be classified into positive factors of trust, network, reciprocal norms, and negative factors of social sorting and selective exclusion. The left of Figure 3 reflects the model with one secondary factor and two secondary factors. Results of measuring the higher-order model which had two secondary factors showed that there were no differences in goodness-of-fit index. However, the standard loading dose of emotional factors reflected to be .299 while the correlation coefficient between the above factors reflected to be 1.030. Also, compared to each estimation of χ², there is no significance difference (the threshold value is df 1△, χ² = 3.84). Accordingly, results showed that social capital of sports clubs was a single factor which could not be divided into positivity and negativity.
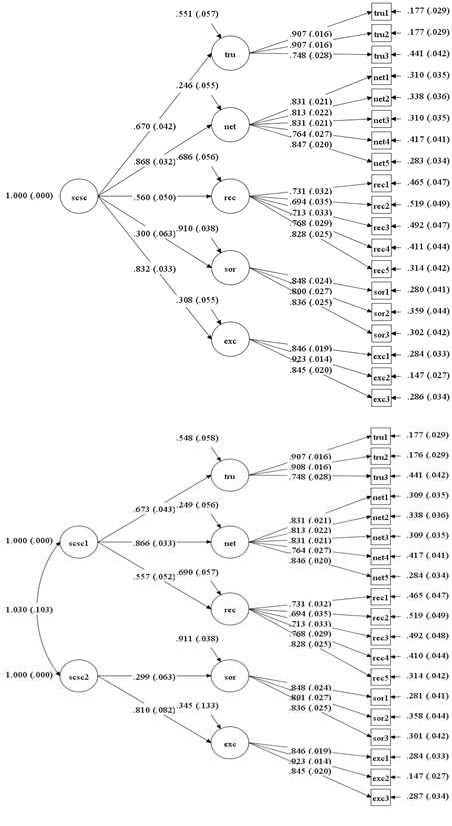
Higher-order factor diagram scsc- SCSSC, tru-Trust, net-Network, rec-Reciprocal norms, sor-Social sorting, exc-Selective exclusion
Assess predictive validity
After retesting the social capital scale items in sports clubs, satisfaction of life which is a dependent variable of social capital in various theories and empirical studies was selected as the dependent variable to verify the predictive validity (Evans & Kelly, 2004; Helliwell, 2003; Konow & Earley, 1999; Shin & Choi, 2010). Accordingly, a factor analysis and hypothesis testing was implemented. Diener et al. (1985)’s SWLS 5 items were used for the dependent variable, satisfaction of life. The items which were in English were translated through two people who were familiar with both English and Korea to secure reliability. One person translated English into Korean whereas the other person translated Korean into English. The two translations were compared to the original items.
Results of the hypothesis testing for the predictive validity analysis showed goodness-of-fit at satisfactory levels as per Table 9. Furthermore, hypothesis testing showed i) there was significant influence on satisfaction of life of social capital in sports clubs with path coefficient at .579; and ii) it was able to explain 33% of the variant (Table 10, Figure 4). Such results suggest that there is a higher possibility that satisfaction of life of the participants will increase if the social capital in sports is high. Accordingly, it can be determined that the 5 composition factors related to social capital in sports clubs and scale items can sufficiently explain the parent variable of social capital in sports clubs.

Model fit of predictive validity

Predictive validity

Predictive validity diagram
Discussion
Like other social science theories, social capital is also abstract and includes various levels and sub factors which makes scale difficult. Paradoxically, the difficulty of scale leads to objective scale requirements. Álvarez and Romaní (2017) analyzed preceding researches related to measurement of social capital and proposed mechanism and measurement approaches according to the intended level of measuring social capital. The studies of Lochner, Kawachi, and Kennedy (1999) propose collective efficacy, psychological sense of community, neighbourhood cohesion and community competence as subordinate variables, based on social capital theory of Putnam, making a suggestion of a method of uniting the individual-level response to the community-level response. Fandiño, Marques, Menezes, and Bentes's (2015) study, which developed a social capital measure for Portuguese workers, consists of three dimensions (cognition, structure, and relationship) of Nahapiet and Ghosal. Takakura, Hamabata, Ueji, and Kurihara (2014) developed social capital scale for high school student.
The study of social capital scale in sports in Korea is Kim's (2006) research. He developed a social capital scale based on sports participants and called it SCSPS (social capital scale in participant sports). This research is significant in that it was one of the first papers to reflect the development of social capital scale on sports participants which had not been implemented in the sports participation. Despite of the distribution, his research contains the following limitations: First, the subject is unclear. The subject of study in his research is all sports participants. Social capital is established by the people who are affiliated in or form a group. Accordingly, the target should be subjects which can reflect the characteristics of a group. Second, it borrows the scale used in preceding national/international studies during the process of selecting initial items. The preceding studies on scale development propose that open-ended interviews be conducted to confirm the language and experience used by the targets subject to scale (Netemeyer et al., 1995; Rossiter, 2002). However, his research verifies and measures only the content validity of the scale of preceding studies. Third involves problems associated with the estimates due to the lack of cases (only 98 data were used for factor analysis). At least 150 cases are needed to implement the confirmatory factor analysis (Anderson & Gerbing, 1988; Holbert & Stephenson, 2002). Furthermore, studies by Chou and Bentler (2002) state that at least 200 data need to be secured to obtain accurate estimates. Fourth, the EFA and CFA were verified using a single research data. It is a factor analysis which needs to include more theoretical limitations as the same data was used to compare the CFA and EFA. In other words, it’s a process which verifies the scale based on a theoretical model. The scale developer must establish a theoretical model through the data collected from the EFA and secure CFA data in line with that model.
The differences between this research and Kim’s (2006) research are as follows: i) this study restricted the subject of scale development in a physical and spatial environment called sports clubs; and ii) the language and experience of the measuring subject was presented through in-depth interviews and target group interviews; and iii) from each of the EFA and CFA, data from at least 300 people was obtained and verified; and iv) statistically appropriate items were deleted to present results.
Conclusions
This research was aimed at developing social capital scale in sports club which reflects the characteristics of Korean sports clubs. This study was conducted by literature research, qualitative research, and quantitative research for the systematic scale development procedure. Specific development procedures and results are as follows.
First of all, seven factors constitute social capital of sports club as follows; trust, network, reciprocity, norms, sense of community, social sorting, and selective exclusion. Results derived from the literature review were employed to configure the initial coding framework of content analysis. The results of the qualitative research were used to select and refine the first item.
The exploratory factor analysis was performed on 7 factors with 78 items. In order to determine the number of factors, a scree plot, a parallel analysis, and a 3 to 5 factor model were compared and a 5 factor model was selected. They were named as trust, networks, reciprocity norms, social sorting, and selective exclusion. It was purified with a total of 35 questions.
Confirmatory factor analysis, high-order factor analysis, and predictive validity were conducted to confirm and apply SCSSC. As a result of confirmatory factor analysis, the final 19 items were selected, and a high - order factor analysis revealed one secondary factor structure. The result of predictive validity, the scale developed in this study proved to be statistically significant with SWLS.
The objective and systematic scale deduced from this research hold important significance in that is was able to overcome the limitations in existing scales and is applicable to sports club participants. The significance of this scale can be explained in more detail as the following.
First, methodological contribution is the development of scale from the perspective of sports club members. Renowned social capital theorists such as Hanifan (1916), Putnam (2000), and Broudieu (2011) state the importance of sports clubs in the formation and development of social capital. Such are reflected by the active studies which have been conducted on social capital in sports clubs, both nationally and internationally. Despite such importance, discovering a social capital scale specific to sports clubs is not easy.
The majority of social capital studies on sports clubs have been implemented based on qualitative research methods, and such qualitative studies hold great significance in being able to verify the usefulness of social capital formed in sports clubs and its diverse sub factors (Kim et al., 2012). However, compared to the number of qualitative studies on social capital in sports clubs, quantitative research is relatively difficult to find. From a sports club perspective, studies which have applied social capital as the cause variable or dependent variable have omitted to perform objective validity test procedures on tools and have therefore borrowed tools in other fields (Park, Seo, & Chae, 2014; Hong, Won, & Ko, 2011).
Social capital is a multi-level, multidimensional concept in which connections with the research field must be taken into consideration. (Hong et al., 2007; Hong, 2007). From a sports club perspective, data related to sports participation or sports level is a unique domain of social capital in sports clubs (Tonts, 2005). In this regards, through interviews with people who are participating in or have experience in operating sports clubs, this study developed items based on the language directly used by these participants. The scale developed in this research from the perspective of sports club participants will provide basic data in evaluating social capital of sports clubs.
Second, theoretically, this study attempted at a balanced scale of social capital by presenting social sorting and selective exclusion based on the exclusivity of social capital as scale factors. As a multiple concept, social capital incorporates both positive as well as negative factors. The existing social capital scales were measured by focusing on the productivity or effectiveness of social capital (Narayan & Cassidy, 2001; Onyx & Bullen, 2000). The contribution of these studies is of great importance from the perspective that they have presented social capital as the main domain of community research. However, social capital theorists who put Portes (1998) or Lin (2001), etc., as the leading figures state exclusivity, limitation of freedom following closed relationships and excessive requests regarding members as adverse effects of social capital. Woolcock (1999) classified social capital in groups into bonding, bridging, and linking based on the level of closure of the groups and also stated the necessity for management of the adverse effects (Woolcock & Narayan, 2000).
This study applied a cognitive and structural perspective on the exclusive factors arising in sports clubs. The cognitive perspective refers to the mutually exclusive factor which arises between members within sports clubs whereas structural perspective refers to the socioeconomic factors which act as barriers to entry in the selection of sports clubs. Accordingly, the study holds the second significance in that by exploring both positive and negative factors which have reflected the characteristics of sports clubs, it was able to establish a more balanced scale.
The practical contribution is as follow. It provides a tool to policy makers in the local government in determining sports clubs which provide high contribution to the local society. In relation to the public sports club business initiated from 2006, the government has been proceeding business which unite and develop member clubs in local governments. Its attempt was to enable public sports clubs to perform a central role in the local society as a method to modernize sports for all (Ministry of Culture, Sports, and Tourism, 2014). Such requires the input of massive financial, physical, and human resources. Verifying the developmental directions and effectiveness of the public sports club under such circumstances is an essential stage in determining the form and range of resource input. From this perspective, the scale of social capital in sports clubs will contribute to enhancing the effectiveness of resource input.
Acknowledgements
This work is a summary of an author’s doctoral dissertation.
References
Adler, P. S., & Kwon, S. W. (2002). Social capital: Prospects for a new concept. Academy of Management Review, 27(1), 17-40.
10.5465/amr.2002.5922314.Álvarez, E. C., & Romaní, J. R. (2017). Measuring social capital: further insights. Gaceta Sanitaria, 31(1), 57-61.
10.1016/j.gaceta.2016.09.002.Anderson, J. C., & Gerbing, D. W. (1988). Structural equation modeling in practice: A review and recommended two-step approach. Psychological Bulletin, 103(3), 411-423.
10.1037/0033-2909.103.3.411.Blackshaw, T., & Long, J. (2005). What’s the big idea? A critical exploration of the concept of social capital and its incorporation into leisure policy discourse. Leisure Studies, 24(3), 239-258.
10.1080/0261436052000327285.Bourdieu, P. (1983). The field of cultural production, or: The economic world reversed. Poetics, 12(4-5), 311-356.
10.1016/0304-422X(83)90012-8.Briggs, N. E., & MacCallum, R. C. (2003). Recovery of weak common factors by maximum likelihood and ordinary least squares estimation. Multivariate Behavioral Research, 38(1), 25-56.
10.1207/S15327906MBR3801_2.Bourdieu, P. (2011). "The forms of capital (1986)". Cultural theory: An anthology, 81-93.
Chou, C., & Bentler, P. M. (2002). Model modification in structural equation modeling by imposing constraints. Computational Statistics and Data Analysis, 41(2), 271-287.
10.1016/S0167-9473(02)00097-X.Churchill Jr, G. A. (1979). A paradigm for developing better measures of marketing constructs. Journal of Marketing Research, 64-73.
10.1177/002224377901600110.Cicchetti, D., Showalter, D., & Tyrer P. J. (1985). The effect of number of rating scale categories on levels of inter-rater reliability: a Monte-Carlo investigation. Applied Psychological Measurement, 9, 31-36.
10.1177/014662168500900103.Coleman, J. S. (1988). Social capital in the creation of human capital. American Journal of Sociology, S95-S120.
10.1086/228943.Coleman, J. S. (1990). Rational action, social networks, and the emergence of norms. Structures of Power and Constraint, 91-112.
Côté, J. E. (2005). Identity capital, social capital and the wider benefits of learning: generating resources facilitative of social cohesion. London Review of Education, 3(3), 221-237.
10.1080/14748460500372382.Diener, E. D., Emmons, R. A., Larsen, R. J., & Griffin, S. (1985). The satisfaction with life scale. Journal of Personality Assessment, 49(1), 71-75.
10.1207/s15327752jpa4901_13.Evans, M. D. R., & Kelley, J. (2004). Effect of family structure on life satisfaction: Australian evidence. Social Indicators Research, 69(3), 303-349.
10.1007/s11205-004-5578-9.Fabrigar, L. R., Wegener, D. T., MacCallum, R. C., & Strahan, E. J. (1999). Evaluating the use of exploratory factor analysis in psychological research. Psychological Methods, 4(3), 272.
10.1037/1082-989X.4.3.272.Fandiño, A., Marques, C., Menezes, R., & Bentes, S. R. (2015). Organizational social capital Scale based on Nahapiet and Ghosal model: development and validation. Review of Contemporary Business Research, 4(2), 25-38.
10.15640/rcbr.v4n2a3.Fetscherin, M., & Stephano, R. M. (2016). The medical tourism index: Scale development and validation. Tourism Management, 52, 539-556.
10.1016/j.tourman.2015.08.010.Fornell, C., & Larcker, D. F. (1981). Structural equation models with unobservable variables and measurement error: Algebra and statistics. Journal of Marketing Research, 382-388.
10.1177/002224378101800313.Forrest, R., & Kearns, A. (2001). Social cohesion, social capital and the neighborhood. Urban Studies, 38(12), 2125-2143.
10.1080/00420980120087081.Hair, J. F., Black, W. C., Babin, B. J., Anderson, R. E., & Tatham, R. L. (1998). Multivariate Data Analysis (5th ed) Upper Saddle River.
Hanifan, L. J. (1916). The rural school community center. The Annals of the American Academy of Political and Social Science, 67, 130-138.
10.1177/000271621606700118.Helliwell, J. F. (2003). How's life? Combining individual and national variables to explain subjective well-being. Economic Modelling, 20(2), 331-360.
10.1016/S0264-9993(02)00057-3.Holbert, R. L., & Stephenson, M. T. (2002). Structural equation modeling in the communication sciences, 1995–2000. Human Communication Research, 28(4), 531-551.
10.1093/hcr/28.4.531.Hong, Y. R., Kim, T. J., Hyun, Y. S., So, J. K., & Lee, S. H. (2007). The Study on Development of Indicators and Measurement for Social Capital. Korean Educational Development Institute.
Hong, S. H. (2007). Theory and application of structural equation model. Seoul: Department of social welfare, Yonsei University.
Hong, J. W., Won, Y. S., & Ko, D. S. (2011). The Relationship of Participation Satisfaction and Intentions of Persistent Participation on the Social Capital of Participants in the Youth Sports club. Korean Journal of Sociology of Sport, 24(3), 109-136.
10.22173/jksss.2011.24.3.109.Hooper, D., Coughlan, J., & Mullen, M. (2008). Structural equation modelling: Guidelines for determining model fit. Articles, 2.
Hu, L. T., & Bentler, P. M. (1999). Cutoff criteria for fit indexes in covariance structure analysis: Conventional criteria versus new alternatives. Structural Equation Modeling: A Multidisciplinary Journal, 6(1), 1-55.
10.1080/10705519909540118.Jenson, J. (1998). Mapping social cohesion: The state of Canadian research. Ottawa: Family Network, CPRN.
Kim, J. K., Park, D. H., Sasaki, M., & Jung, S. O. (2012). Effects of Participation in Sports for All on the Formation of Social Capital. Knowledge Management Research, 13(4), 1-12.
10.15813/kmr.2012.13.4.001.Kim, S. Y. (2016). Fundamentals and extensions of structural equation modeling. Seoul: Hakjisa.
Kim, M. J. (2006). Social capital scale development of sports participants. Proceedings of the Korea contents association conference, 4(2), 124-128.
Kline, R. B. (2011). Convergence of structural equation modeling and multilevel modeling. In Williams, M., & Vogt, W. P. The SAGE handbook of innovation in social research methods (pp. 562-589). London: SAGE.
10.4135/9781446268261.n31.Kline, R. B. (2015). Principles and practice of structural equation modeling (3rd ed.). Newyork, NY: The Guilford Press.
Konow, J. and Earley, J. (1999). The Hedonistic Paradox: Is Homo-Economicus Happier?. mimeo, Loyola Marymount University, Department of Psychology.
Lin, N. (2001). Social capital: A theory of social structure and action. Cambridge university press.
10.1017/CBO9780511815447.Lochner, K., Kawachi, I., & Kennedy, B. P. (1999). Social capital: a guide to its measurement. Health & place, 5(4), 259-270.
10.1016/S1353-8292(99)00016-7.Nahapiet, J., & Ghoshal, S. (1998). Social capital, intellectual capital, and the organizational advantage. Academy of Management Review, 23(2), 242-266.
10.5465/amr.1998.533225.Narayan, D., & Cassidy, M. F. (2001). A dimensional approach to measuring social capital: development and validation of a social capital inventory. Current Sociology, 49(2), 59-102.
10.1177/0011392101049002006.Netemeyer, R. G., Burton, S., & Lichtenstein, D. R. (1995). Trait aspects of vanity: Measurement and relevance to consumer behavior. Journal of Consumer Research, 21(4), 612-626.
10.1086/209422.Nunnally, J. (1978). Psychometric theory. NY: McGraw-Hill.
Onyx, J., & Bullen, P. (2000). Measuring social capital in five communities. The Journal of Applied Behavioral Science, 36(1), 23-42.
10.1177/0021886300361002.Park, H. W., Seo, J. U., & Chae, J. S. (2014). The relationship between sprot activity participants and social capital. Journal of Sport and Leisure Studies, 56(1), 95-104.
Pett, M. A., Lackey, N. R., & Sullivan, J. J. (2003). Making sense of factor analysis: The use of factor analysis for instrument development in health care research. Sage.
10.4135/9781412984898.Portes, A. (1998) "Social Capital: Its Origins and Applications in Modern Sociology". Annual Review of Sociology, 24(1): 1-24.
10.1146/annurev.soc.24.1.1.Preacher, K. J., Zhang, G., Kim, C., & Mels, G. (2013). Choosing the optimal number of factors in exploratory factor analysis: A model selection perspective. Multivariate Behavioral Research, 48(1), 28-56.
10.1080/00273171.2012.710386.Putnam, R. D. (2000). Bowling Alone: The collapse and revival of American community. NY: Simon & Schuster.
10.1145/358916.361990.Putnam, R. D. (2002). Bowling together. The American Prospect, 13(3), 20-22.
Putnam, R. D. (1995). Bowling alone: America's declining social capital. Journal of Democracy, 6(1), 65-78.
10.1353/jod.1995.0002.Riefler, P., Diamantopoulos, A., & Siguaw, J. (2012). Cosmopolitan consumers as a target group for segmentation. Journal of International Business Studies, 43(3), 285-305.
10.1057/jibs.2011.51.Rossiter, J. R. (2002). The C-OAR-SE procedure for scale development in marketing. International Journal of Research in Marketing, 19(4), 305-335.
10.1016/S0167-8116(02)00097-6.Shin, S. S., & Choi, S. I. (2010). The Relationship between Elderly Leisure Activities, Social Capital, and Life Satisfaction. Hotel and Tourism Research, 12(3), 173-189.
Shin, D. (2000). Curriculum and assessment. Paju: Kyoyookbook.
Ministry of culture, sport and tourism (2010). 2010 Sport white paper.
Ministry of culture, sport and tourism (2014). 2014 Sport white paper.
Takakura, M., Hamabata, Y., Ueji, M., & Kurihara, A. (2014). Measurement of social capital at school and neighborhood among young people. School Health, 10, 1-8.
Tonts, M. (2005). Competitive sport and social capital in rural Australia. Journal of Rural Studies, 21(2), 137-149.
10.1016/j.jrurstud.2005.03.001.Woolcock, M., & Narayan, D. (2000). Social capital: Implications for development theory, research, and policy. The World Bank Research Observer, 15(2), 225-249.
10.1093/wbro/15.2.225.Woolcock, M. (1999). Managing risk, shocks, and opportunity in developing economies: the role of social capital. Development Research Group, The World Bank, unpublished paper, 1(05), 01.
Woolley, F. (1998). “Social cohesion and voluntary activity: Making connections”. Center for the Study of Living Standards (CSLS), Conference: The State of Living Standards and the Quality of Life”. October 30-31, 1998. Ottawa, Ontario: Canada.
Worthington, R. L., & Whittaker, T. A. (2006). Scale development research: A content analysis and recommendations for best practices. The Counseling Psychologist, 34(6), 806-838.
10.1177/0011000006288127.