Effects of 12 weeks competitive phase specific training on selected biochemical and haematological parameters of male Taekwondo players
Article information
Abstract
The aim of the present study was to find out the effects of 12 weeks of competitive phase specific training on basal levels of selected biochemical and haematological variables in male Taekwondo players. A total of 15 Indian male Taekwondo players (Age: 16.9±1.4 years; Height: 173.5±0.81 cm; Weight: 60.92±11.79 kg, BMI: 20.04±2.44 kg/m2) were volunteered for this study. Twelve weeks of competitive phase specific Taekwondo training was given to the participants for the perfection of technical skills and for the improvement of general physical conditioning abilities. Blood samples were collected from antecubital vein in the morning after overnight fasting and 24 hours of rest, both before and after training. The samples were analyzed for the selected biochemical and haematological parameters such as Lipid profile, Iron Profile, Creatine phosphokinase (CPK) Lactate dehydrogenase (LDH) and Complete Blood Picture (CBP). Data were analyzed by paired-t test by using SPSS software. A significant increase (P<0.05) of Serum Iron, Total cholesterol, HDL-cholesterol, Hematocrit, and Mean Corpuscular Volume were observed after training. Also a significant reduction (P<0.05) in total cholesterol/HDL-cholesterol Ratio, Lactate Dehydrogenase and Mean Corpuscular Hemoglobin Concentration (MCHC) were noted after the training. From this study it is concluded that the competitive phase specific Taekwondo training is effective for improving lipid profile and some of the biochemical parameters in national level male Taekwondo players and biochemical monitoring will be helpful for the evaluation of training effects and training related adaptations at molecular level.
Introduction
Taekwondo is a quick and explosive sport that needs fast and powerful offensive and defensive skills to score over an opponent effectively. A successful performance in such a physically demanding sport requires a well-conditioned and well-trained program, aimed at improving aerobic and anaerobic capacity, speed, muscle strength, recovery and neuromuscular coordination during the training course. Taekwondo develops posture, graceful movement, balance, coordination, flexibility, attentiveness and self-confidence (Fong et al., 2013). Taekwondo is also an excellent form of cardiovascular exercise. Physiological responses that occur during the regular Taekwondo training protocol will differ greatly from that of the championship Taekwondo combat (Bridge C A et al., 2013), this discrepancy is due to the less stress hormone responses (adrenaline and noradrenaline) during the regular training protocol compared to the championship combat. So to prepare the athlete to handle the metabolic and physiologic demands of the combat, Taekwondo coaches will emphasize high-intensity specific Taekwondo techniques interspersed with 6 seconds of low-to moderate-intensity movements and interval training sessions with 8 seconds of high-intensity efforts and 8 seconds of rest or low-intensity efforts. Coaches also use specific training with various Taekwondo skills to improve anaerobic training. Monitoring of athlete wellbeing is very essential during the Taekwondo training to understand the training responses and to detect any progression towards the negative health outcomes and associated poor performance if any. Excessive training with insufficient recovery can lead to overtraining in which performance and well being can be affected for months. Exhaustive exercise training given to the athletes during the competitive phase might cause oxidative stress associated with inflammatory responses, which in turn may result in muscle cell membrane damage. Elevated levels of creatine phosphokinase (CPK) and lactate dehydrogenase (LDH) have been used as markers of muscle damage in athletes performing heavy training. Some authors have suggested that the concentration of nitrogenous wastes such as urea and uric acid in the blood plasma may provide a measure of muscle protein breakdown and hence may be considered as markers of overtraining (Kinderman, 1986). On the other hand blood leukocyte subset counts also provide valuable information about the training load and recovery balance in athletes (Michael Gleeson, 2002). Neutrophil/Lymphocyte ratio (NLR) is used as one of the measure to monitor exercise stress and subsequent recovery (Nieman, 1998). Iron profile and RBC indices values will help to diagnose anemia and to understand the cause of anemia. So biochemical and haematological monitoring is not only important to understand the training induced adaptations, training load and recovery, it also provides an information about the health and nutritional status of the athletes. Several research studies have revealed that the resting levels of biochemical parameters in athletes varies from that of sedentary persons and are influenced by the type of exercise performed and its duration (Telford, R. D., Cunningham, R.B. 1991). Biochemical assessment would pave the way for designing an optimal training load as well as to verify the effectiveness of training programs and to optimize performance in sports. Most of the studies done on Taekwondo players are pertained to the physiological changes and lactate responses after the training, no studies were found where the biochemical parameters viz., metabolites, lipid profile and muscle enzymes were studied in Taekwondo players during competitive phase specific training. The aim of the present investigation was to assess the effects of 12 weeks of competitive phase specific Taekwondo training on basal levels of selected biochemical and haematological markers, and to understand the training induced biochemical adaptations.
Material and methods
Participants
15 male Taekwondo practitioners aged 16.9 ± 1.4 years with 3.3 ± 2.8 years of Taekwondo training experience, participating in national level competitions were recruited for this study from Sports Authority of India, Bangalore. All the athletes undertook 5-10 training sessions per week and exercised 1-2 hours per training session. The details regarding the health status, history of muscle injuries, hospitalization, medication and supplementary usage were obtained through the questionnaires. The study was approved by the institutional ethical committee and written informed consent was obtained from all the participants.
Training
Training programme comprised of two components namely Physical conditioning, Technical & Tactical training.
Physical conditioning
Physical conditioning was planned in the morning session (6.00 am to 7.30 am) and various exercises were given to meet the different conditioning abilities required for Taekwondo, such as strength, endurance, flexibility, speed, agility and so on.
This included-
1. Strength building phase
2. Lactic Power Phase
3. Taper
Technical & tactical training
Technical & tactical training was scheduled in the evening from 4.00 pm to 6.00 pm. This training mainly focused on kicking skills, punching skills, distance, timing training, attacking, counterattacking and scoring.
The typical Taekwondo training session used in this investigation consisted of:
(a) 15-20 minute warm up period during which non-Taekwondo activities (flexibility exercises, calisthenics, running etc) were performed to prepare for the higher intensity activities;
(b) After the warm up 25-30 minute of fundamental Taekwondo techniques (basic kicks & blocking etc) were performed and repeated with a gradual increase in intensity;
(c) 10-15 minute cool down period, during which activities were performed to gradually reduce the heart rate to the levels reached at the end of the warm up period.
Specimen collection and assay
Blood samples were collected before and after competitive phase specific Taekwondo training having duration of 3 months. Samples were collected from the participants in seated position from antecubital vein into plain evacuated tubes in the morning in overnight fasting condition. All participants were refrained from training 24 hours prior to the test to avoid acute exercise-induced shifts in plasma volume. An aliquot of each sample was immediately mixed with EDTA solution to prevent clotting for haematology. The rest of the sample was left to coagulate at room temperature for 30 minutes and centrifuged at 1500 g for 10 minutes to separate the serum which was analysed for selected biochemical parameters such as triglycerides (mg.dl-1), total cholesterol (mg.dl-1), HDL-cholesterol (mg.dl-1), LDL-cholesterol (mg.dl-1), CPK (U/L), LDH (U/L), urea (mg.dl-1), uric acid (mg.dl-1), serum iron (µg.dl-1), total iron binding capacity-TIBC (µg.dl-1), transferrin saturation (%).
Measurement of biochemical variables
Blood Urea
Urea concentration was estimated by using (Spinreact) Berthelot method -where in urea in the sample is hydrolyzed enzymatically by Urease into ammonia (NH4 +) and carbon dioxide (CO2). Thereafter Ammonia ions formed react with salicylate and hypochlorite (NaClO), in the presence of catalyst nitroprusside, to form a green indophenol: The intensity of the colour formed is proportional to the Urea concentration in the sample and the optical density of the same was measured at 580nm and Urea concentration expressed in mg.dl-1.
Uric acid estimation
Uric acid concentration was estimated by using enzymatic method (Spinreact) in which uric acid is oxidized by uricase to allantoine and hydrogen peroxide (2H2O2), and under the influence of POD, 4-aminophenazone (4-AP) and 2-4 dicholrophenol sulfonate (DCPS) forms a red quinoneimine compound.
The intensity of the red colour formed is proportional to the uric acid concentration in the sample and was read at 520nm and concentration expressed in mg.dl-1.
Serum Iron
Iron concentration was estimated calorimetrically by Ferrozine method (Spinreact). The Iron is dissociated from transferring – iron complex in weakly acid medium. Iron liberated was reduced into the bivalent form by means of ascorbic acid. Ferrous ions give with ferrozine a coloured complex. The intensity of the colour formed is directly proportional to the iron concentration in the sample. The optical density (OD) was measured at 562nm and the concentration expressed as µg.dl-1.
Total Iron Binding Capacity (TIBC) & Unsaturated Iron Binding Capacity (UIBC)
TIBC was estimated calorimetrically by using Saturation – Precipitation method (spinreact). Serum transferrin is saturated with excess of Fe3+ and the unbound portion is precipitated with magnesium carbonate. The total amount of iron (TIBC) is then determined by using Ferrozine method. The difference between the TIBC and initial serum iron yields the unsaturated iron binding capacity (UIBC) and both the values were expressed as µg.dl-1.
Transferrin Saturation (TS %)
Transferrin saturation is calculated from Serum iron and TIBC values by using the standard equation.
Triglycerides
Triglyceride Concentration was estimated calorimetrically by using GOD-POD method (Spinreact). Serum triglycerides incubated with lipoprotein lipase (LPL), liberate glycerol and free fatty acid. Glycerol is converted to glycerol-3 phosphate (G3P) and adenosine -5-diphosphate (ADP) by glycerol kinase and ATP. Glycerol -3- phosphate is then converted to dihydroxyacetone phosphate (DAP) and hydrogen peroxide (H2O2) by glycerol phosphate dehydrogenase. H2O2 reacts with 4-aminophenazone and p-chlorophenol in presence of peroxidase (POD) to give a red coloured dye. The optical density (OD) was measured at 505nm and the concentration is expressed as mg.dl-1.
Total cholesterol (TC) and High density lipoprotein cholesterol (HDL-C)
Cholesterol esters liberate cholesterol and fatty acids; by the action of the cholesterol esterase (CHE). The cholesterol present in the sample is converted to 4-cholestenona and hydrogen peroxide (H2O2). H2O2 reacts with 4-aminophenazone and Phenol in presence of peroxidase (POD) to give a coloured product.
To estimate HDL-C, Chylomicrons, LDL and VLDL are precipitated from serum by adding phosphotungstate in the presence of divalent cations such as magnesium, the HDL-C remains unaffected in the supernatant is estimated using CHOD-POD method after centrifugation. The optical density (OD) was measured at 505nm and the concentration is expressed as mg.dl-1.
Very low-density lipoprotein cholesterol (VLDL-C)
Very low-density lipoprotein cholesterol (VLDL-C) was indirectly assessed using standard equation
Low-density lipoprotein cholesterol (LDL-C)
Low-density lipoprotein cholesterol (LDL-C) was indirectly assessed using standard equation
Creatine Kinase (CK)
Estimation of CK was done by kinetic method (Spinreact). CK catalyses the reversible transfer of phosphate group from phophocreatine to ADP and forms ATP. ATP and Glucose reacts in the presence of Hexokinase (HK) and forms glucose -6-phosphate (G6P) and ADP.G6P and NADP+ reacts in the presence of glucose -6- phosphate dehydrogenase and produces NADPH+ along with 6-Phosphogluconate. The rate of NADPH formation is measured photometrically at 340nm and is proportional to the catalytic concentration of CK present in the sample and is expressed as U/L.
Lactate Dehydrogenase (LDH)
LDH was estimated by using kinetic method (Spinreact). Lactate dehydrogenase; present in the sample catalyses the reduction of Pyruvate by NADH. The rate of decrease in concentration of NADH, measured photometrically at 340nm is proportional to the catalytic concentration of LDH present in the sample and is expressed in U/L.
Complete Blood Picture (CBP)
Haematological parameters namely hemoglobin (Hb), red blood cells (RBC), white blood cells (WBC), jematocrit (Hct), platelet count, mean corpuscular volume (MCV), mean corpuscular hemoglobin (MCH), mean corpuscular hemoglobin concentration (MCHC), absolute neutrophil count, absolute lymphocyte count, mixed cell count, neutrophil % and lymphocyte %, red cell distribution width (RDW-CV) were assessed in Sysmex –PocH100iTM automated haematology analyzer (Japan).
Statistics
IBM SPSS statistics (version 23.0) was used for analysis. Data were expressed as Mean ± standard deviation. Shapiro-Wilk test was used to check Normal distribution. The paired-t test was used to determine differences between two independent means, statistical significance was set at P = 0.05. Hedge’s g (unbiased) effect size also calculated between pre and post tests to measure the magnitude of the training effect.
Results and Discussions
The mean and standard deviations of age, height, weight, BMI and training age are shown in Table 1.

Basic details of Taekwondo practitioners
The mean, SD values and paired sample t-test results of biochemical parameters both before and after the training were shown in Table 2 & 4 respectively. No significant changes were observed in urea and uric acid levels after the training. Significant increase was observed in TC and HDL-C with significant reduction in TC/HDL-C ratio and insignificant decrease was also seen in VLDL-C and triglyceride levels after training. Significant decrease was observed in LDH levels with insignificant increase in CPK levels after the training. Insignificant improvement was observed in serum iron, TIBC and Transferrin saturation after the training.

Biochemical parameters before and after the Taekwondo training

Paired Samples t-Test of Biochemical Parameters
The Mean, SD values and paired sample t-test results of haematological parameters both before and after training were shown in Table 3 & 5 respectively. Significant increase of Hct and MCV values were observed after the training with no significant changes in hemoglobin levels. However significant reduction of MCHC was observed after the training. No changes were observed in Leukocyte, reticulocyte and platelet counts after the training. However insignificant reduction was observed in observed in Neutrophil/Lymphocyte Ratio.

Haematological parameters before and after the Taekwondo training

Paired Samples t-Test of Haematological parameters
Figure 1 depict the results of hematocrit (Hct), mean corpuscular volume (MCV) and mean corpuscular hemoglobin concentration (MCHC) before and after training. Figure 2 illustrate the lipid profile of players before and after training.
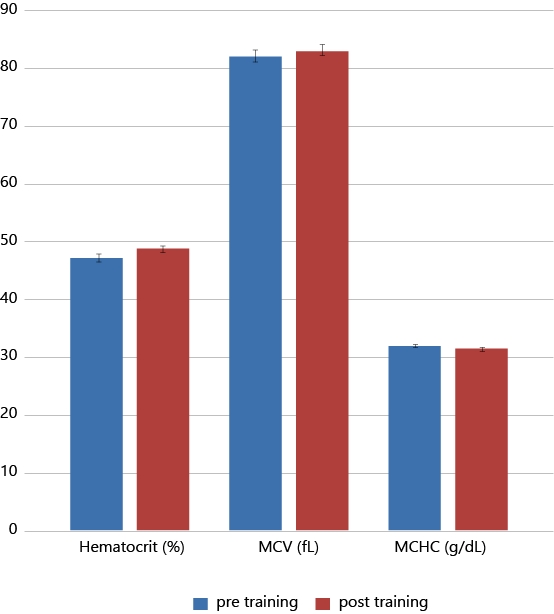
Changes in Hematocrit and RBC indices during the investigation
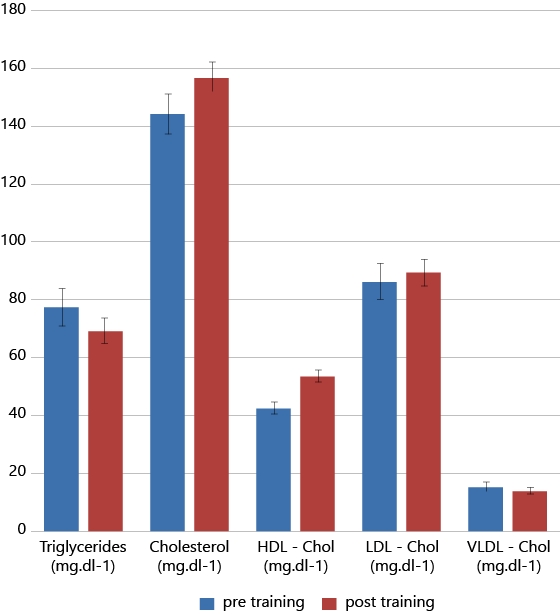
Changes in Lipid profile during the investigation
Discussion
Biochemical and haematological parameters are useful to assess the health and fitness of the athletes. Many researchers have revealed that the reference ranges of some parameters are different in athletes from normal population (Aliye menasve. 2011) and the levels of many routine biochemical and haematological parameters are greatly influenced by age, sex, (Nikolaidis, M.G. et al. 2003) and the level of physical activity. Taekwondo is a Korean marshal art characterised by fast, high, and spinning kicks. Taekwondo practice has been proposed to have beneficial effects on improving anaerobic power and capacity (Melhim, A.F. 2001). Very limited information is available about the biochemical and haematological parameters of male Taekwondo players and how these values vary during competitive phase specific Taekwondo training. The main aim of this study was to find out the effects of 12 weeks of competitive phase specific Taekwondo training on basal level of selected biochemical and haematological variables in male Taekwondo players. Results of the present study have shown a significant increase in total cholesterol (TC), HDL-cholesterol as well the significant reduction in TC/HDL-C ratio and LDH levels after the exercise training. Amongst the haematological parameters, hematocrit (Hct) and mean corpuscular volume (MCV) values were significantly increased after the training but a significant reduction was observed in MCHC. However no significant changes were observed in basal levels of urea, uric acid, CPK, hemoglobin and WBC cell types.
Lipid Profile
A significant increase (P< 0.05) of total cholesterol & HDL-cholesterol levels and a significant decline (P< 0.05) of TC/HDL-C Ratio (from 3.4 ± 0.57 to 2.9 ± 0.44) were observed after the 12 weeks of training besides this an insignificant decrease of triglycerides and VLDL-cholesterol was also observed.
Training induced changes in lipid profile
Aellen et al (1993) studied the effects of anaerobic and aerobic training on lipoprotein concentrations of sedentary men. Nine weeks bicycle ergo meter training was given to thirty three participants, four times per week. Sixteen were trained with high intensity, above the anaerobic threshold and seventeen exercised with low intensity, below the anaerobic threshold. The results had shown the changes in the lipid and lipoprotein profiles, only after training below the anaerobic threshold. The authors concluded that physical training above the anaerobic threshold has no or even negative effects on blood lipoprotein profiles. Subsequently, in order to attain favourable adaptations in lipoprotein profile, the training should be performed below the anaerobic threshold whereas very limited information is documented about the effect of mixed (aerobic and anaerobic) training on lipid profiles in athletes. In our study, we have observed a remarkable improvement in the lipid profile this might be training induced or it can be due to the hormonal influence.
Hormonal influence on lipid profile
Nan Zhang et al in 2014, conducted a study to know the relationship between endogenous testosterone and lipid profile in middle-aged and elderly Chinese men. That study included 4114 participants whose mean age was 56.04 ± 8.75 years. Bivariate and partial correlation analysis, multiple linear regression analysis, and a general linear model were used to assess the influence of TT on the lipid profile. Additionally, the odds ratios (ORs) (95% CIs) for hypertriglyceridemia and low HDL-C in relation to TT categories were calculated using logistic regression analysis. They found that serum TT was negatively correlated with the levels of TC, TG, and LDL-C and positively correlated with the level of HDL-C in middle-aged and older Chinese participants. Furthermore, the prevalence of hypercholesterolemia (high LDL-C, and low HDL-C) especially hypertriglyceridemia, decreased with increased serum TT. The results of our study have shown insignificant reduction of triglyceride and VLDL levels. Although there was a significant raise in both total cholesterol and HDL-cholesterol (P< 0.01) levels, the TC/ HDL-C Ratio was reduced significantly. This illustrates that there is more increase in HDL-C levels compared to total cholesterol. As all the participants of our study are in adolescent age testosterone might be one of the influencing factors.
Serum Enzymes
Serum levels of skeletal muscle enzymes are markers of the functional status of muscle tissue and fluctuate widely in both pathological and physiological conditions (Brancaccio et al., 2007). Serum creatine phosphokinase (CPK) and lactate dehydrogenase (LDH) give an indication of the degree of metabolic adaptation to physical training of skeletal muscles. The enzyme creatine kinase uses phosphocreatine (PCr) as its substrate and transfers a phosphate group to ADP, thus making the products ATP and creatine (Cr). This reaction is highly active within the first 10 seconds of maximal exercise; provide a rapid source of ATP production to fuel muscle contraction (Parolin et al., 1999). LDH is an oxidoreductase enzyme that catalyses the inter conversion of pyruvate and lactate. Both enzymes are involved in muscle metabolism, and their serum concentration is normally very low. As a result of physiological wear and tear of the cells, their levels increase considerably after intensive exercise and in muscle pathology (Garry JP et al 2000). CPK and LDH enzymes are widely used in sports medicine to monitor acute or chronic muscle tissue damages and to understand the biochemical adaptation to physical load. The increase in CPK and LDH activities in plasma after exercise is connected with changes of cell membrane integrity and mechanical damage of muscle fibres. Many studies have shown a significant increase in serum LDH levels after exhaustive exercise (Anugweje et al., 2014, Brancaccio et al., 2007). In our study, no significant change is observed in basal CPK levels after the training, but there is a significant decrease in basal LDH level. This might be due to muscular membrane adaptations after the training. Phospholipids are the major structural lipids of membranes and the functional properties of the membranes such as fluidity, permeability and anchoring of membrane proteins depend considerably on membrane phospholipid fatty acid composition (Stubbs CD et al., 1984, Hagve TA., 1988). Helge JW et al.(1985) have shown a significant effect of regular exercise training on the composition of the membrane phospholipid fatty acids. Another cause for different CPK and LDH responses in blood after training might be the disparity of enzymatic protein particles size. CK is a smaller protein (dimer with mass of 84,000 Da) compared to the LDH (tetramer with mass of 150,000 Da), consequently CPK can penetrate easily through muscle cell membrane disrupted by exercise (S. Poprzęcki et al, 2004).
Iron Profile
Serum Iron levels were significantly increased (P< 0.05) from pre training to post training, without any intervention of iron supplements. This change might be due to the adoption of good dietary habits or due to the training induced changes in hepcidin levels through altering basal interleukin -6 (IL-6) levels. A study by Kaya 2016 had shown that the serum IL-6 levels have been significantly reduced after 4 weeks of Taekwondo training in 10 elite male Taekwondo players and different research groups discovered that IL-6 is involved in regulation of hepcidin levels in response to inflammatory stimuli, through the Jak/STAT-3 signalling pathway (Wrighting DM et al 2006; Verga Flazacappa MV et al 2007). Iron is an essential trace element in the human body. It is very important for the synthesis of hemoglobin, myoglobin and plays an important role in the electron transport chain (ETC) and production of energy in mitochondria. Iron content in the body is largely controlled through absorption rather than excretion (Mccance, R. et al 1937). Hepcidin is the principle iron regulatory hormone, responsible for the maintenance of iron homeostasis (Ganz, T. 2011). Hepcidin levels that are inappropriately low or high result in iron overload or iron deficiency, respectively. Hepcidin by acting on ferroportin, the iron exporter located on the basolateral membrane and on macrophages controls the main inflows of iron into plasma. When hepcidin concentration is high ferroportin is internalized and iron is trapped in enterocytes, macrophages and lymphocytes. Hepcidin synthesis was markedly induced by infection and inflammation. IL-6 the major cytokine produced in response to a bout of exercise, itself is sufficient to induce hepcidin expression during inflammation. Studies by Peeling et al (2009) have shown that the production of IL-6 in contracting skeletal muscles results in the exercise induced hepcidin increase. In addition animals treated with cyclosporine-A, a calcineurin inhibitor to blunt plasma IL-6 during exercise showed lower hepcidin levels as compared to the exercised group without cyclosporine-A treatment (Banzet S et al 2012). So improvement in iron profile observed in our study might be due to the training induced reduction of basal IL-6 and plasma hepcidin levels.
Haematological parameters
In the present study significant changes (p< 0.001) were observed in hematocrit (Hct) and RBC indices namely mean corpuscular volume (MCV) and mean corpuscular hemoglobin concentration (MCHC) after 12 weeks exercise training and no significant change is observed in mean corpuscular hemoglobin (MCH). Hct and MCV values were significantly increased after the training but the MCHC is significantly reduced. MCV (fL) is the average volume of a red blood cell and is calculated by dividing the haematocrit (%) by the red blood count (1012 cells/L). MCHC (g.dl-1) is the average concentration of hemoglobin per unit volume of red blood cells, calculated through dividing the hemoglobin (g.dl-1) by the haematocrit (%) values. Significant increase in Hct and insignificant rise in RBC were observed in this study after the training however no significant changes were observed in Hemoglobin levels. This can be due to the exercise induced erythropoiesis or due to the release of young RBC from the bone marrow under the influence of stress hormones such as Catecholamines and cortisol (Ghigo E et al, 2011). It is well documented in the literature that exercise training can stimulate erythropoiesis and increases red cell mass as well as plasma volume, resulting in increased blood volume (Convertino VA., 1991; Min Hu., Wentao Lin., 2012). Consistent hemoglobin concentration with increased haematocrit resulted in the decreased mean corpuscular hemoglobin concentration. With exercise training, significant increase in serum iron, Hct and MCV were noted but no significant improvement is observed in basal hemoglobin levels.
No significant changes were observed in total white blood cell (WBC), WBC cell types and platelet after the training. But NLR was decreased insignificantly from 1.41 ± 0.87 to 1.36 ± 0.63. It has been proposed that the NLR can be used to monitor the exercise recovery status of an individual following a bout of exercise (Bessa et al., 2016; Gleeson, 2002). Researchers have suggested that the NLR can provide a good measure of exercise stress and subsequent recovery (Nieman, 1998). The NLR usually returns to normal within 6-9 hours after exercise, but where the exercise has been particularly prolonged and stressful, the NLR may still be elevated at 24 hours post-exercise.
Conclusion
Results suggested that the regular Taekwondo training is efficient to improve lipid profile and it can potentially mitigate the cardio vascular risk in male adolescents. Serum iron, Hct and MCV levels were significantly improved in the study group, after the Taekwondo training but no significant changes were seen in hemoglobin levels and on the other hand MCHC levels are significantly reduced after the training. This shows that the given exercise training alone is effective to trigger the RBC production, but failed to increase the hemoglobin concentration. Consumption of iron rich diet/supplements during the training might be helpful to meet the demands. neutrophil lymphocyte ratio (NLR) is maintained during training and no significant changes were seen in urea and uric acid levels, it shows that the training load given is well tolerable for the present study group. Since studies on Taekwondo players are limited in India, the data of the present study can be a handy tool and can act as a frame of reference for monitoring the training related biochemical adaptations. Selected biochemical and haematological variables were considered in the present study however analysis of more parameters and correlation with dietary intake and performance can give immense information about the training responses.
References
Aellen, R., Hollmann, W., & Boutellier, U. (1993). Effects of aerobic and anaerobic training on plasma lipoproteins. Intern J Sports Med, 14, 396-400.
Aellen R., Hollmann W., et al, Boutellier U.. 1993;Effects of aerobic and anaerobic training on plasma lipoproteins. Intern J Sports Med 14:396–400. 10.1055/s-2007-1021198.Aliye Manasve, (2011). The Comparison of Biochemical blood levels of athletes and sedentary. World Journal of Sports Sciences, 5(3):163-168.
Manasve Aliye. 2011;The Comparison of Biochemical blood levels of athletes and sedentary. World Journal of Sports Sciences 5(3):163–168.Anugweje, K.C., & Ayalogu, E. O., (2014). Effect of Training on the Lactate Dehydrogenase (LDH) levels of Athletes. Science pub net/researcher, 6(9).
Anugweje K.C., et al, Ayalogu E. O.. 2014;Effect of Training on the Lactate Dehydrogenase (LDH) levels of Athletes. Science pub net/researcher 6(9)Banzet, S., Sanchez, H., Chapot, R., Bigard, X., Vaulont, S., Koulmann, N. (2012). Interleukin -6 contributes to hepcidin M RNA increase in response to exercise. Cytokine, 58, 158-161.
Banzet S., Sanchez H., Chapot R., Bigard X., Vaulont S., Koulmann N.. 2012;Interleukin -6 contributes to hepcidin M RNA increase in response to exercise. Cytokine 58:158–161. 10.1016/j.cyto.2012.01.006.Bessa, A., Oliveira, V., Agostini, G., Oliveira, R., Oliveira, A., White, G., & Espindola, F. (2016). Exercise Intensity and Recovery: Biomarkers of Injury, Inflammation, and Oxidative Stress. J Strength Cond Res, 30(2), 311-319.
Bessa A., Oliveira V., Agostini G., Oliveira R., Oliveira A., White G., et al, Espindola F.. 2016;Exercise Intensity and Recovery: Biomarkers of Injury, Inflammation, and Oxidative Stress. J Strength Cond Res 30(2):311–319.Brancaccio, P., Maffulli, N., & Limongelli, F. M. (2007). Creatine kinase monitoring in sport medicine. British Medical Bulletin, 81-82, 209-230.
Brancaccio P., Maffulli N., et al, Limongelli F. M.. 2007;Creatine kinase monitoring in sport medicine. British Medical Bulletin 8182:209–230.Bridge, C. A. et al., (2013). Taekwondo Exercise Protocols do not Recreate the Physiological Responses of Championship Combat. Int J Sports Med, 34, 573-581.
Bridge C. A., et al. 2013;Taekwondo Exercise Protocols do not Recreate the Physiological Responses of Championship Combat. Int J Sports Med 34:573–581. 10.1055/s-0032-1327578.Chen, Ko-Chia, Dr. Zen, P., et al. Physical Training in Taekwondo. The Sport Digest - ISSN: 1558-6448.
Chen Ko-Chia Dr, Zen P., et al. Physical Training in Taekwondo. The Sport Digest ISSN: 1558-6448.Fong, S., Ng, S., and Chung, L. (2013) Health through martial arts training: Physical fitness and reaction time in adolescent Taekwondo practitioners. Health, 5, 1-5. doi: 10.4236/health.2013.56A3001.
Fong S., Ng S., et al, Chung L.. 2013;Health through martial arts training: Physical fitness and reaction time in adolescent Taekwondo practitioners. Health 5:1–5. 10.4236/health.2013.56a3001.Convertino, V. A. : Blood volume: its adaptation to endurance training. Med Sci Sports Exerc, 23, 1338-1348.
Convertino V. A.. Blood volume: its adaptation to endurance training. Med Sci Sports Exerc 23:1338–1348.Garry, J. P., McShane, J. M. (2000). Postcompetition elevation of muscle enzyme levels in professional football players. MedGenMed, 2, E4.
Garry J. P., McShane J. M.. 2000;Postcompetition elevation of muscle enzyme levels in professional football players. MedGenMed 2:E4.Ghigo, E., Lanfranco, F., Strasburger, C. J.: Hormone Use and Abuse by Athletes. Boston, Springer, 2011, p.1
. Ghigo E., Lanfranco F., Strasburger C. J.. Hormone Use and Abuse by Athletes Boston: Springer; 2011. p. 1.Gleeson, M. (2002). Biochemical and immunological markers of over-training. J Sports Sci Med, 1(2), 31-41.
Gleeson M.. 2002;Biochemical and immunological markers of over-training. J Sports Sci Med 1(2):31–41.Hagve, T. A. (1988). Effects of unsaturated fatty acids on cell membrane functions. Scand J Clin Lab Invest, 48, 381-388.
Hagve T. A.. 1988;Effects of unsaturated fatty acids on cell membrane functions. Scand J Clin Lab Invest 48:381–388. 10.1080/00365518809085746.Helge, J. W., Wu, B. J., Willer, M., Daugaard, J. R., Storlien, L. H., & Kiens, B. (1985). Training affects muscle phospholipid fatty acid composition in humans. Journal of Applied Physiology, (1985). 2001 Feb; 90(2), 670-7.
Helge J. W., Wu B. J., Willer M., Daugaard J. R., Storlien L. H., et al, Kiens B.. 1985;Training affects muscle phospholipid fatty acid composition in humans. Journal of Applied Physiology (1985). 2001 Feb. 90(2):670–7. 10.1152/jappl.2001.90.2.670.Kindermann, W. (1986). Overtraining – an expression of faulty regulated development. translated from Deutsche Zietschrift Fur Sportmedizin, 37, 238245.
Kindermann W.. 1986. Overtraining – an expression of faulty regulated development. translated from. Deutsche Zietschrift Fur Sportmedizin 37238245.Melhim, A. F.(2001). Aerobic and anaerobic power responses to the practice of taekwon-do. Br J Sports Med, 2001, 35, 231-235.
Melhim A. F.. 2001;Aerobic and anaerobic power responses to the practice of taekwon-do. Br J Sports Med 35:231–235. 10.1136/bjsm.35.4.231.Michael Gleeson., (2002). Biochemical and immunological markers of overtraining. Journal of Sports Science and Medicine (2002) 1, 31-41. http://www.jssm.org.
Gleeson Michael. 2002;Biochemical and immunological markers of overtraining. Journal of Sports Science and Medicine (2002) 1:31–41. http://www.jssm.org.Min Hu., Wentao Lin., (2012) Exercise Training, Red Blood Cell Production and Anemia. Acta Haematol, 2012, 127, 156-164.
Min Hu Wentao Lin. 2012;Exercise Training, Red Blood Cell Production and Anemia. Acta Haematol, 2012 127:156–164.Nieman, D. C. (1998). Influence of carbohydrate on the immune response to intensive, prolonged exercise. Exercise Immunology Review, 4, 64-76.
Nieman D. C.. 1998;Influence of carbohydrate on the immune response to intensive, prolonged exercise. Exercise Immunology Review 4:64–76.Nikolaidis, M.G., Protosygellou, M. D., Petridou, A., Tsalis, N,. Tsigilis, V,. Mougios (2003). Hematologic and biochemical profile of juvenile and adult athletes of both sexes: implecations for clinical evaluation. Int J Sports Med, 200: 24(7), 506-511.
Nikolaidis M. G., Protosygellou M. D., Petridou A., Tsalis G., Tsigilis N., Mougios . 2003;Hematologic and biochemical profile of juvenile and adult athletes of both sexes: implecations for clinical evaluation. Int J Sports Med, 200 24(7):506–511.Oktay Kaya .(2016). Effect of a four‑week exercise program on the secretion of IFN‑γ, TNF‑α, IL‑2 and IL‑6 cytokines in elite Taekwondo athletes. Biomedical Reports, 5, 367-370, 2016.
Kaya Oktay. 2016;Effect of a four‑week exercise program on the secretion of IFN‑γ, TNF‑α, IL‑2 and IL‑6 cytokines in elite Taekwondo athletes. Biomedical Reports 5:367–370. 2016;Parolin, M. L., Chesley, A., Matsos, M. P., Spriet, L. L., Jones, N. L., & Heigenhauser, G. J. F. (1999). Regulation of skeletal muscle glycogen phosphorylase and PDH during maximal intermittent exercise. American Journal of Physiology, 277, E890–E900.
Parolin M. L., Chesley A., Matsos M. P., Spriet L. L., Jones N. L., et al, Heigenhauser G. J. F.. 1999;Regulation of skeletal muscle glycogen phosphorylase and PDH during maximal intermittent exercise. American Journal of Physiology 277:E890–E900. 10.1152/ajpendo.1999.277.5.e890.Peeling, P., Dawson, B., Goodman, C., Landers, G., Wiegerinck, E. T., Swinkels, D. W., Trinder, D. (2009). Effects of exercise on hepcidin response and iron metabolism during recovery. Int J Spt Nurt Exe, 2009, 19, 583-597.
Peeling P., Dawson B., Goodman C., Landers G., Wiegerinck E. T., Swinkels D. W., Trinder D.. 2009;Effects of exercise on hepcidin response and iron metabolism during recovery. Int J Spt Nurt Exe, 2009 19:583–597. 10.1123/ijsnem.19.6.583.Poprzęcki, S., Staszkiewicz, A., Hübner-Woźniak, E. (2004). Effect Of Eccentric And Concentric Exercise On Plasma Creatine Kinase (CK) And Lactate Dehydrogenase (LDH) Activity In Healthy Adults. Biology of Sport, 21(2).
Poprzęcki S., Staszkiewicz A., Hübner-Woźniak E.. 2004;Effect Of Eccentric And Concentric Exercise On Plasma Creatine Kinase (CK) And Lactate Dehydrogenase (LDH) Activity In Healthy Adults. Biology of Sport 21(2)Stubbs, C. D., Smith, A.D. (1984). The modification of mammalian membrane polyunsaturated fatty acid composition in relation to membrane fluidity. Biochim Biophys Acta, 779, 89-137.
Stubbs C. D., Smith A.D.. 1984;The modification of mammalian membrane polyunsaturated fatty acid composition in relation to membrane fluidity. Biochim Biophys Acta 779:89–137.Telford, R. D., Cunningham, R. B. (1991). Sex, sport, and body-size dependency of haematology in highly trained athletes. Med Sci Sports Exerc, 1991 Jul, 23(7), 788-94.
Telford R. D., Cunningham R. B.. 1991;Sex, sport, and body-size dependency of haematology in highly trained athletes. Med Sci Sports Exerc, 1991 Jul 23(7):788–94. 10.1249/00005768-199107000-00004.Verga Falzacappa, M. V., Vujic, S. M., Kessler, R., et al (2007). STAT3 mediates hepatic hepcidine expression and its inflammatory stimulation. Blood, 2007, 109(1), 353-358.
Verga Falzacappa M. V., Vujic S. M., Kessler R., et al. 2007;STAT3 mediates hepatic hepcidine expression and its inflammatory stimulation. Blood, 2007 109(1):353–358. 10.1182/blood-2006-07-033969.Wrighting, D. M., Andrews, N. C. (2006). Interleukin -6 induces hepcidin expression through STAT3. Blood, 2006, 108(9), 3204-3209.
Wrighting D. M., Andrews N. C.. 2006;Interleukin -6 induces hepcidin expression through STAT3. Blood, 2006 108(9):3204–3209. 10.1182/blood-2006-06-027631.Zhang, N., Zhang, H., Zhang, X., et al. (2014). The relationship between endogenous testosterone and lipid profile in middle-aged and elderly Chinese men. European Journal of Endocrinology, 170(4), 487–494.
Zhang N., Zhang H., Zhang X., et al. 2014;The relationship between endogenous testosterone and lipid profile in middle-aged and elderly Chinese men. European Journal of Endocrinology 170(4):487–494. 10.1530/eje-13-0802.