Accuracy of swimming wearable watches for estimating energy expenditure
Article information
Abstract
With the recent installation of waterproof function on wearable watches, various sports activities including walking, running and even swimming are monitored. Commercially available swimming wearable watches automatically identified stroke type, swim distance, stroke counts and energy expenditure (EE). Although the accuracy of estimating EE of walking, bilking and activities of daily life on activity monitors have been evaluated, it has not been examined for swimming. Thus, the purpose of the study was to evaluate the accuracy of estimating EE for swimming wearable watches (Apple Watch S2, Apple and Garmin Finex 3HR, Garmin). A total of 78 swimmers aged 20-59 years (female: 48%) participated in the study. All the participants wore Apple and Garmin and completed a set of swimming protocol comprising various speeds (0.4, 0.6, 0.8, 1.0, 1.2 m/s). At each swimming speed they were asked to swim for four minutes. Lap counts, stroke counts and energy expenditure (EE) from the Apple and Garmin were evaluated with the criterion measures. Lap counts and stroke counts were directly counted by the research assistant. The portable respiratory gas analyzer (K4b2, Cosmed, Italy) and a swimming snorkel (Aqua Trainer Snorkel, Cosmed, Italy) was used as the criterion measure of EE. The mean absolute percentage error (MAPE) of lap counting and stroke counts at various swimming speed were within 10% for Apple (lap counts: 0.5-6.1%, stroke counts: 6.2-9.3%) and about 20% for Garmin (lap counts: 0-20.6%, stroke counts: 6.8-17.6%). However, the MAPE of EE was higher for Apple (17.1%-151.7%) than for Garmin (17.9%-32.7%). The accuracy of estimating EE tended to improve with increasing swimming speed for both Apple and Garmin. The EEs from Apple were outside the equivalence zone except for at 1.2 m/s and were overestimated compared to the criteria. On the other hand, EEs from Garmin were within the equivalence zone at all speeds except for 1.2 m/s. In conclusion, Apple and Garmin wearable watches accurately measure lap counts and stroke counts. However, the accuracy of estimating EE are poor at slow to medium swimming speed. Further improvement is needed to estimate energy expenditure of swimming at various speed.
Introduction
Most wearable watches on the market have physical activity monitoring functions such as step counts, heart rate and energy expenditure (EE) etc. Wearable watches are used as tools to maintain and/or promote health by motivating physical activities (Chowdhury, Western, Nightingale, Peacock, & Thompson, 2017). Wearable-based behaviors changes may be effective to promote physical activity with instantaneous feedback and monitoring exercise intensity. As the wearable devices are utilized as intervention tools in clinical and research setting, the accuracy of the wearables are important. Accordingly, many studies on the accuracy of wearable devices are now emerging. Previous studies were limited to the validity of wearable devices that included measures of step counting, heart rate and EE while walking and running. These studies have reported that counting is relatively accurate (Case et al., 2015), however, the accuracy of heart rate and EE vary depending on the device and the intensity of exercise (Chowdhury et al. 2017; Dooley et al. 2017; Wallen et al., 2016; Stahl et al., 2016).
Swimming is one of the most popular cardiorespiratory exercise involving rhythmic movements of large muscles along with walking and running. Swimming can be enjoyed through the lifespan regardless of age and health status. Swimming is widely recommended not only for healthy people but also for overweight/obese people, patients with arthritis, and elderly persons with joint problems for health (American College of Sports Medicine, 2013). With the recent installation of waterproof function on wearable watches, swimming performance is easily monitored. The commercial wearable watches include features such as stroke counts and swim speed, and types of stroke performed atomically. Swimming wearable watches are primarily aimed for recreational swimmers as opposed to elite swimmers. Thus, the accuracy of basic features such as lap counts, stroke counts and EE are prominent to be used as an intervention tool for recreational swimmers to promote physical activity.
Mooney et al. (2017) investigated the accuracy of the swimming movement recognition (stroke type, swim distance, stroke rate, stroke length, average speed etc.) of wearable devices. The accuracy of Garmin SwimTM and Finis SwimsenseⓇ was tested on national swimmers, and the results were reported to be similar. The authors, however, proposed a study on recreational swimmers since their participants were elite swimmers whose swimming form is outstandingly consistent. Also one of the key features of wearables, EEs of swimming is not evaluated yet. Previously, the accuracy of step counts, heart rate and EE were examined for walking, running, cycling, and rowing (Brazeau et al., 2011; Case et al., 2015; Chowdhury et al. 2017; Dooley et al. 2017; Erdogan et al., 2010; Wallen et al., 2016; Stahl et al., 2016). Therefore, the purpose of the present study was to evaluate the accuracy of the information on lap count, stroke count, and EE provided by wearable devices (Apple and Garmin) during swimming.
Research Method
Participants
The participants of this study were healthy adults, aged from 20 to 59 years, free from illnesses or injuries, unrestricted physical function and able to swim at various speeds. Exclusion criteria were health risk factors such as hypertension, or a dental implant because of problems wearing a snorkel. The five participants (4 male and 1 female) were excluded due to missing data or dropping out in the experiment. In the study, a total of 78 participants (40 male and 38 female) were collected for statistical analysis. The demographic characteristics are shown in Table 1. All participants were given an overview of the procedures and signed the Institutional Review Board approved informed consent document.

Demographic characteristics of the participants (mean±SD)
Study Procedures
The experiment was conducted in a 25 m indoor pool with the water temperature was 28.8°C. Participants completed the Physical Activity Readiness Questionnaire and resting heart rate, blood pressure, body height, weight and body fat percentage were measured using standard methods.
All participants wore Apple and Garmin and completed a set of swimming protocol (0.4, 0.6, 0.8, 1.0, 1.2 m/s) comprising various speed. An experimental protocol was chosen based on the intensity used in a previous study related to swimming EE (Holmer et al., 1972; Pendergast et al.; 1977).
To help the participant maintain appropriate time for each protocol, a research assistant provided feedback the time at every 25 m turn from the swimming pool floor. To standardize the amount of swimming, underwater swimming was controlled, and the side turn was the only turn method permitted to use snorkel.
In the present study, the total lap counts and stroke counts for four minutes of each protocol were used in the analysis. To use the value of steady-state of each protocol, the data of the last two minutes (3–4 minutes) for all activities were used in data analysis. For the EE of each wearable watches, EE per minute was calculated by dividing actual swimming time by minutes.
The descriptive statistics of 78 participants by protocol including resting are shown in Table 2. Oxygen uptake, metabolic equivalents, heart rate, and participative RPE were gradually increased as the speed increased.

Objective and subjective exercise intensity by swimming speed (mean ± SD)
Measuring instruments
Criterion measurement instruments
Criterion lap counts and stroke counts were directly counted by the research assistant. The lap counts were swimming back and forth once in a 50m pool (unit: lap counts/ bout) and stroke counts were one stroke was considered to be completed when one arm was rotated (unit: stroke counts/ bout). Bout means individual speed of swimming consisting of four minutes. The portable respiratory gas analyzer (K4b2, Cosmed, Italy) and a swimming snorkel (Aqua Trainer Snorkel, Cosmed, Italy) was used as the criterion measure of EE. Cosmed K4b2 is a light weight (925g) measuring instrument worn on the back, which allows real-time monitoring of oxygen intake, carbon dioxide emissions, and ventilation rate using the method. The Aqua Trainer Snorkel is connected to the K4b2 analyzer and used for real-time gas analysis during swimming. There liability of both criterion measurement instruments has been verified by many researchers (Eisenmann, Brisko, Shadrick, & Welsh, 2003; McLaughlin, King, Howley, Bassett, & Ainsworth, 2001; Baldarietal., 2013; Keskinenetal., 2003). The portable gas analyzer was calibrated according to its manual before data collection.
Wearable watches
Among the top five best-selling (international data corporation; IDC, 2017) wearable watches (Xiaomi, Apple, Fitbit, Samsung, Garmin), two swim activity monitors, the Apple Watch S2 and Garmin Finex 3HR. Apple has had a swimming recognition function since 2016. Apple Watch S2 (Apple Inc, Cupertino, CA, USA), which was used in the present study, provides information such as activity metabolism, EE, heart rate, stroke count, lap count, travel distance, total time, and pace during swimming (Apple, 2017).
Garmin was established in 1989 and specialized in global positioning system (GPS). It began to produce exercise-related wearables in 2003, and a swimming-related function was first installed on the Forerunner 910XT in 2012. The Garmin Finex 3HR (Garmin, Ltd, Schaffhausen, Switzerland), which was used in the present study, provides information such as EE, stroke count, travel distance, exercise duration, average pace, maximum pace, average speed, top speed, and SWOLF (swim golf) etc. (Garmin, 2017).
In the present study, lap counts, stroke counts, and EE from the Apple and Garmin were evaluated with the criterion measures. But Garmin does not present lap count information, lap counts were used to calculated by dividing the total distance traveled in four minutes by 50m.
Others measures
Height was measured with an accuracy of 0.1 cm using an extensimeter (Jenix, DS-102, Korea). Weight and body fat percentage were measured to 0.1 kg and 0.1% in light clothing using a body composition analyzer (Biospace, InBody 720, Korea). The measured height and weight information was entered into the user information field of each wearable watches and the portable respiratory gas analyzer before the experiment. Heart rate was measured using a waterproof heart rate chest strap (Polar Electro Oy, Polar V800, Finland), and the subjective exercise intensity was measured on the Borg scale immediately after each protocol.
Statistical analysis
The analyses were conducted using SPSS ver. 22.0 and Medcale ver. 14.0, and the specific data processing methods were as follows.
Means and standard deviations were calculated of physical characteristics and all relevant data. Two-way analysis of variance (ANOVA) was used to test the effects of swimming by speed and the interaction effect between test instruments, and the p hoc test was performed using the Bonferroni test. The levels of error observed on the wearable watches were calculated into mean absolute percent error (MAPE %) based on the criterion measure: [|measured valued observed in wearable devices – criterion measures | / criterion measures × 100%].
Mean differencewearable watches using Bland & Altman plot. In addition, to assess measurement agreement between criterion measures and the measurements made by the Apple and Garmin devices, a 95% equivalence test was performed. For wearable watches to be considered equivalent to the criterion with 95% precision, equivalence zone was determined as ± 10% of the criterion mean (Lee, Kim and Welk, 2014) this. All statistical significance levels were set at α=.05.
Results
Test of difference between criteria and wearable watches
Descriptive statistics of criterion measures of swimming by speed and lap counts, stroke counts, and EE provided by Apple and Garmin devices are shown in Table 3. The results of a two-way ANOVA on the effects of swimming by speed and the interaction effect between test instruments showed no statistically significant interaction effect for lap counts and stroke counts (lap counts: F = 1.359, p = .211, stroke counts: F = .145, p =. 997), but statistically significant interaction effect (F = 9.395, p < .001) was found for EE. The post hoc test showed no significant difference between Garmin and the criteria at all speeds, but Apple was overestimating compared to the criteria and Garmin (p < .001).

Descriptive statistics of criteria and wearable watches
Figure 1 shows criterion measures by swimming speeds compared to the MAPE of lap counts, stroke counts, and EE provided by Apple and Garmin. For lap counts and stroke counts, the MAPE of Apple was within 10% (lap counts: 0.5-6.1%, stroke counts: 6.2-9.3%) while that of Gamin was about 21% (lap counts: 0-20.6%, stroke counts: 6.8-17.6%), and both devices showed higher error rates when speed was slower. On the other hand, Apple overestimated EE at all speeds in that the MAPE at the speed of 0.4 m/s-1.0 m/s were vigorous (32.70%-151.66%) but the MAPE (17.93%) became lower at the speed of 1.2m/s. Garmin showed MAPE of 17.9%-32.7%, and both wearable watches showed a tendency of gradually decreasing the MAPE as the intensity of exercise increased.

Mean absolute percentage error (MAPE; %) for wearable watches based on intensity: (A) Lab counts, (B) Stroke counts, (C) Energy expenditure.
Bland & Altman plot of criteria and wearable watches
The 95% confidence interval of mean difference limits was determined with a Bland-Altman plot created by using criterion measures and averages and average differences of lap counts, stroke counts, and EE provided by the Apple and Garmin devices (Figure 2). For lap counts, Apple (Mean difference = 0, Low LoA-Upper LoA: -0.8-0.8) showed a confidence interval with a smaller deviation than Garmin (Mean difference = -0.3, Low LoA-Upper LoA: -2.0 - 1.4). For the stroke counts, Apple (Mean difference = -0.4, Low LoA-Upper LoA: -16.5 - 15.7) also showed a confidence interval with a smaller deviation than Garmin (Mean difference = 4.9, Low LoA-Upper LoA: 21.6- -11.8). For EE, however, Garmin (Mean difference = 0.3, Low LoA-Upper LoA: -4.1 - 4.7) showed a confidence interval with a smaller deviation than Apple (Mean difference = 4.2, Low LoA-Upper LoA: -0.7 – 9.0).
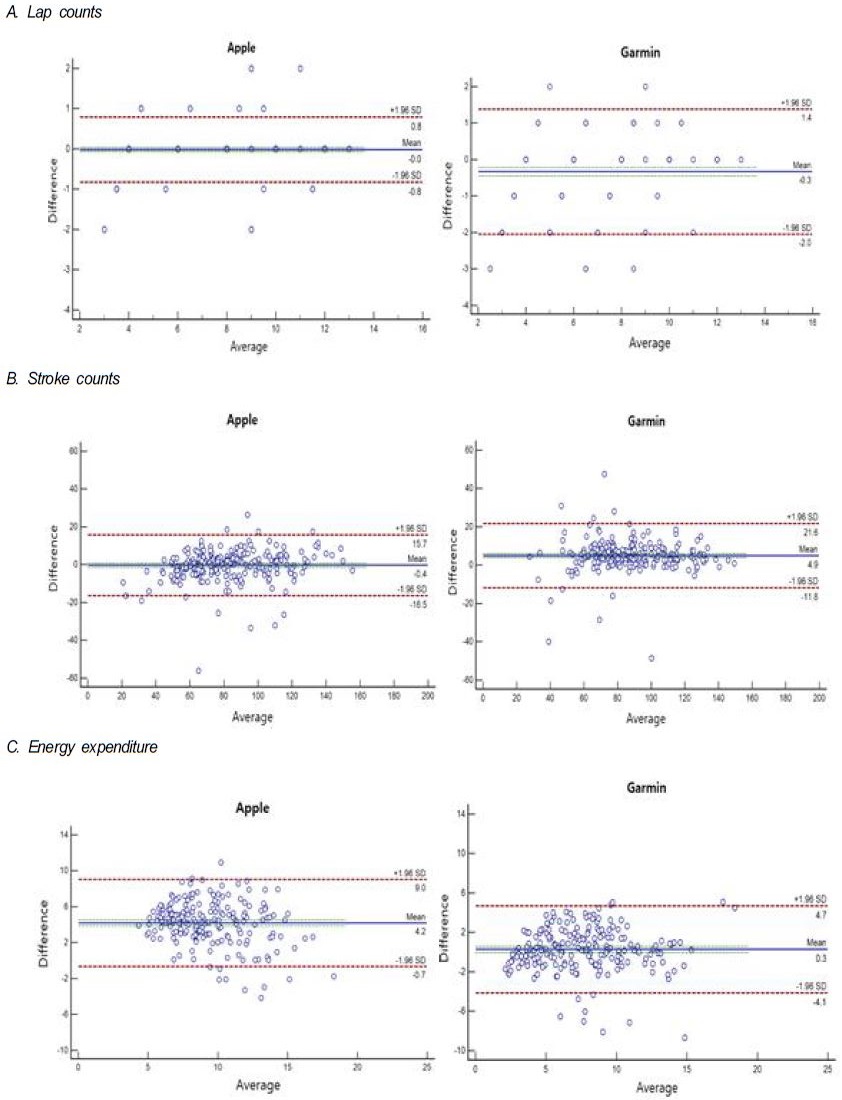
Bland & Altman plot for wearable watches: (A) Lab counts, (B) Stroke counts, (C) Energy expenditure.
Apple : Apple Watch S2, Garmin : Garmin Finex HR
Test of equivalence between criteria and wearable watches (95% CI)
To test measurement agreement between criterion measures and the measurements of the Apple and Garmin a 95% equivalence test was performed Figure 3. Lap counts were within the equivalence limits (criterion measure ± 10%) except for 0.4 m/s for Garmin and the stroke counts was within the equivalence limits except for Garmin at 0.4 m/s and 0.6m/s.
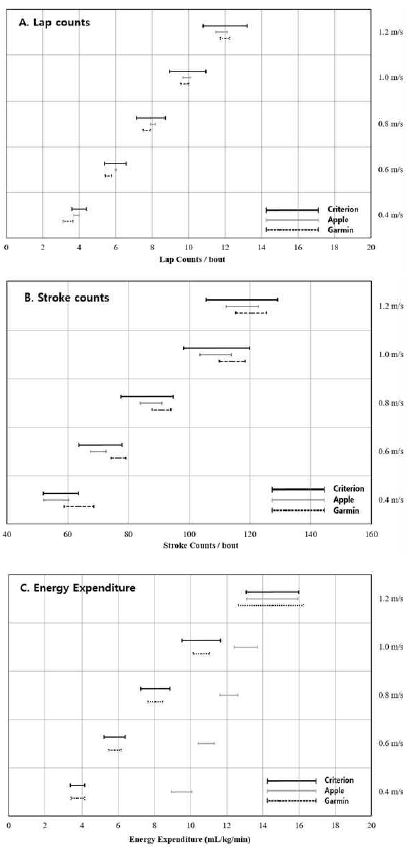
Equivalence test (95% CI) for wearable watches : (A) Lab counts, (B) Stroke counts, (C) Energy expenditure.
Apple : Apple Watch S2, Garmin : Garmin Finex HR, Bout means individual speed of swimming consisting of four minutes.
In the case of Apple, EE was within the equivalence zone (90% CI = 13.08-15.93) at 1.2 m/s, but it was not within the equivalence zone at other speeds and overestimated the EE compared to the criteria. In the case of Garmin, EE was within the equivalence zone at all speeds except for 1.2 m/s at which it was outside the equivalence zone.
Discussion
Swimming is a representative aerobic exercise and many international organizations related to health recommend swimming as an exercise to improve and prevent hypertension and cardiovascular diseases. Owing to technological development, wearable watch have been recently released with which feedback on the amount of exercise can be checked in real time during swimming. The goal of ordinary swimmers is health promotion and weight control, and objective evaluation of the amount of physical activities can be useful for achieving such a goal. Until now however, research has been lacking on the accuracy of the stroke counts, lap counts, and EE at different speeds, which are the main indicators of the function of wearable swimming recognition devices.
The accuracy of swimming related data (lap count, stroke count, EE) by both Apple and Garmin wearable watches used in the present study was improved as the intensity of exercise was increased. In addition, the accuracy of the information was high for lap count and the stroke count while the accuracy of EE varied depending on the speed and the type of wearable watches. Recently, wearable devices are being used as tools to maintain health by measuring personal activities and increasing motivation to participate in physical activities (Chowdhury, Western, Nightingale, Peacock, & Thompson, 2017). Accordingly, the necessity of research on the accuracy of wearable devices that provide information on various physical activities is increasing. The present study evaluated the accuracy of swimming information provided by wearable watches while swimming. The significance of the findings from academic and practical perspectives based on the results of the present study and other related studies can be comparatively analyzed as follows.
Dooley et al., (2017) evaluated the accuracy of EE on treadmill activities measured by Fitbit, Apple, and Garmin devices by exercise intensity. The results were consistent with the findings of the present study in that the accuracy improved as the exercise intensity increased and all three wearable devices overestimated compared to the criterion test instrument. The findings of the study by Wallen et al. (2016) who evaluated EE measured by wearables such as Apple Watch, Fitbit Charge HR, Samsung Gear S, and Mio Alpha, however, is in contrast to the findings of the present study in that all test instruments in their study tended to underestimate. Because Wallen et al. (2016) analyzed the results of 58-minute circuit training (sitting, standing, treadmill exercise stress test, cycle exercise) without differentiating exercise intensity, it is impossible to interpret which part of the protocol caused the difference.
In a study (Chowdhury et al. 2017) evaluating the EE accuracy of wearable devices (Microsoft Band, Apple Watch, Fitbit Charge HR, Jawbone UP 24, Bodymedia Armband, Actiheart) in a laboratory and in daily life, all devices were reported to underestimate compared to the criterion in a 24-hour daily life setting. However, in a laboratory environment, the measurement by Apple was similar to the criterion EE and the error rate decreased in vigorous intensity activities such as jogging. In summary, the accuracy of EE so far measured by commercialized wearable devices has varied depending on the research design, and the accuracy increased when the intensity of the activity increased.
Apple Watch disclosed on its home page that lap count, travel distance, and EE are estimated during indoor swimming based on an accelerometer (Apple, 2017). Among studies that used accelerometers to predict the amount of swimming, Mooney et al., (2015) investigated the trend of using sensor technology during the training of elite swimmers, and found that the most frequent location of sensors during swimming was the wrist and the waist. In addition, Nordsborg et al., (2014) investigated the relationship between reference oxygen uptake and the size of the triaxial accelerometer worn on the wrist, waist, and ankle. They found the strength of correlation in the order of wrist (r = 0.77), ankle (r = 0.73), and waist (r = 0.46) and were able to confirm the possibility of using wearable devices for the prediction of swimming EE.
The research protocol of Nordsborg et al., (2014) used the speed of 1.6 m/s for elite swimmer and 1.3 m/s for general participants, which was faster than the speed employed in the protocol of the present study. Ganzevles et al., (2017) compared the reliability and validity of lap time and the stroke count by attaching an accelerometer to the back of swimming athletes and comparing the measurements to video recordings. They found the errors for lap time and the stroke count to be ±2% and ±1%, respectively, and reported that accelerometers can be reliably used as a means to measure the amount of exercise during swimming, which partially agrees with the findings of the present study. Both studies (Nordsborg et al., 2014; Ganzevles et al., 2017) conducted accuracy test at higher speeds than the protocol of the present study because the research protocol of Ganzevles et al. (2017) also used elite swimmers who could swim freestyle at a speed of 1.32 m/s. A review on protocols used in previous studies related to EE in swimming showed that Montpetiti et al., (1988) used 1.0 - 1.25 m/s speed protocol and presented swimming EE using speed. Barbosa et al., (2006) tested differences in EE by the swimming style and the study protocol was also performed at 1.0 m/s - 1.6 m/s. Other studies on swimming EE mostly employed elite swimmers and relatively high swimming speed (Craig & Pendergast, 1979; Zamparo et al., 2005). The reason for low accuracy at light intensity activities appears to be attributable to differences in swimming skills of the participants, the characteristics of the instrument (such as accelerometer) installed on wearable devices, and the limitations in the internal algorithms.
Mooney et al., (2017) who evaluated the accuracy of wearable devices in the recognition of swimming motion stated that even though the accuracy of distance estimation was accurate, the accuracy of stroke speed, stroke length, and average speed was affected by lap time and the stroke count, which makes it appropriate for general swimmers to use it as a reference value but accuracy needs to be improved to use them to improve performance.
In conclusion, the accuracy of the Apple was higher than that of the Garmin in lap count and the stroke count, but the performance of both wearable watches was similar if lower speed was excluded. The accuracy of the evaluation of EE of Apple was lower than that of Garmin and the accuracy was worse at lower speed, which indicates the necessity of continuous improvement in the algorithm of swimming EE of wearable devices. Accordingly, the information on EE of wearable watches while swimming should be selectively used according to the situation.
This study has some limitations. First, the accuracy of swimming EEs was limited to freestyle. Because the protocol was selected with consideration given to the maximum freestyle speed of the participants for 50 m, accuracy for speeds faster than 1.2 m/s were not evaluated because there was no participant who could perform at a speed higher than this. In previous studies, participants were elite swimmers which might influence high accuracy of estimating energy expenditure. Future studies are needed using recreational speeds. In addition, wearable watches were limited to two types to minimize discomfort to participants. Considering the fact that wearable watches, which provide swimming information, are continuously developing owing to recent technological development device types, speed, and swimming skills (elite vs. recreational swimmers) is needed in future studies.
Conclusions
This is the first study to investigate the accuracy of estimating energy expenditures from two commercially available wearable watches (Garmin and Apple) of freestyle swimming on swimmers. The error rate of lap counting and stroke counts at various swimming speed were within 10% for Apple and about 20% for Garmin. The criterion measurements and a 95% equivalence test showed that the lap counts and the strokes counts recorded by Apple were within the equivalence zone for all of the exercise intensities measured. Bland-Altman plot showed confidence intervals with relatively small deviations in lap counts and the stroke counts for Apple, and EE for Garmin. But the error rate of estimating energy expenditure was higher for Apple than for Garmin. The EEs of most swimming speeds from Apple were outside the equivalence zone except for at 1.2 m/s and were overestimated compared to the criteria. On the other hand, EEs of various swimming speeds from Garmin were within the equivalence zone except for 1.2 m/s. In conclusion, Apple and Garmin wearable watches accurately measure lap counts and stroke counts. However, the accuracy of estimating EE are poor at slow to medium swimming speed. Further improvement is needed to estimate energy expenditure of swimming at various speed.
References
American College of Sports Medicine. (2013). ACSM’s guidelines for exercise testing and prescription. Lippincott Williams & Wilkins.
American College of Sports Medicine. 2013. ACSM’s guidelines for exercise testing and prescription Lippincott Williams & Wilkins.Apple. (2017). About workout types. Retrieved from https://support.apple.com/en-us/HT207934
. Apple. 2017. About workout types Retrieved from https://support.apple.com/en-us/HT207934.Baldari, C., Fernandes, R. J., Meucci, M., Ribeiro, J., Vilas-Boas, J. P., & Guidetti, L. (2013). Is the new AquaTrainer® snorkel valid for VO2 assessment in swimming?. International Journal of Sports Medicine, 34(04), 336-344.
Baldari C., Fernandes R. J., Meucci M., Ribeiro J., Vilas-Boas J. P., et al, Guidetti L.. 2013;Is the new AquaTrainer® snorkel valid for VO2 assessment in swimming? International Journal of Sports Medicine 34(04):336–344. 10.1055/s-0032-1321804.Barbosa, T. M., Fernandes, R. J., Keskinen, K. L., Colaço, P., Cardoso, C., Silva, J., & Vilas-Boas, J. P. (2006). Evaluation of the energy expenditure in competitive swimming strokes. International Journal of Sports Medicine, 27(11), 894-899.
Barbosa T. M., Fernandes R. J., Keskinen K. L., Colaço P., Cardoso C., Silva J., et al, Vilas-Boas J. P.. 2006;Evaluation of the energy expenditure in competitive swimming strokes. International Journal of Sports Medicine 27(11):894–899. 10.1055/s-2006-923776.Brazeau, A. S., Karelis, A. D., Mignault, D., Lacroix, M. J., Prud'homme, D., & Rabasa-Lhoret, R. (2011). Accuracy of the SenseWear ArmbandTM during ergocycling. International Journal of Sports Medicine, 32(10), 761-764.
Brazeau A. S., Karelis A. D., Mignault D., Lacroix M. J., Prud'homme D., et al, Rabasa-Lhoret R.. 2011;Accuracy of the SenseWear ArmbandTM during ergocycling. International Journal of Sports Medicine 32(10):761–764. 10.1055/s-0031-1279768.Case, M. A., Burwick, H. A., Volpp, K. G., & Patel, M. S. (2015). Accuracy of smartphone applications and wearable devices for tracking physical activity data. JAMA, 313(6), 625-626.
Case M. A., Burwick H. A., Volpp K. G., et al, Patel M. S.. 2015;Accuracy of smartphone applications and wearable devices for tracking physical activity data. JAMA 313(6):625–626. 10.1001/jama.2014.17841.Chowdhury, E. A., Western, M. J., Nightingale, T. E., Peacock, O. J., & Thompson, D. (2017). Assessment of laboratory and daily energy expenditure estimates from consumer multi-sensor physical activity monitors. PloS One, 12(2), e0171720.
Chowdhury E. A., Western M. J., Nightingale T. E., Peacock O. J., et al, Thompson D.. 2017;Assessment of laboratory and daily energy expenditure estimates from consumer multi-sensor physical activity monitors. PloS One 12(2)e0171720. 10.1371/journal.pone.0171720.Craig, A. B., & Pendergast, D. R. (1979). Relationships of stroke rate, distance per stroke, and velocity in competitive swimming. Med Sci Sports, 11(3), 278-283
. Craig A. B., et al, Pendergast D. R.. 1979;Relationships of stroke rate, distance per stroke, and velocity in competitive swimming. Med Sci Sports 11(3):278–283.Dooley, E. E., Golaszewski, N. M., & Bartholomew, J. B. (2017). Estimating accuracy at exercise intensities: A comparative study of self-monitoring heart rate and physical activity wearable devices. JMIR mHealth and uHealth, 5(3), e34.
Dooley E. E., Golaszewski N. M., et al, Bartholomew J. B.. 2017;Estimating accuracy at exercise intensities: A comparative study of self-monitoring heart rate and physical activity wearable devices. JMIR mHealth and uHealth 5(3)e34. 10.2196/mhealth.7043.Eisenmann, J. C., Brisko, N., Shadrick, D., & Welsh, S. (2003). Comparative analysis of the Cosmed Quark b2 and K4b2 gas analysis systems during submaximal exercise. Journal of Sports Medicine and Physical Fitness, 43(2), 150.
Eisenmann J. C., Brisko N., Shadrick D., et al, Welsh S.. 2003;Comparative analysis of the Cosmed Quark b2 and K4b2 gas analysis systems during submaximal exercise. Journal of Sports Medicine and Physical Fitness 43(2):150.Erdogan, A., Cetin, C., Karatosun, H., & Baydar, M. L. (2010). Accuracy of the Polar S810iTM heart rate monitor and the Sensewear Pro ArmbandTM to estimate energy expenditure of indoor rowing exercise in overweight and obese individuals. Journal of Sports Science & Medicine, 9(3), 508.
Erdogan A., Cetin C., Karatosun H., et al, Baydar M. L.. 2010;Accuracy of the Polar S810iTM heart rate monitor and the Sensewear Pro ArmbandTM to estimate energy expenditure of indoor rowing exercise in overweight and obese individuals. Journal of Sports Science & Medicine 9(3):508.Evenson, K. R., Goto, M. M., & Furberg, R. D. (2015). Systematic review of the validity and reliability of consumer-wearable activity trackers. International Journal of Behavioral Nutrition and Physical Activity, 12(1), 159.
Evenson K. R., Goto M. M., et al, Furberg R. D.. 2015;Systematic review of the validity and reliability of consumer-wearable activity trackers. International Journal of Behavioral Nutrition and Physical Activity 12(1):159. 10.1186/s12966-015-0314-1.Ganzevles, S., Vullings, R., Beek, P. J., Daanen, H., & Truijens, M. (2017). Using tri-axial accelerometry in daily elite swim training practice. Sensors, 17(5), 990.
Ganzevles S., Vullings R., Beek P. J., Daanen H., et al, Truijens M.. 2017;Using tri-axial accelerometry in daily elite swim training practice. Sensors 17(5):990. 10.3390/s17050990.Garmin (2017). Fenix 3HR. Retrieved from https://buy.garmin.com/en-US/US/p/545480.
Garmin. 2017. Fenix 3HR Retrieved from https://buy.garmin.com/en-US/US/p/545480.Holmer, I. (1972). Oxygen uptake during swimming in man. Journal of Applied Physiology, 33(4), 502-509.
Holmer I.. 1972;Oxygen uptake during swimming in man. Journal of Applied Physiology 33(4):502–509.IDC. (2017). Xiaomi and Apple Tie for the Top Position as the Wearables Market Swells 17.9% During the First Quarter, According to IDC. Retrieved from https://www.idc.com/getdoc.jsp?containerId=prUS42707517.
IDC. 2017. Xiaomi and Apple Tie for the Top Position as the Wearables Market Swells 17.9% During the First Quarter, According to IDC Retrieved from https://www.idc.com/getdoc.jsp?containerId=prUS42707517.Lee, J. M., Kim, Y, Welk, G. J (2014). Validity of consumer-based physical activity monitors. Med Sci Sports Exerc, 46, 1840-1848.
Lee J. M., Kim Y, Welk G. J. 2014;Validity of consumer-based physical activity monitors. Med Sci Sports Exerc 46:1840–1848. 10.1249/mss.0000000000000287.Keskinen, K. L., Rodríguez, F. A., & Keskinen, O. P. (2003). Respiratory snorkel and valve system for breath‐by‐breath gas analysis in swimming. Scandinavian Journal of Medicine & Science in Sports, 13(5), 322–329.
Keskinen K. L., Rodríguez F. A., et al, Keskinen O. P.. 2003;Respiratory snorkel and valve system for breath‐by‐breath gas analysis in swimming. Scandinavian Journal of Medicine & Science in Sports 13(5):322–329. 10.1034/j.1600-0838.2003.00319.x.McLaughlin, J., King, G., Howley, E., Bassett, D., & Ainsworth, B. (2001). Validation of the Cosmed K4b2 portable metabolic system. International Journal of Sports and Medicine, 22, 280–284.
McLaughlin J., King G., Howley E., Bassett D., et al, Ainsworth B.. 2001;Validation of the Cosmed K4b2 portable metabolic system. International Journal of Sports and Medicine 22:280–284. 10.1055/s-2001-13816.Montpetit, R., Cazorla, G., & Lavoie, J. M. (1988). Energy expenditure during front crawl swimming: A comparison between males and females. Swimming Science V. Human Kinetics, Champaign, 101, 229–236.
Montpetit R., Cazorla G., et al, Lavoie J. M.. 1988;Energy expenditure during front crawl swimming: A comparison between males and females. Swimming Science V. Human Kinetics, Champaign 101:229–236.Mooney R, Corley G, Godfrey A, Osborough CD, Quinlan L,O Â Laighin G (2015) Application of video-based methods for competitive swimming analysis: a systematic review. Sports and Exercise Medicine, 1, 133–150.
Mooney R, Corley G, Godfrey A, Osborough CD, Quinlan L, O Â Laighin G. 2015;Application of video-based methods for competitive swimming analysis: a systematic review. Sports and Exercise Medicine 1:133–150.Mooney, R., Quinlan, L. R., Corley, G., Godfrey, A., Osborough, C., & ÓLaighin, G. (2017). Evaluation of the Finis Swimsense® and the Garmin Swim™ activity monitors for swimming performance and stroke kinematics analysis. PloS One, 12(2), e0170902.
Mooney R., Quinlan L. R., Corley G., Godfrey A., Osborough C., et al, ÓLaighin G.. 2017;Evaluation of the Finis Swimsense® and the Garmin Swim™ activity monitors for swimming performance and stroke kinematics analysis. PloS One 12(2)e0170902. 10.1371/journal.pone.0170902.Nordsborg, N. B., Espinosa, H. G., & Thiel, D. V. (2014). Estimating energy expenditure during front crawl swimming using accelerometers. Procedia Engineering, 72, 132–137.
Nordsborg N. B., Espinosa H. G., et al, Thiel D. V.. 2014;Estimating energy expenditure during front crawl swimming using accelerometers. Procedia Engineering 72:132–137. 10.1016/j.proeng.2014.06.024.Pendergast, D. R., Di Prampero, P. E., Craig Jr, A. B., Wilson, D. R., & Rennie, D. W. (1977). Quantitative analysis of the front crawl in men and women. Journal of Applied Physiology, 43(3), 475–479.
Pendergast D. R., Di Prampero P. E., Craig Jr A. B., Wilson D. R., et al, Rennie D. W.. 1977;Quantitative analysis of the front crawl in men and women. Journal of Applied Physiology 43(3):475–479. 10.1152/jappl.1977.43.3.475.Stahl, S. E., An, H. S., Dinkel, D. M., Noble, J. M., & Lee, J. M. (2016). How accurate are the wrist-based heart rate monitors during walking and running activities? Are they accurate enough? BMJ Open Sport & Exercise Medicine, 2(1), e000106.
Stahl S. E., An H. S., Dinkel D. M., Noble J. M., et al, Lee J. M.. 2016;How accurate are the wrist-based heart rate monitors during walking and running activities? Are they accurate enough? BMJ Open Sport & Exercise Medicine 2(1)e000106.Wallen, M. P., Gomersall, S. R., Keating, S. E., Wisløff, U., & Coombes, J. S. (2016). Accuracy of heart rate watches: implications for weight management. PLoS One, 11(5), e0154420.
Wallen M. P., Gomersall S. R., Keating S. E., Wisløff U., et al, Coombes J. S.. 2016;Accuracy of heart rate watches: implications for weight management. PLoS One 11(5)e0154420. 10.1371/journal.pone.0154420.Zamparo, P., Bonifazi, M., Faina, M., Milan, A., Sardella, F., Schena, F., & Capelli, C. (2005). Energy cost of swimming of elite long-distance swimmers. European Journal of Applied Physiology, 94(5–6), 697–704.
Zamparo P., Bonifazi M., Faina M., Milan A., Sardella F., Schena F., et al, Capelli C.. 2005;Energy cost of swimming of elite long-distance swimmers. European Journal of Applied Physiology 94(5–6):697–704. 10.1007/s00421-005-1337-0.