Evaluating and comparing the effect of high intensity interval training vs. low intense, longer-lasting training on endurance performance in recreational runners.
Article information
Abstract
This study evaluates and compares the effect on endurance performance between high intensity interval training (ITG) and low intensity, longer-lasting training (CTG) with twice longer training time than ITG. We selected 22 healthy, non-smoking young men and women in a randomised trial to undertake either low intensity continuous training at 75% of maximal heart rate (HRmax) for 75 minutes or high intensity interval training at 90–95% HRmax, to undertake training either low intensity or high intensity three times a week for eight weeks. Performance times for running 3000 metres improved in both groups. Effect size between groups was 0.95 in favour of the ITG. Maximal oxygen uptake (VO2max), running economy (RE) and speed at ventilatory threshold (VTh) improved in both groups. VO2max and speed at VTh improved significantly more in the ITG. RE did not differ between the groups. The result of this study indicate that high intensity training is more effective and time efficient in improving performance in recreational runners than low intensity continuous training.
Introduction
A recreational athlete can be defined as a person who is physical active, but does not train for competition at the same level of intensity and focus as a competitive athlete (Laquale, 2009). Recreational athletes take part in exercise for various reasons such as improving health and physical fitness, while others exercise to participate in low-level competitions. The effect of physical activity on health related parameters is undoubtedly large, and there are evidence suggesting that there are greater improvements after high intensity training than low to moderate training when volume of training is held constant (Garber et al., 2011). How different levels of training intensity and training volume affect running performance in recreational athletes are however, less studied.
To enhance performance, both low intensity training with high volume and high intensity interval training must be an important part of endurance training programs (Laursen, 2010). Studies examining training intensity distribution in endurance athletes show that approximately 75 to 80% of training is performed at a low intensity (below the anaerobic threshold), and between 8% and 17% of training is performed above the anaerobic threshold (Seiler & Kjerland, 2006). For highly trained athletes with large training volume (i.e. 10-25 h/wk.), polarized training with a large percentage of low intensity training might be necessary to gain optimal training adaptions (Seiler, 2010; Stoggl & Sperlich, 2014) and to avoid overtraining (Foster, 1998). For recreational runners, exercising 3 times per week (i.e. 3-5 hours per week), overtraining is not likely because they have greater recovery time between exercise sessions. There is evidence suggesting that polarized training might be beneficial even for recreational athletes (Munoz et al., 2014). However, high volume training is time consuming, and one of the most common barriers to regular exercise training is lack of time (Trost et al., 2002). Therefore, it is important to develop time-efficient training programs that improve both aerobic fitness and performance. In order to give optimal advice regarding training distribution for recreational runners, it is important to have more knowledge about how various training methods affect performance separately.
The running speed at the threshold is a strong indicator of performance in distance races, as it integrates both maximal oxygen uptake (VO2max),% VO2max, and running economy (RE) (Bassett & Howley, 2000). Previous studies reported a close relationship between running speed at the lactate threshold and 3000-metre performance time (Grant et al., 1997; Yoshida et al., 1993). Additionally, previous studies indicated that increased speed at the lactate threshold is a result of increased VO2max and improved RE (Helgerud et al., 2001; Helgerud et al., 2007). Studies comparing high and low intensity training have shown largest improvements after high intensity training in VO2max when intensity, duration, and frequency are adjusted so that calorie expenditure is equal (isocaloric) (Helgerud et al., 2007). In these studies, RE improves equally while the percentage of VO2max remains unchanged. Nevertheless, despite larger improvements in VO2max, the speed at the lactate threshold did not differ between groups in Helgerud et al. (2007). The impact on performance is thus difficult to assess. Effective utilisation of available energy promotes good performance in endurance sports. Helgerud (1994) demonstrated that superior RE, because of additional running training, can compensate for lower VO2max. Because total work performed seems to be the most important stimulus to improve RE (Enoksen et al., 2011; Helgerud et al., 2007), it is reasonable to assume that a high volume of exercise at a lower intensity will enhance endurance performance independently of high intensity training due to larger improvements in RE.
In recreational runners, there is still a lack of understanding of how high intensity interval training vs. low intensity with prolonged duration affects endurance performance. Bangsbo et al. (2009) and Gunnarsson and Bangsbo (2012) investigated the effect of reduced training volume and increased intensity carried out as interval training. In both studies, performance improved, probably due to increased VO2max. Helgerud et al. (2007) demonstrated superior effect on VO2max in both 15 times 15-second intervals and 4 times 4 minutes interval at 90-95 % of HRmax, when compared to low intensity continuous training. This study did however, not measure endurance performance. In accordance with this, Seiler et al. (2013) found that high intensity interval training give larger adaptions than continuous training with lower intensity on VO2max and time to exhaustion. Hottenrott et al. (2012) demonstrated larger improvements in VO2peak, but no differences in half marathon performance were found when comparing high intensity interval training and continuous training at lower intensity. Hottenrott et al. (2012) did not report RE, and the effect of the different training methods is not known. Thus, the impact of longer-lasting low intensity exercise versus high intensity interval exercise on endurance performance remains uncertain. To our knowledge, the present study is the first to compare the effect of high intensity interval training with low intensity continuous training with twice as long training time on both physiological parameters VO2max, RE, VTh, speed at VTh and endurance performance in recreational runners. This can provide greater understanding of how intensity and volume of training affect physiological parameters and how they in turn affect performance in recreational runners.
Accordingly, this study aims to evaluate and compare the effect on endurance performance of high intensity interval training and continuous, longer-lasting, low intensity training, with twice as long training time. Based on the results from previous research (Helgerud et al., 2007) on the VO2max, RE and lactate threshold variables, we hypothesised that high intensity interval training would improve endurance performance more effectively than longer-lasting, low intensity training.
Materials and Methods
Subjects
We recruited 22 healthy men (n = 8) and women (n = 14) between 23 and 30 years of age to participate in the study (Table 1.) using announcements in the local newspapers and the university/college web pages. We included both sexes based on previous studies’ demonstrating that physiological adaptions from endurance training are not gender specific for this age range according to ACSM ("American College of Sports Medicine Position Stand. The recommended quantity and quality of exercise for developing and maintaining cardiorespiratory and muscular fitness, and flexibility in healthy adults," 1998). We use the following inclusion criteria: (1) absence of any known disease, based on self-reporting, (2) no exercise limitations, and (3) non-smoking. All participants participated in endurance training and other active leisure time pursuits at least once or twice a week; they were also familiar with running on a treadmill. The Regional Committee for Medical Research Ethics approved the study, and the study conformed to the declaration of Helsinki. All participants reviewed and signed informed written consent forms prior to participation. Sixteen of the 22 participants completed the study. One participant was not able to complete the VO2max test because of discomfort from the facemask. During the training period, two participants in the ITG and three participants in the CTG dropped out of the study because of illness, injury, or personal reasons not related to the study.

Mean ± SD. The table shows the anthropometric data of the subjects at inclusion.
Experimental approach
This study employed a pre-test/post-test randomised group design using two training groups to investigate the effects of the different training protocols. After pre-testing, we randomly assigned the participants to one of two training groups: a CTG with lengthy, low intensity training (75% HRmax) and an ITG (90‒95% HRmax).
In order to compare participants with different body mass, VO2 should be expressed as mL∙kg-0.75∙min-1 when running (Svedenhag, 1995). As the current study included both sexes, VO2max is expressed in relation to body mass raised to the power of 0.75 (Svedenhag, 1995).
Procedures
We used a treadmill (Life Fitness, Italy) calibrated for speed at an inclination of 5% to measure all physical capacity parameters. We recorded VTh as an indicator of the anaerobic threshold. The test started with a warm-up period of 10 minutes at approximately 60% of predicted VO2max. To determine VTh, the participants ran at a maximum of five increasing intensities for five minutes at 60 to 95% of VO2max. We ensured that running speeds were identical in the pre- and post-training tests to determine VTh for each individual. We determined VTh as the point at which pulmonary ventilation increased disproportionately with oxygen consumption. For all participants, the protocol included one five minute step at 7 km∙h-1 in order to determine RE. After testing for VTh and RE, participants continued to run on the treadmill. We increased the speed every minute until reaching VO2max (between three to six minutes). Oxygen consumption was measured every 10 seconds throughout the test (Cortex Metamax II (Cortex Biophysik GmbH, Leipzig, Germany). Metamax II has been validated against the Douglas bag technique (Larsson et al., 2004). We drew blood from the participants’ fingertips to measure [La-]b immediately after each participant reached VO2max (Lactate Scout + SensLab, GmbH, Leipzig, Germany). Together with VO2, we recorded HR during the whole test with Polar Accurex heart rate monitors (Polar Electro, Finland). HRmax is determined as the highest HR during the final minute.
Performance test for 3000 metres
To evaluate endurance performance, we used a 3000 metres running test with a treadmill inclination at 5% and a self-determined speed. We used Polar Accurex heart rate monitors (Polar Electro, Finland) to ensure that intensity did not differ significantly from pre- to post-training. The 3000 metres running test is included as a standard test in all Nordic forces to evaluate endurance performance and physical fitness (Malmberg, 2011). Previous studies report a close relationship between running speed at the lactate threshold and 3000-metre performance time (Grant et al., 1997; Yoshida et al., 1993). Speed at the lactate threshold integrates both VO2max, % VO2max, and work economy (Bassett & Howley, 2000). We therefor selected 3000 metres running test as performance measure.
Training interventions
All participants performed 24 sessions. The participants ran on a treadmill three times a week over a period of eight weeks. To ensure that the intensity of exercise was appropriate, we measured the heart rate in each session.
1. CTG: Continuous run at 75% of HRmax (137±7 beats per min-1) for 75 min. A total of 3 hours and 45 minutes per week.
2. ITG: 4 x 4 min interval training at 90 to 95% HRmax (180‒190±5 beats per min-1) with three-minute active resting periods at 70% HRmax (140±6 beats per min-1) between each interval. The exercise started with a 10-minute warm-up and finished with three minutes cooling down at 70% HRmax. Participants spent a total of 1 hour and 54 minutes per week on the exercise.
Total training volume in each training session was approximately 60% higher in the CTG than in the ITG, twice of the total training time. This calculation is based on the relationship between% HRmax and% VO2max established by the American College of Sports Medicine (ACSM) (Swain et al., 1994), which states that 70, 85, and 92.5% HRmax can be used as indices for 60, 80 and 87.5% VO2max.
Statistical analyses
We performed statistics with SPSS 19 (Statistical Package for Social Science, Chicago, USA). We presented data as mean ± standard deviation (SD). Due to the close relationship between VO2max and endurance performance (Bassett & Howley, 2000), sample size calculations are based on previous data reported for VO2max with comparable training interventions (Helgerud et al., 2007). With an expected improvement of 14 mL∙kg-0.75∙min-1 and standard deviation between 19 and 20, according to sample size tables for clinical studies, we needed 10 participants in each group. With a standardised difference of 1.0, differences within groups can be detected using a paired-sample t-test with 80% power at a significance level of 5% (Machin, 2009). Assumption of normally distributed data was made from Q-Q plots.
We used Dependent t-test to determine changes within groups. We determined differences between groups with independent t-test. To investigate the magnitude of the effect in the case of within-group and between-group comparisons, effect size (ES) was calculated in the form of Cohen’s d (Cumming, 2012) for primary outcome variables. Effect size of 0.2 is regarded small, 0.5 medium and 0.8 large (Cumming, 2012). To investigate the impact of the variables VO2max, VTh, and work economy on 3000-metre running performance for the total sample, we used multiple regression analysis. The partial correlation coefficient (partial r) was calculated. We considered a two-tailed P < 0.05 significant for all tests.
Results
Performance time at 3000 metres improved in both groups, ES (1.37) in the ITG as opposed to ES (0.98) in the CTG (Figure 1 and Table 2). Effect size between groups was 0.95. The difference was non-significant (P = 0.09).
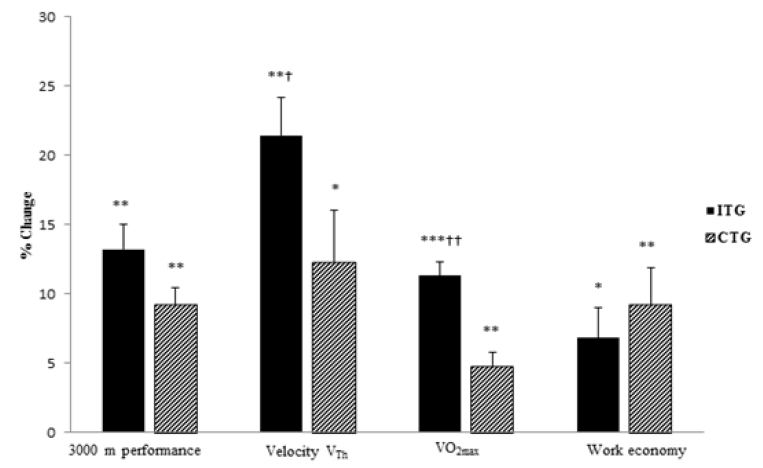
Percentage change in 3000 metre performance; speed at VTh, VO2max (mL∙ kg-0.75∙ min-1) and work economy from pre- to post-training for each of the groups presented as mean and SE. Significantly different from pre- to post-training: * =P<0.05; ** =P<0.01; and *** = P<0.001. Significant difference between groups: † =P<0.05 and †† = P<0.01.

Changes in physiological parameters and endurance performance from pre- to post training
Maximal oxygen uptake increased in both ITG (ES 4.02) (P = 0.000) and CTG (ES 1.59) (P = 0.008) (Figure 1 and Table 2). The increase was significantly higher in the ITG compared to the CTG (ES 2.44) (P = 0.000).
Because the gender distribution was not identical, we compared the training responses of female and males in the low and high intensity groups and found that they was similar (∆ VO2max 4.4 ± 2.5% vs. 5.6 ± 4.3%) between female and males in the CTG and (∆ VO2max 11.6 ± 5.0% vs. 11.3 ± 0.9%) between female and male in the ITG. For 3000 meters performance test the result was (∆ 3000 meters 8.6 ± 1.9% vs. 10.3 ± 5.2%) between female and male in CTG and (∆ 3000 meters 12.6 ± 4.6% vs. 13.6 ± 6.1%) between female and male in ITG.
RE improved significantly in both CTG (ES 0.99) (P = 0.003) and ITG (ES 0.60) (P = 0.039) (Figure 1 and Table 2). We found no significant (P = 0.48) differences between the two training groups in this regard (ES 0.38).
Running speed at VTh increased significantly in both ITG (ES 1.71) (P = 0.000) and CTG (ES 0.88) (P = 0.012) (Figure 1 and Table 2). The increase was significantly higher in the ITG (ES 1.23) (P = 0.037). There was no change in VTh expressed as percentage VO2max in either group.
Multiple regression analysis showed a significant correlation between VO2max (mL • kg-0.75 • min-1) and 3000 metre performance (Table 3). We found no significant relationship between RE and 3000-metre performance time (Table 3).

Relationship between 3000-meter performance time and the predictor variables, VO2max, RE and VTh, at pre- and post-training. Multiple regression analysis.
Discussion
The results show that both groups improved their 3000-metre running time significantly (Table 2). Running time improved by 3.06 minutes and 1.59 minutes for the ITG and CTG, respectively. Effect size is large in both groups and shows that both training protocols have qualities that enhance endurance performance. However, the ITG improved the 3000-metre race test time on average by 1 minute and 7 seconds more than the CTG. Despite a non-significant difference (P = 0.09), there is a large ES between groups (0.95) in favour of the ITG. From a performance point of view, this is a meaningful difference. Increased VO2max, speed at VT, maximal speed at VO2max, and improved RE (Table 2) seem to reflect improved performance.
VO2max sets the upper limit for endurance events and is an important determining factor for endurance performance (Bassett & Howley, 2000). In the present study, the ITG improved their VO2max by 11.3% as opposed to a 4.7% improvement in the CTG (Figure 1). Studies on isocaloric exercise show that high intensity exercise improves VO2max more than low intensity exercise (Helgerud et al., 2007). However, it has been suggested in an ACSM position stand ("American College of Sports Medicine Position Stand. The recommended quantity and quality of exercise for developing and maintaining cardiorespiratory and muscular fitness, and flexibility in healthy adults," 1998) that a longer duration of exercise could compensate for lower exercise intensity. Low intensity training with high volume represents approximately 75% of endurance athletes’ total exercise volume (Seiler & Kjerland, 2006). The present study shows that despite an approximately 60% greater exercise volume, that is, twice as long exercise time in the CTG, the improvement in VO2max is significantly lower with an effect size between groups of 2.44 in favour of the ITG (P = 0.000) (Table 2.). Our findings suggest that longer duration cannot compensate for higher intensity when aiming to improve VO2max. However, the low intensity group in Helgerud et al. (2007) is comparable to the present study in both the initial fitness level of the participants, intensity, and frequency of exercise. In this study, exercising at 70% HRmax for 45 minutes gave no improvement in VO2max. However, in the present study, VO2max improved significantly by 4.7% in the CTG. In line with some previous studies (Duscha et al., 2005; Mandigout et al., 2002; Seiler et al., 2013), our findings suggest that as long as exercise intensity is maintained at a sufficient level to give improvements in VO2max, the positive effect will be enhanced by increasing the duration of the exercise and thus the total exercise load. Consequently, extending training volume improves endurance performance through increased VO2max together with improved RE.
RE is considered an important determinant of endurance performance (Bassett & Howley, 2000; Saunders et al., 2004), and it may have the potential to compensate for a higher VO2max (Helgerud, 1994). RE improved significantly within both groups, and we observed no significant differences between groups (ES 0.38). However, a greater ES in the CTG (ES 0.99) compared with the ITG (ES 0.60) does indicate a somewhat greater impact on work economy in this training group (Table 2). Due to previous research (Enoksen et al., 2011; Helgerud et al., 2007), we expected improved RE in both groups. However, due to the greater exercise volume performed by the CTG, one would expect it to have achieved a greater improvement than the ITG. Although both groups made significant improvements to their RE, the exercise period might have been too short to reveal differences between groups. Future studies should examine the effect of longer exercise periods.
The running speed at the threshold is a strong indicator of performance in distance races, as it integrates both VO2max, % VO2max, and work economy (Bassett & Howley, 2000). In this study, the speed at VTh increased more in the ITG than in the CTG (ES 1.23) (P = 0.037). Running speed at VTh increased by 21.4% (ES 1.71) versus 12.3% (ES 0.88) from pre-test to post-test in the ITG and CTG, respectively, without any changes in % of VO2max. The findings of the present study, in line with some previous studies (Helgerud et al., 2007), indicate that running speed at VTh is increased as a result of improved VO2max and RE. Enoksen et al. (2011) observed improved running speed at the lactate threshold without changes in VO2max. The authors explained the improvement with improved RE. In a group of football players, Faude et al. (2013) reported larger improvements in running speed at threshold after low intensity high volume training compared to high intensity intervals. In the present study, VO2max and work economy improved in both groups, and the lack of improvements in VTh (% VO2max) indicates that increased running speed at VTh is a consequence of improved VO2max and RE. However, RE did not differ largely between the groups, only a low to moderate ES, in favour of the CTG. Greater increase in running speed observed in the ITG seems to accrue from larger improvements in VO2max. The initial level of fitness is lower in our study than in the study from Enoksen et al. (2011), which included highly trained athletes. The potential for improvements in VO2max is greater in less fit subjects (Swain & Franklin, 2002), and this may explain why VO2max seems to be a larger contributor to improved running speed at VTh in the present study. However, the result is in contrast to Helgerud et al. (2007) and Hottenrott et al. (2012), which found equally improved running speed at lactate threshold despite a larger improvement in VO2max and equal improvements in RE (Helgerud et al., 2007). The reason for this discrepancy is not apparent. However, Hottenrott et al. (2012) did not report work economy. Since the initial fitness level is somewhat lower compared to the present study, it is possible that improvements in RE are a larger contributor to the improved running speed at lactate threshold. Additionally, VO2max increases to a larger extent in the present study than in both Helgerud et al. (2007) and Hottenrott et al. (2012). This may explain some of the discrepancy.
When controls are made for the predictor variables VO2max, work economy, and VTh, there is a significant correlation between VO2max and 3000 metre performance at both pre- (P = 0.002)) and post-training (P = 0.0001). Neither RE nor VTh correlates well with performance in this study (Table 3). VO2max can therefore explain a large part of the improvement in 3000-metre performance. The lack of correlation between RE and 3000-metre performance time is in contrast to earlier data (Conley & Krahenbuhl, 1980; Saunders et al., 2004). These studies examined individuals with similar levels of VO2max. The large individual differences in VO2max in this study may explain the discrepancies.
Training programs should integrate both high intensity interval training and longer lasting, low intensity exercise. However, unlike highly trained athletes, who perform 75% of their total training volume at low intensity (Seiler & Kjerland, 2006); it is likely that recreational runners will benefit from a larger portion of high intensity interval training. The participants in the present study were all regularly active recreational runners exercising once or twice a week. The VO2max values at pre-testing (51.67 mL∙kg-1∙min-1 in CTG and 53.89 mL∙kg-1∙min-1 in ITG) of the participants corresponds well with the level of VO2max in previous studies of recreational athletes, 55-60 mL∙kg-1∙min-1 in Helgerud et al. (2007), and 51-55 mL∙kg-1∙min-1 in Seiler et al. (2013). Since the gender distribution was not identical between groups, we analysed the effect of training on VO2max and 3000 meters performance between female and males in the low and high intensity groups. Consistent with ACSM ("American College of Sports Medicine Position Stand. The recommended quantity and quality of exercise for developing and maintaining cardiorespiratory and muscular fitness, and flexibility in healthy adults," 1998) and Seiler et al (2013) we found no evidence of different response between the genders. The result of the present study shows that, for recreational runners at this level of fitness, high intensity interval training is more effective than low intensity training in improving physiological factors such as VO2max, speed at VTh, and maximal speed at VO2max (Table 2.). The large effect size between groups also indicates larger improvements in performance in the ITG. The training intervention in the present study consist of 4-minute bouts at intensity between 90-95 % HRmax. The 3-minute periods at 70 % HRmax makes it possible to accumulate 16 minutes at high intensity. The main effect of high intensity interval training is larger improvements in VO2max because of larger stimuli of the cardiovascular system, and in particular, the cardiac output (Helgerud et al. 2007). Considering the limited total training stimulus among recreational runners, high intensity training is more effective and time efficient. However, a limitation to this study is the brief training period. As training proceeds, adaptions to training may change. When level of fitness improves, the potential for further improvements in VO2max is smaller (Swain & Franklin, 2002). Consequently, further improvements in running speed at VTh and performance may depend to a larger degree on improvements in RE from low intensity high volume training. Further research on the effect and interaction of various intensities and volumes of training seems needed. More knowledge in this area may help to provide better advice on the distribution of various training methods to athletes at different levels.
Conclusion and practical application
The results of the present study show that both high intensity training as well as longer-lasting low intensity training with twice as long training time led to improved running performance, increased VO2max, speed at VTh, RE and maximal speed at VO2max. The result showed a large effect size between groups in 3000-metre running performance time. Together with significantly greater improvement in VO2max, running speed at VTh, and maximal speed at VO2max in the ITG, this indicate that high intensity intervals are more effective and time efficient in improving physical capacity and running performance among recreational runners than longer lasting low intensity training.
References
American College of Sports Medicine Position Stand. The recommended quantity and quality of exercise for developing and maintaining cardiorespiratory and muscular fitness, and flexibility in healthy adults. (1998). Med Sci Sports Exerc, 30(6), 975-991.
American College of Sports Medicine Position Stand. The recommended quantity and quality of exercise for developing and maintaining cardiorespiratory and muscular fitness, and flexibility in healthy adults. 1998;Med Sci Sports Exerc 30(6):975–991.Bangsbo, J., Gunnarsson, T. P., Wendell, J., Nybo, L., & Thomassen, M. (2009). Reduced volume and increased training intensity elevate muscle Na+-K+ pump alpha2-subunit expression as well as shortand long-term work capacity in humans. J Appl Physiol (1985), 107(6), 1771-1780.
Bangsbo J., Gunnarsson T. P., Wendell J., Nybo L., et al, Thomassen M.. 2009;Reduced volume and increased training intensity elevate muscle Na+-K+ pump alpha2-subunit expression as well as shortand long-term work capacity in humans. J Appl Physiol (1985) 107(6):1771–1780.Bassett, D. R., Jr., & Howley, E. T. (2000). Limiting factors for maximum oxygen uptake and determinants of endurance performance. Med Sci Sports Exerc, 32(1), 70-84.
Bassett D. R. Jr., et al, Howley E. T.. 2000;Limiting factors for maximum oxygen uptake and determinants of endurance performance. Med Sci Sports Exerc 32(1):70–84.Conley, D. L., & Krahenbuhl, G. S. (1980). Running economy and distance running performance of highly trained athletes. Med Sci Sports Exerc, 12(5), 357-360.
Conley D. L., et al, Krahenbuhl G. S.. 1980;Running economy and distance running performance of highly trained athletes. Med Sci Sports Exerc 12(5):357–360. 10.1249/00005768-198025000-00010.Cumming, G. (2012). Understanding the new statistics: effect sizes, confidence intervals, and meta-analysis. New York: Routledge.
Cumming G.. 2012. Understanding the new statistics: effect sizes, confidence intervals, and meta-analysis New York: Routledge.Duscha, B. D., Slentz, C. A., Johnson, J. L., Houmard, J. A., Bensimhon, D. R., Knetzger, K. J., & Kraus, W. E. (2005). Effects of exercise training amount and intensity on peak oxygen consumption in middle-age men and women at risk for cardiovascular disease. Chest, 128(4), 2788-2793.
Duscha B. D., Slentz C. A., Johnson J. L., Houmard J. A., Bensimhon D. R., Knetzger K. J., et al, Kraus W. E.. 2005;Effects of exercise training amount and intensity on peak oxygen consumption in middle-age men and women at risk for cardiovascular disease. Chest 128(4):2788–2793. 10.1378/chest.128.4.2788.Enoksen, E., Shalfawi, S. A., & Tonnessen, E. (2011). The effect of high- vs. low-intensity training on aerobic capacity in well-trained male middle-distance runners. J Strength Cond Res, 25(3), 812-818.
Enoksen E., Shalfawi S. A., et al, Tonnessen E.. 2011;The effect of high- vs. low-intensity training on aerobic capacity in well-trained male middle-distance runners. J Strength Cond Res 25(3):812–818. 10.1519/jsc.0b013e3181cc2291.Faude, O., Schnittker, R., Schulte-Zurhausen, R., Muller, F., & Meyer, T. (2013). High intensity interval training vs. high-volume running training during pre-season conditioning in high-level youth football: a cross-over trial. J Sports Sci, 31(13), 1441-1450.
Faude O., Schnittker R., Schulte-Zurhausen R., Muller F., et al, Meyer T.. 2013;High intensity interval training vs. high-volume running training during pre-season conditioning in high-level youth football: a cross-over trial. J Sports Sci 31(13):1441–1450. 10.1080/02640414.2013.792953.Foster, C. (1998). Monitoring training in athletes with reference to overtraining syndrome. Med Sci Sports Exerc, 30(7), 1164-1168.
Foster C.. 1998;Monitoring training in athletes with reference to overtraining syndrome. Med Sci Sports Exerc 30(7):1164–1168. 10.1097/00005768-199807000-00023.Garber, C. E., Blissmer, B., Deschenes, M. R., Franklin, B. A., Lamonte, M. J., Lee, I. M., . . . American College of Sports, M. (2011). American College of Sports Medicine position stand. Quantity and quality of exercise for developing and maintaining cardiorespiratory, musculoskeletal, and neuromotor fitness in apparently healthy adults: guidance for prescribing exercise. Med Sci Sports Exerc, 43(7), 1334-1359. doi:10.1249/MSS.0b013e318213fefb
. Garber C. E., Blissmer B., Deschenes M. R., Franklin B. A., Lamonte M. J., Lee I. M., et al, American College of Sports M.. 2011;American College of Sports Medicine position stand. Quantity and quality of exercise for developing and maintaining cardiorespiratory, musculoskeletal, and neuromotor fitness in apparently healthy adults: guidance for prescribing exercise. Med Sci Sports Exerc 43(7):1334–1359. 10.1249/MSS.0b013e318213fefb.Grant, S., Craig, I., Wilson, J., & Aitchison, T. (1997). The relationship between 3 km running performance and selected physiological variables. J Sports Sci, 15(4), 403-410.
Grant S., Craig I., Wilson J., et al, Aitchison T.. 1997;The relationship between 3 km running performance and selected physiological variables. J Sports Sci 15(4):403–410. 10.1080/026404197367191.Gunnarsson, T. P., & Bangsbo, J. (2012). The 10-20-30 training concept improves performance and health profile in moderately trained runners. J Appl Physiol (1985), 113(1), 16-24.
Gunnarsson T. P., et al, Bangsbo J.. 2012;The 10-20-30 training concept improves performance and health profile in moderately trained runners. J Appl Physiol (1985) 113(1):16–24. 10.1152/japplphysiol.00334.2012.Helgerud, J. (1994). Maximal oxygen uptake, anaerobic threshold and running economy in women and men with similar performances level in marathons. Eur J Appl Physiol Occup Physiol, 68(2), 155-161.
Helgerud J.. 1994;Maximal oxygen uptake, anaerobic threshold and running economy in women and men with similar performances level in marathons. Eur J Appl Physiol Occup Physiol 68(2):155–161. 10.1007/bf00244029.Helgerud, J., Engen, L. C., Wisloff, U., & Hoff, J. (2001). Aerobic endurance training improves soccer performance. Med Sci Sports Exerc, 33(11), 1925-1931.
Helgerud J., Engen L. C., Wisloff U., et al, Hoff J.. 2001;Aerobic endurance training improves soccer performance. Med Sci Sports Exerc 33(11):1925–1931. 10.1097/00005768-200111000-00019.Helgerud, J., Hoydal, K., Wang, E., Karlsen, T., Berg, P., Bjerkaas, M., . . . Hoff, J. (2007). Aerobic high-intensity intervals improve VO₂max more than moderate training. Med Sci Sports Exerc, 39(4), 665-671.
Helgerud J., Hoydal K., Wang E., Karlsen T., Berg P., Bjerkaas M., et al, Hoff J.. 2007;Aerobic high-intensity intervals improve VO2max more than moderate training. Med Sci Sports Exerc 39(4):665–671. 10.1249/mss.0b013e3180304570.Hottenrott, K., Ludyga, S., & Schulze, S. (2012). Effects of high intensity training and continuous endurance training on aerobic capacity and body composition in recreationally active runners. J Sports Sci Med, 11(3), 483-488.
Hottenrott K., Ludyga S., et al, Schulze S.. 2012;Effects of high intensity training and continuous endurance training on aerobic capacity and body composition in recreationally active runners. J Sports Sci Med 11(3):483–488.Larsson, P. U., Wadell, K. M., Jakobsson, E. J., Burlin, L. U., & Henriksson-Larsen, K. B. (2004). Validation of the MetaMax II portable metabolic measurement system. Int J Sports Med, 25(2), 115-123.
Larsson P. U., Wadell K. M., Jakobsson E. J., Burlin L. U., et al, Henriksson-Larsen K. B.. 2004;Validation of the MetaMax II portable metabolic measurement system. Int J Sports Med Int J Sports Med(2):115–123.Laursen, P. B. (2010). Training for intense exercise performance: high-intensity or high-volume training? Scand J Med Sci Sports, 20 Suppl 2, 1-10.
Laursen P. B.. 2010;Training for intense exercise performance: high-intensity or high-volume training? Scand J Med Sci Sports 20 Suppl 2:1–10. 10.1111/j.1600-0838.2010.01184.x.Laquale, K. (2009) Nutritional needs of the recreatioanl athlete. Human Kinetics-Att, 14(1), 112-115.
Laquale K.. 2009;Nutritional needs of the recreatioanl athlete. Human Kinetics-Att 14(1):112–115. 10.1123/att.14.1.12.Machin, D. (2009). Sample size tables for clinical studies. Chichester, UK: Wiley-Blackwell.
Machin D.. 2009;Sample size tables for clinical studies. Chichester UK: Wiley-Blackwell;Mandigout, S., Melin, A., Lecoq, A. M., Courteix, D., & Obert, P. (2002). Effect of two aerobic training regimens on the cardiorespiratory response of prepubertal boys and girls. Acta Paediatr, 91(4), 403-408.
Mandigout S., Melin A., Lecoq A. M., Courteix D., et al, Obert P.. 2002;Effect of two aerobic training regimens on the cardiorespiratory response of prepubertal boys and girls. Acta Paediatr 91(4):403–408. 10.1111/j.1651-2227.2002.tb01662.x.Malmberg J. (2011) Physical Fitness Tests in the Nordic Armed Forces- A Description of Basic Test
. Malmberg J.. 2011. Physical Fitness Tests in the Nordic Armed Forces- A Description of Basic TestProtocols. Moving Soldiers - Soldaten i bevegelse. 2011(01).
Protocols. Moving Soldiers - Soldaten i bevegelse 2011(01)Munoz, I., Seiler, S., Bautista, J., Espana, J., Larumbe, E., & Esteve-Lanao, J. (2014). Does polarized training improve performance in recreational runners? Int J Sports Physiol Perform, 9(2), 265-272.
Munoz I., Seiler S., Bautista J., Espana J., Larumbe E., et al, Esteve-Lanao J.. 2014;Does polarized training improve performance in recreational runners? Int J Sports Physiol Perform 9(2):265–272.Saunders, P. U., Pyne, D. B., Telford, R. D., & Hawley, J. A. (2004). Factors affecting running economy in trained distance runners. Sports Med, 34(7), 465-485.
Saunders P. U., Pyne D. B., Telford R. D., et al, Hawley J. A.. 2004;Factors affecting running economy in trained distance runners. Sports Med 34(7):465–485. 10.2165/00007256-200434070-00005.Seiler, K. S., & Kjerland, G. O. (2006). Quantifying training intensity distribution in elite endurance athletes: is there evidence for an "optimal" distribution? Scand J Med Sci Sports, 16(1), 49-56.
Seiler K. S., et al, Kjerland G. O.. 2006;Quantifying training intensity distribution in elite endurance athletes: is there evidence for an "optimal" distribution? Scand J Med Sci Sports 16(1):49–56. 10.1111/j.1600-0838.2004.00418.x.Seiler, S. (2010). What is best practice for training intensity and duration distribution in endurance athletes? Int J Sports Physiol Perform, 5(3), 276-291.
Seiler S.. 2010;What is best practice for training intensity and duration distribution in endurance athletes? Int J Sports Physiol Perform 5(3):276–291. 10.1123/ijspp.5.3.276.Seiler, S., Joranson, K., Olesen, B. V., & Hetlelid, K. J. (2013). Adaptations to aerobic interval training: interactive effects of exercise intensity and total work duration. Scand J Med Sci Sports, 23(1), 74-83.
Seiler S., Joranson K., Olesen B. V., et al, Hetlelid K. J.. 2013;Adaptations to aerobic interval training: interactive effects of exercise intensity and total work duration. Scand J Med Sci Sports 23(1):74–83. 10.1111/j.1600-0838.2011.01351.x.Stoggl, T., & Sperlich, B. (2014). Polarized training has greater impact on key endurance variables than threshold, high intensity, or high volume training. Front Physiol, 5, 33.
Stoggl T., et al, Sperlich B.. 2014;Polarized training has greater impact on key endurance variables than threshold, high intensity, or high volume training. Front Physiol 5:33.Svedenhag, J. (1995). Maximal and submaximal oxygen uptake during running: how should body mass be accounted for? Scand J Med Sci Sports, 5(4), 175-180
. Svedenhag J.. 1995;Maximal and submaximal oxygen uptake during running: how should body mass be accounted for? Scand J Med Sci Sports 5(4):175–180. 10.1111/j.1600-0838.1995.tb00033.x.Swain, D. P., Abernathy, K. S., Smith, C. S., Lee, S. J., & Bunn, S. A. (1994). Target heart rates for the development of cardiorespiratory fitness. Med Sci Sports Exerc, 26(1), 112-116.
Swain D. P., Abernathy K. S., Smith C. S., Lee S. J., et al, Bunn S. A.. 1994;Target heart rates for the development of cardiorespiratory fitness. Med Sci Sports Exerc 26(1):112–116. 10.1249/00005768-199401000-00019.Swain, D. P., & Franklin, B. A. (2002). VO(2) reserve and the minimal intensity for improving cardiorespiratory fitness. Med Sci Sports Exerc, 34(1), 152-157.
Swain D. P., et al, Franklin B. A.. 2002;VO(2) reserve and the minimal intensity for improving cardiorespiratory fitness. Med Sci Sports Exerc 34(1):152–157.Trost, S. G., Owen, N., Bauman, A. E., Sallis, J. F., & Brown, W. (2002). Correlates of adults' participation in physical activity: review and update. Med Sci Sports Exerc, 34(12), 1996-2001
. Trost S. G., Owen N., Bauman A. E., Sallis J. F., et al, Brown W.. 2002;Correlates of adults' participation in physical activity: review and update. Med Sci Sports Exerc 34(12):1996–2001. 10.1097/00005768-200212000-00020.Yoshida, T., Udo, M., Iwai, K., & Yamaguchi, T. (1993). Physiological characteristics related to endurance running performance in female distance runners. J Sports Sci, 11(1), 57-62.
Yoshida T., Udo M., Iwai K., et al, Yamaguchi T.. 1993;Physiological characteristics related to endurance running performance in female distance runners. J Sports Sci 11(1):57–62. 10.1080/02640419308729964.