Sport Analytics Business: Exploring Fan Engagement on Analytical Content
Article information
Abstract
With the emerging trend of technological advancement in sport media production, sport analytics has provided fan-oriented game contents through multimedia platforms. This study aims to empirically investigate sport fans’ perceptions toward sport analytics contents (i.e., statistics, video, data visualization, decision-aid) by exploring their impact on fan engagement (i.e., information, entertainment, personal identity, social interaction) and employing the uses and gratifications theory. Using multiple regressions, this study found that sport fans are more likely to consume statistics and video contents for information search and entertainment. Moreover, data visualization and decision-aid contents showed a positive impact on subjects’ personal identity and social interaction. The present study highlights key aspects of sport analytics in its application to sport media production as well as sport management at large.
Introduction
Sport analytics is defined as “the use of performance data to understand the structure of sporting competition with the purpose of obtaining a competitive edge” (Szymanski, 2020, p. 57). Specifically, sport teams have applied analytical data to performance assessment (Shreffler, 2017) as well as improvement of decision making on and off the field (Fried & Mumcu, 2016). The most recognized example, Moneyball (Lewis, 2004), can be seen as a successful application of sport analytics in the areas of player selection and team performance (Elitzur, 2020). The impact of Moneyball was compelling in that sport data analytics had offered valuable benefits to sport teams and athletes (Szymanski, 2020). In another example, Ticketmaster started the Live Analytics service which focuses on data analytics with a global fan database to make fan acquisition more efficient and boost ticket sales during sport events (Ticketmaster, 2011). Thus, sport analytics has provided a surge in innovation throughout the sport industry and has fundamentally changed team operations in sport (Watanabe et al., 2021).
According to the Global Sports Analytics Market Report (Cision PR Newswire, 2021), the market size of sport analytics was estimated at $885.0 million in 2020, and it is expected to continue to grow with a compound annual growth rate of 21.3% by 2028. The Tracxn Technologies Report (Tracxn, 2021) has also shown that there are 1,007 sport analytics companies across the world and several sport analytics companies (e.g., Opta, SAP, Vizrt) are specialized in generating analytical content to increase sport fan engagement. Moreover, sport analytics has contributed to the sport gambling industry with an annual growth rate of around 13% (Statista, 2018). Relatedly, the growing trend of sport analytics in the realm of sport industry has brought a substantial impact on sport marketing at large.
Considering the emerging trend of sport analytics and technological development, understanding sport fans’ perceptions can suggest new fan-focused marketing content for teams and analytics companies in the sport context. Existing sport analytics research has heavily focused on athletes’ performance and there is plenty of evidence that successful analysis of sport data can result in better team performance (Perin et al., 2018). However, it fails to capture fan-oriented perspectives concerning their engagement when consuming sport-related content. By the same token, empirical examination of sport analytics and their subsequent impacts from sport fans’ perspectives are still scarce within the field of sport marketing and management. Therefore, the purpose of this study is to empirically investigate sport fans’ various perceptions toward sport analytics content as well as their subsequent impact on fan engagement.
Review of Literature
Sport Analytics
Sport analytics present systematic data via statistical methods that can be utilized to identify effective strategies for athletes’ performance (Szymanski, 2020). Consistently, Sarlis and Tjortjis (2020) suggested that sport analytics is a computational method that helps find valuable information to make on-field/in-game decisions in National Basketball Association (NBA) games. They found that sport analytics in basketball can be used to understand the strengths and weaknesses in games, to better assess opponent teams, and to forecast the playing styles of athletes or teams by optimizing performance indicators such as player impact and win shares. (Sarlis & Tjortjis, 2020). The aforementioned research has emphasized that sport analytics can be widely used for improving athletes’ on-field performance in the area of team operations. Moreover, previous conceptual research in sport analytics at the professional sport level suggested a model of the athlete-monitoring data system that can establish effective methods on how to effectively present significant data information such as data visualization (Thornton et al., 2019). Thornton et al.’s (2019) conceptual model analyzed sport data to facilitate and inform decision-making processes with the following four steps: considerations for athletes monitoring in team sports, identifying methods of analyzing data, determining meaningful changes in data, and establishing effective methods to communicate valuable information. This model can assist sport teams and practitioners to answer the questions of how sport-related data can successfully help coaching as well as team operations. Their findings also offered several useful insights on the application of sport analytics by indicating injury risk management, simplistic visual reports, and communication with stakeholders. Likewise, sport analytics has provided critical information and useful resources for athletes’ performance development and team operations at the professional sport level. The following section unfolds the literature on what types of sport analytics content can be offered for athletes, sport teams and fans in more detail.
Analytical Content in Sport
Generally, statistics in sport analytics have been utilized in order to provide the segment of data collection/management as well as match prediction (Sarlis & Tjortjis, 2020). Many types of statistical approaches with important sport metrics (e.g., scores, injury, biometrics) can assist decision-making in critical situations during sport games (Sarlis et al., 2021). Moreover, Shih (2017) stated that video analysis has provided useful sport analytics content such as tactic summarization, replay, and highlight extraction. Sport analysts also interactively annotate sport games to provide recorded videos of matches such as slow-motion videos (Stein et al., 2017). As previous studies indicated that statistical aspects and video analysis have created many types of sport-related content to analyze sport games, both statistics content and video content can be essential elements in the field of sport analytics.
With the technological advancements in recent years, data visualization offers relatively new sport communication approaches to make more accessible data representation such as Heat maps and 3D graphics (Perin et al., 2018). Sport data visualization has produced attractive and informative reports and highlights of the key findings to communicate with data (Thornton et al., 2019). Additionally, sport analytics with innovative technologies provides decision-aid systems on the field to help make judgment calls such as Video Assistant Referee (VAR) in soccer and Hawk-Eye in tennis (Stoney & Fletcher, 2020). Technological development also has influenced the improvement of decision-making in sport officials (Spitz et al., 2021) and cleared errors and seriously missed incidents such as goals, scores, fouls, or mistaken identities (Kolbinger & Knopp, 2020). Likewise, both contents of data visualization and decision-aid can offer newer approaches in sport analytics to facilitate sport data in more interactive and efficient ways with innovative technologies. In sum, previous literature has shown that sport analytics can benefit comprehension of match properties (e.g., score, foul, possession) and communication with stakeholders through various types of analytical content (i.e., statistics, video, data visualization, decision-aid). As sport games often generate a large volume of data before, during, and after games, sport data can be reproduced as useful analytical content for athletes, teams, organizations, and practitioners in the field of sport management. The subsequent section delves into the correlation between sport analytics and fan engagement.
Increasing Fan Engagement with Sport Analytics
In the sports domain, fan engagement parallels customer engagement. It embodies a consumer’s instinctive, interactive, and collaborative behavior motivated by personal and social purposes (Yoshida et al., 2014; Brodie et al., 2011). Just as engaged consumers provide product referrals and suggestions (Marketing Science Institute, 2010), fan engagement plays a pivotal role in shaping marketing strategies in sports. Relatedly, media outlets offer a myriad of sports analytics content such as statistics and data visualizations, making it easier for fans to engage with this analytical material. Sport analytics delve into deeper aspects of the game, analyzing player performances, offering fans a richer understanding, and thereby enhancing the overall experience. A recent Nielsen Global Sports Marketing Report (2022) highlighted that 51% of sports enthusiasts check live statistics while watching matches. Hensley (2022) noted the increasing need for data-centric experiences to captivate a broader spectrum of sports fans through media. With the infusion of data and a growing appetite for analytical insights, specialists are now focusing on creating innovative sports analytics to deepen fans’ affinity (Kröckel et al., 2022). As a result, sports analytics content has significantly uplifted fan engagement. The subsequent section will present a theoretical framework to further delve into the nuances of fan engagement.
Uses and Gratifications Theory (UGT)
In the context of fan engagement in media, Uses and Gratifications Theory (UGT; Blumler & Katz, 1974; Katz et al., 1973) addresses social and psychological advantages that attract people to a variety of media content. UGT perspectives produce a useful framework for understanding what and why certain types of media people select in pursuit of their motivation and satisfaction. In the early stage of UGT, numerous studies have suggested several classifications of UGT. McQuail et al. (1972) described the classification of cognitive motivation for media usage by diversion (e.g., escape and emotional release), personal relationships (e.g., companionship and social utility), personal identity (e.g., personal reference and value reinforcement), and surveillance. Moreover, Katz et al. (1973) also classified that UGT for mass media might be cognitive (e.g., information) and affective (e.g., emotion) as well as it is related to the social environment (e.g., family and friends) and tension release (e.g., escape and diversion). In recent years, previous research claimed that uses and gratifications have been employed to explore how and why audiences choose media platforms among more advanced media options (e.g., social media) beyond television (Dunne et al., 2010). Specifically, Chen (2011) proposed that interpersonal and interactive aspects of UGT provide a better understanding of how social media become popular and identify users’ motivation. Building on the tenets of UGT, fans employ various media technologies driven by their intrinsic motivational and psychological needs, encompassing the quest for sports-related information on competitiveness, social interaction, and entertainment value (Smith-Ditizio & Smith, 2023). Furthermore, there’s a positive link between UGT and engagement on social media. Ahiabor et al. (2023) posited that UGT sheds light on consumer engagement within the social media sphere, encapsulating consumption, active involvement, and content creation, all serving three unique gratifications: personal fulfillment, social connection, and tension relief. In this context, UGT has provided a comprehensive examination of fan or consumer engagement, delving deep into individual psychological dimensions.
Aligned with exploring consumers’ motivations and satisfactions, UGT can expand the view on the influence of sports fan engagement and their consumptive behaviors when watching sport-related content via media. To investigate sport fan engagement in this study, the most widely recognized McQuail’s (1983) categorization of UGT is employed with the following four attributes of media consumption motives: information, entertainment, personal identity, and social interaction. Information refers to a direct and basic desire to resolve uncertainty or to find something new through sport analytics content (Gummerus et al., 2012). Entertainment can be described as affective needs such as aesthetic, amusement, dynamic, and surprise (Stoney & Fletcher, 2020), and entertainment describes sports fans’ emotional experiences towards a variety of sport analytics content. Personal identity has relevance to the needs of self-expression and self-attachment (Schau & Gilly, 2003). This study defines personal identity as the need to impress other people and to build self-confidence with sport analytics knowledge. Social interaction has been explained as a common need for bonding with people and a sense of belonging (Baldus et al., 2015). More specifically, social interaction in this study is relevant to the needs of communication with others such as discussion about controversial issues from sport analytics content. Hence, the current research is to empirically examine the relevance of four types of sport analytics content (i.e., statistics, video, data visualization, decision-aid) towards fan media engagement under UGT (i.e., information, entertainment, personal identity, social interaction).
Method
Participants
Data were collected from online survey platforms (i.e., Survey Monkey, Amazon Mechanical Turk) towards U.S. adults (18 or older) who engage in watching sports games via media. All participants initially answered their eligibility for this study as sports fans with the following questions: i) How often do you watch sports games via media per week? ii) Do you follow any professional sports players, teams, or leagues in the United States? Participants who indicated “zero time of watching sports games per week” or “not supporting any professional sports players, teams, or leagues” were disqualified and requested to end the survey. A total of 607 people participated in the survey and 536 completed responses were eligible for this study with a response rate of 88%. Data sample characteristics consisted of 343 males (64.0%), 192 females (35.8%), and 1 other (0.2%). Of the 536 respondents, the race was predominantly White (75.2%) followed by Asian (11.0%), Black (8.4%), and Hispanic (4.7%). The largest percentage of the age group fell between the ages of 30 and 39 (35.8%).
Instrumentation
Following the university’s IRB approval, a multi-item questionnaire was used to examine the following constructs: perceived importance of sport analytics contents, and fan engagement with UGT when watching sports games. To measure four content areas of sport analytics, the questionnaire inquired about how four contents of sport analytics are important to respondents’ viewership from four factors with 12 items: statistics, video, data visualization, and decision-aid. The level of fan engagement was measured by figuring out what motives sports fans have when watching sports games from 4 factors with 15 items: information, entertainment, personal identity, and social interaction. Overall, the main questionnaire for this study utilized the modified version of 8 main factors with 29 items to segment sport analytics spectatorship on statistics, video, data visualization, decision-aid, information, entertainment, personal identity, and social interaction. All questionnaire items were anchored by a 5-point Likert scale to answer how much sports fans agree or prefer.
Data Analysis
Using SPSS version 28, a series of four regression analyses were performed to predict the impact of sport analytics content on the level of fan engagement. Regression analysis is a statistical method used to investigate the relationship between one or more independent variables (often referred to as predictors) and a dependent variable (commonly known as the outcome variable). This technique allows for understanding the interrelations among variables, facilitating predictions about the outcome variable based on specified predictor values (Chatterjee et al., 2000). In the regression analyses, independent variables consisted of four types of sport analytics content (i.e., statistics, video, data visualization, decision-aid), and dependent variables included four attributes of UGT (i.e., information, entertainment, personal identity, social interaction). Each dependent variable was separately assessed by the same four independent variables. To minimize the potential increase of type I error resulting in four separated regression analyses with the same independent variables, the Bonferroni correction which adjusts probability values when making multiple statistical tests was utilized to adjust the statistical significance level at p equal to or less than .0125 in this study.
Results
Reliability and Validity
The main questionnaire consisted of 8 factors with 29 items. Using SPSS, Cronbach’s alphas were measured for internal consistency of the overall variables (Creswell, 2010). Kline (1999) noted that a cut-off value of .7 is more suitable to indicate around 50% common variance between items and factors, but even values of below .7 also can be expected due to the diversity of the psychological constructs (Field, 2017). Pallant (2001) also claimed that Cronbach Alpha’s value above .6 is considered as acceptable reliabilities. In this study, Cronbach’s Alphas of items ranged from .609 to .797 which indicates the statistical fit at least adequate properties of the scales. Table 1 shows the questionnaire item list and reliabilities of each construct about the four sport analytics contents and UGT.
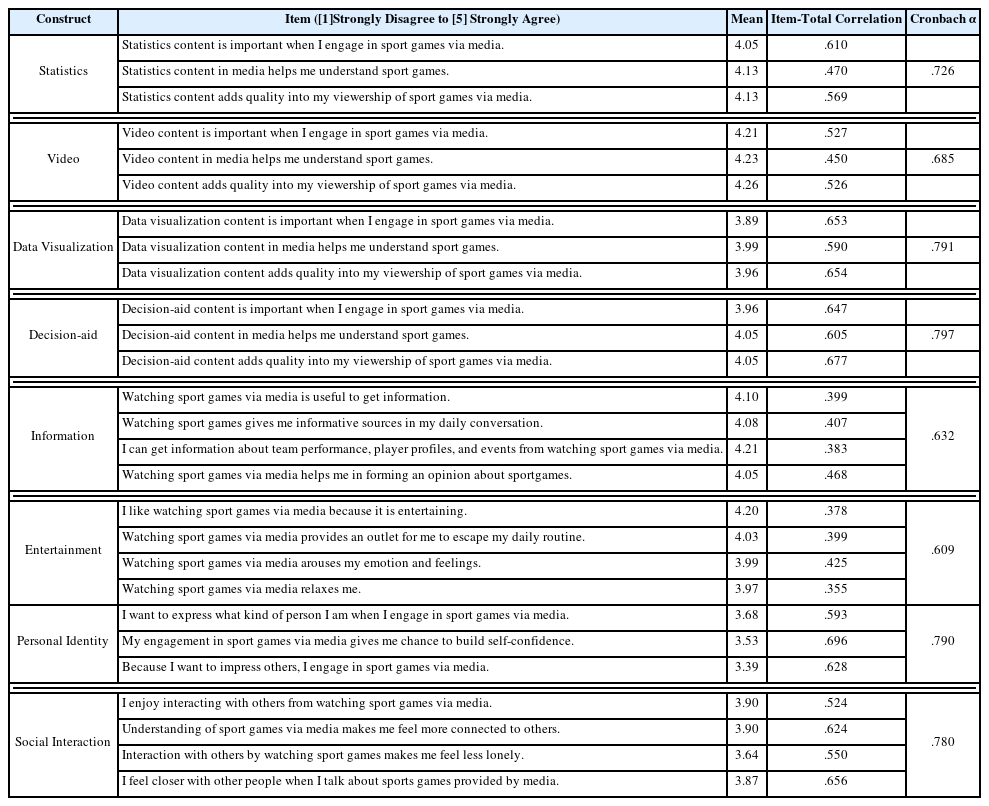
Items and reliabilities
Table 2 indicated discriminant validity among all 8 variables. According to Kline’s (2010) research, greater than .85 correlations can be arguable to establish enough discriminant validity. This is because a factor correlation of greater than .70 indicates over 50% shared variance, and a .85 correlation indicates around 72% shared variance between two variables (Kline, 2010). Results of factor correlations showed less than .70 which supports adequate distinctiveness among variables. Findings from descriptive statistics from all variables revealed that video content had the highest level of importance when sports fans are watching sports games among four different types of sport analytics content. In addition, information showed the highest mean value among UGT.

Factor correlations
Prediction of Fan Engagement in Association with Sport Analytics Contents
Multiple regression analyses were utilized to assess the impact of four sport analytics contents brought to four different sports fan media engagements. Four separate regression analyses indicated statistical significance in analyzing the relationship between sport analytics contents and sports fan engagement. Specifically, the first regression analysis tested information as a dependent variable with four independent variables, and this regression showed a large effect size at R2 > .25 (R2 = .552). The findings indicated that video content (unstandardized B = .316, p < .001) had the biggest statistical impact on information needs followed by statistics (unstandardized B = .210, p < .001), decision-aid (unstandardized B = .125, p < .001), and data visualization (unstandardized B = .117, p < .001). The second regression predicted how sport analytics contents influence individuals’ perceived level of entertainment. The results showed a large effect size (R2 = .357), and all independent variables had a significant level of < .001. Video content (unstandardized B = .219, p < .001) showed the biggest statistical impact on entertainment attributes followed by statistics (unstandardized B = .185, p < .001), decision-aid (unstandardized B = .150, p < .001), and data visualization (unstandardized B = .125, p < .001). In addition, the third regression analyzed personal identity toward four sport analytics contents, and it also showed a large effect size (R2 = .256), but the least effect size among the four regression analyses. Both contents of statistics (p > .05) and videos (p > .05) were not statistically significant on personal identity attributes. Data visualization (unstandardized B = .509, p < .001) indicated the most impactful variable and decision-aid (unstandardized B = .330, p < .001) content also showed a significant impact on personal identity. Lastly, the fourth regression analysis between social interaction and sport analytics content also presented a large effect size (R2 = .314). Only video (p > .05) content toward social interaction was not statistically significant. Data visualization (unstandardized B = .285, p < .001) displayed as the most powerful impact to predict the attribute of social interaction followed by decision-aid (unstandardized B = .201, p < .001) and statistics (unstandardized B = .185, p < .01). Table 3 provides the detailed results from four separated regression analyses.
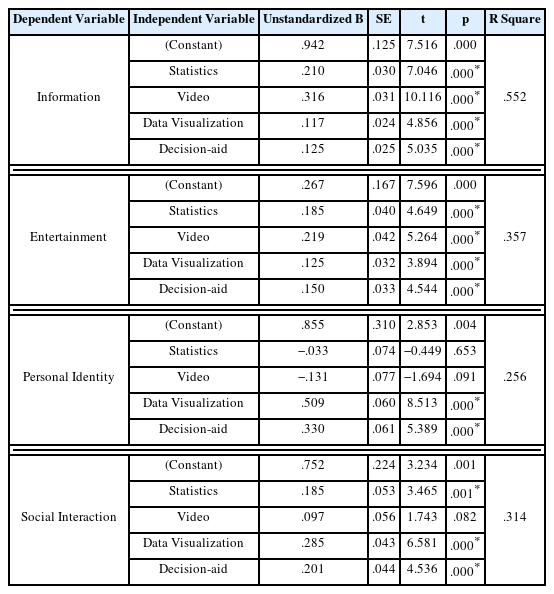
Multiple regression analyses
Discussion
Using UGT (Blumler & Katz, 1974; Katz et al., 1973) to guide the analyses of multiple regressions, the present study explored sports fans’ perspectives on fan engagement towards various sport analytics contents. The results from this study suggest several notable areas of discussion and implications that can be applied by sports marketers, sports analysts, media providers, and sport management researchers. The first major finding was the predictions of how sports fans engage in the four types of sport analytics content from their UGT perspectives. When sports fans watch ‘statistics’ and ‘video’ contents related to analytics in sports, both ‘information’ and ‘entertainment’ can be more impactful attributes among UGT perspectives. Specifically, sports fans are more likely to watch statistics and video contents to seek out information about sports games or to have more enjoyable feelings when watching sports games. These results support previous studies that sports data from various sources such as statistics and videos help exploit in more depth valuable information to understand sports games (Sarlis & Tjortjis, 2020). Moreover, our findings demonstrate that people enjoy sport-related content from video analysis because it enables them to portray more precise teams’ behaviors on the field such as performance evaluation, competitor tactics, key players, and weaknesses (Orange Fizz, 2021). Likewise, both contents from statistics and video analysis can utilize sports data to provide more accurate information and enjoyable on-field facts.
In addition, the attributes of ‘personal identity’ and ‘social interaction’ are able to positively affect the consumption of ‘data visualization’ and ‘decision-aid’ contents in sport analytics. More precisely, our findings revealed that sports fans can often watch data visualization and decision-aid contents to gain confidence from knowledge about sports, or to share their personal opinions on sports games with other people. Aligned with these findings, Perin et al.’s (2018) research noted that sports data visualization offers new approaches that can be more accessible to explore and communicate with sports data compared with statistical analyses. Visual analysis can also summarize or simplify sports data to provide an easier and faster understanding of sports game features for audiences (Du & Yuan, 2020). Likewise, sports fans have benefited from data visualization content to gain more knowledge of sports games and have better communication through visible sport data. Moreover, Kolbinger and Knopp (2020) found that 94 incidents of the Video Assistant Referee as decision-aid content generated a total number of 58,264 tweets on social media, and it was 9.1% of the overall tweets from 129 soccer matches in the English Premier League. Winand and Fergusson’s (2018) research on Goal Line Technology in soccer also supports that decision-aid content positively affected supporters’ satisfaction resulting from contentious decisions if the goals are allowed. Decision-aid content generally helps the referee to assist with the decision-making in many situations on the pitch such as scoring and foul play (Stoney & Fletcher, 2020), however, it also causes several controversies from fans’ perceptions that reduces enjoyment by distracting the sports games and obeying with higher authority than referees (Dutta, 2021). Along similar lines, our findings demonstrate that decision-aid content in sports encourages social interaction to share sports fans’ personal ideas on contentious decisions as well as makes them less likely to entertain the sports games.
The findings also reveal several insignificant relationships. Notably, both statistics and video contents lacked association with personal identity, and video content also showed no statistical significance with social interaction. Within the sport analytics content of this study, statistics and videos are viewed as more traditional forms when juxtaposed with newer formats like data visualization and decision-aid tools. These results may imply that sports fans are less inclined to engage with statistics and video content when seeking to express their personal identity or interact with others. Given that traditional content tends to be consumed with less distinction, individuals appear more drawn to contemporary content such as data visualization and decision-aid tools to accentuate their personal identity.
Implications
The current study proposes both theoretical and managerial implications by exploring sports fans’ perspectives in terms of fan engagement in sport analytics. For theoretical advancement, this study suggests a new categorization of sport analytics content in the field of sport management: statistics, video, data visualization, and decision-aid. Given that sport analytics research has been heavily conducted in the field of sports science, these four types of sport analytics have been used separately for performance development, player selection, and data analysis. As such, the current study categorizes sport analytics to explore fans’ perspectives by providing four different analytical contents in sports. By identifying the usage of sport analytics in the field of sport management/marketing, this study implies new research areas for sports fans’ consumptive behaviors on sport analytics content. Moreover, this study offers meaningful trend lines for the Uses and Gratifications approach. Exploring a new topic of sport analytics on media can expand the theoretical framework of Uses and Gratifications to provide new insights on the application to newer media platforms and comparisons with previous literature on sports media such as social media behavior (Billings et al., 2019) and television watching intention (Rubin, 1983). In sum, this study can contribute to the sport analytics research in the field of sport management by providing a new categorization of sport analytics content and expanding the Uses and Gratifications approach toward newer media content.
From a practical perspective, the current study proposes industrial applications for sports practitioners such as sports marketers, sports analysts, and media providers. Many sports marketers or sponsors create marketing content to promote their services or products and to enhance positive images for their teams or organizations (Koronios et al., 2020; Papadimiriou et al., 2016). This study implies the usage of sport analytics for marketing purposes to satisfy sports fans’ consumptive needs. It is important to note that sport analytics can create new types of sport marketing content and people has sought out analytical content with various needs similar to other sport marketing services or products (e.g., ticket, social media, viewership). Specifically, the findings imply that sports marketers can produce new marketing content using data visualization or decision-aid incidents to encourage social interaction with fans, and it would expect a greater number of tweets, comments, or likes on social media. To meet the informative needs, sports marketers can also create media products or services using video analysis such as highlights and slow-motion videos. These findings would certainly make sense that sport analytics can be utilized for sport marketing by creating promotional content from different types of sport analytics to meet sports fans’ various needs and satisfactions. As sports data can be reprocessed for marketing purposes other than match analysis or player evaluation, this study can provide new insights to make use of sport analytics more practically in the field of sport marketing.
Additionally, a sports analyst is defined as a specialized person who looks through technical, tactical, and physiological performance metrics (Arastey, 2020). While sports analysts have traditionally provided an observational role to improve sports performance from collected data, now many analysts in sports can be spotted in stadiums to notate events and actions from the match using specialized software programs such as Sports Code and Dartfish (Arastey, 2020). Likewise, sports analysts are the first individuals to observe and collect sports data, and this circumstance could expand their areas of data collection to focus on fan engagement. Considering that the findings indicated how the types of sport analytics affected various attributes of fan engagement, sports analysts can consider collecting additional resources related to sports data to increase fan engagement. For example, sports analysts can gather video footage with different camera angles of events during the match to resolve information needs and to make it more entertaining for sports fans. As sports analysts are responsible for assembling data in the first place in the specialized field (Arastey, 2020), the current study suggests that the role of sports analysts can expand to increase sports fan engagement by collecting fan-driven analytical resources during the match. Thus, this study has meaningful contributions to media consumption behaviors by exploring sports fan engagement in the context of emerging sport analytics content.
Limitations and Future Research
The findings provide both theoretical and practical implications in the field of sport management, but several important limitations should be noted. Although this study defines the four types of sport analytics content, the usage of sport analytics can be differently applied by sports. For example, baseball tends to use more statistical information about the probabilities of events than other sports (Stats Hacker, 2018). Video Assistant Referee and Goal Line Technology are only used for the accuracy of events in soccer. Considering that each sport has different features or technologies to provide analytical content, future research should expand the categorization of sport analytics by sports, and researchers should consider exploring the perception of sport analytics in different sports such as baseball, soccer, football, basketball, and more. Second, given both data visualization and decision-aid are referred to as newer types of sport analytics, exploring differences between old and new analytical content could offer practical applications to the results of advantages of newer content uncovered within the present study. With the advancement of analytics or technologies in sports, people’s perceptions of sports may be more progressive and diverse. Future studies could further explore how the development of sport analytics affects sports fans’ perceptions toward sports events, and researchers could focus on either data visualization or decision-aid content separately to explore how analytical content has been developed for sports fans. Nevertheless, this study raises beneficial implications for sports practitioners and provides several possibilities for future research.