Effects of Running Velocity on Vertical Stiffness and Muscle Co-activations
Article information
Abstract
The purpose of this study was to investigate the vertical stiffness and agonist-antagonist muscle co-activation according to running velocity. Eighteen runners asked to perform running on an instrumented treadmill (HP Cosmos, Germany) with a capacitance-based pressure platform at 40, 50, 60, 70, 80% of maximum velocities, 19 infrared cameras and surface electromyography were used to measure kinematics and muscle activation. Vertical stiffness increased significantly as running speed increased. On the other hand, co-activation decreased significantly as the running speed increased. We conclude that antagonist muscle groups decrease with increasing running speed and depend on agonist muscle group activity.
Introduction
Running serves as a base function for athletes to improve their performance in most sports. The study of the running mechanism for speed improvement has been demonstrated for functional interactions between different joints (or segments), muscles, tendons, ligaments and mechanical forces through kinematical and kinetical analysis. One of the theories that can explain the mechanism for biomechanical changes with running speed is the increase in vertical stiffness (Struzik et al., 2021). Increasing vertical stiffness reduces ground contact time, increases stride frequency and stride length, and consequently increases running velocity (Bret et al., 2002; García-Pinillos et al., 2019; Paradisis et al., 2019). Conversely, a decrease in vertical stiffness indicates a lower running speed due to a longer contact time and lower stride frequency (Rumpf et al., 2015).
Stiffness accumulates potential elastic energy in the human body to which an external force is applied and releases it again when it returns to its original length. Therefore, the increase of vertical stiffness is considered as a running strategy utilizing the elastic properties of the human body. An increase in running speed is accompanied by a greater impact, and an increase in stiffness is a strategy of the central nervous system to minimize perturbation by this impact (Boyer & Nigg, 2004; Lohman et al., 2011). At this time, the increase in stiffness is utilized as an injury prevention strategy to secure stability so that excessive movement does not occur by resisting perturbation by external forces (Butler et al., 2003; Riemann et al., 2002). In particular, stiffness increases in response to unpredictable perturbation by changes in the external environment (Burdet et al., 2001; Chmielewski et al., 2005; Fong et al., 2005; Voloshina & Ferris, 2015). In this way, since stiffness is used as a strategy for securing stability as well as speed improvement during running, attention must be paid to the interpretation of the increase or decrease of stiffness.
The concept of stiffness originated in classical mechanics to describe the movement of elastic deformable bodies, but is applied to the human body in the field of kinematics. However, the human body is made up of muscles, tendons, fascia, and other connective tissues, and the stiffness is applied differently depending on each component (Freitas et al., 2018). Tendon stiffness depends on lengthening, whereas muscle stiffness is increased by lengthening and activation level (Monte & Zignoli, 2021; Raiteri et al., 2018). In other words, the stiffness of a muscle changes with the increase in the force exerted and the motor units activated (Davidson et al., 2017). Thus, stiffness is induced by muscle activity, and the neuro-muscular system controls stiffness by adjusting the level of muscle activity (Lee et al., 2006). Since the calculated value of stiffness applied to the human body can be interpreted as a result of muscle activity size and muscle activity pattern, movement analysis using stiffness and muscle activity pattern should be performed simultaneously in interpreting specific movements.
Stiffness can be increased by utilizing the co-activation of the agonist and antagonist muscles as well as the activity of the agonist to resist a given load. Co-activation is used as a joint stabilization strategy by evenly distributing externally transmitted loads or internally expressed forces, and consequently prevents abnormal kinematics that increase the risk of injury (Baratta et al., 1988; Hirokawa et al., 1991; Kellis et al., 2011; Moore et al., 2014; Solomonow et al., 1988). In particular, it greatly contributes to the stability of joints in unstable situations that induce perturbation (Buchecker et al., 2012; Horsak et al., 2015; Lewek et al., 2004). What is interesting is that co-activation of antagonist and agonist muscles is not a reaction based on the structure or reaction of the human body, but a skill learned through individual adaptation to the task (Russell et al., 2007). In particular, although consistent research results have been reported that the antagonist biceps femoris acts as a stabilizer and that vertical stiffness increases as running speed increases, the results of the increase in agonist activity and antagonist activity are not clear (Boyer & Nigg, 2004; Montgomery et al., 1994; Tam et al., 2017). Therefore, the purpose of this study was to investigate the vertical stiffness and agonist -antagonist muscle co-activation according to running velocity.
Methods
Participants
Sixteen runners participated in this study (21.3±2.1 yrs, 175.6±4.2 cm, 75.3±9.4 kg). All runners signed informed written consent approved by the Semyung university’s institutional review board before participation. Runners were excluded based on any of the following criteria: a history of neurologic deficits or other musculoskeletal disorders in the previous six months. We included runners who had more than two years of running experience and weekly mileage of more than 10 km through recreational sports.
Procedure
Runners performed sprint running on a running track (100m) to measure individual maximum running speed. The global navigation satellite system unit (Vector S7, Catapult Innovations, Australia; sampling rates: 10 Hz) was used to measure the maximum speed, and it was placed on the runner’s upper-trunk using a vest. The maximum speed was calculated by averaging the results of three sprints. After 20 minute warm-up (8 minute jogging, 6 minute stretching exercises, and 6 minute sprints), the participants performed maximal sprint runs with a break between each trial.
Surface electromyography (EMG; mini wave waterproof, Cometa, Italia; sampling rates: 2000 Hz) was measured for in five dominant lower limb muscles, namely rectus femoris (RF), vastus medialis (VM), vastus lateralis (VL), semitendinosus (ST), biceps femoris (BF). The skin areas were prepared by removing foreign objects and two surface electrodes placed on the muscle location according to Surface Electromyography for the Non-Invasive Assessment of Muscles (SENIAM) guidelines. Normalization of EMG amplitude was performed using maximal voluntary isometric contraction (MVIC) for comparison between participants, muscles, and measurement sessions. For each test of the 5 muscles, runners were asked to contract maximally against a fixed resistance, provided by a unstretchable strap fixed to the testing plinth. Subjects were instructed to hold the contraction for five seconds and each test was repeated three times.
40 retro-reflective markers were placed on the skin surface of trunk, pelvis and both lower-extremities. Then, runners asked to perform running on an instrumented treadmill (HP Cosmos, Germany) with a capacitance-based pressure platform (FDM-THQ, Zebris Medical GmbH, Germany; sampling rates: 200 Hz) at five velocities, from 40 to 80% (at 10% intervals) of maximum running velocity. All runners ran for 32 seconds (6 seconds acceleration, 20 seconds target-velocity, 6 seconds deceleration). The order of running velocity conditions was randomized for each participant. And subjects were allowed to rest at any time during the testing. Data were extracted from the middle strides (6 strides on average) of each velocity. Kinematic data were collected at 200 Hz using 19 infrared camera motion capture system (Oqus700+, Qualisys, Sweden; sampling rates: 200 Hz).
Data Analysis
Stance phase Kinematic and EMG data were processed using Visual-3D (C-motion, USA) and biomechanical variables were calculated using Matlab R2016a (The math work, USA). 8-segment bodies were modeled to obtain data for the whole-body center of mass (COM). Marker data were filtered using a fourth-order Butterworth low-pass filter with a cut-off frequency of 6 Hz, to reduce the effect of noise. The ground reaction force (GRF) data were scaled to each participant’s body weight (BW).
Vertical stiffness (Kvert) are calculated by the following equation:
where F is the deforming force (vertical ground reaction force, vertical GRF) and Δy is the vertical displacement of COM (deformation).
The EMG data were band-pass filtered (cut-off frequency: 20–500 Hz) using a fourth-order Butterworth filter. Root-mean-square (RMS) amplitudes were calculated using a 30ms window, and subsequently normalized based on the MVIC amplitude recorded in the three trials. For quantify the activity of agonists and antagonists, a co-activation index (CI) was calculated based on agonist (Iago) and antagonist (Iant) muscle activation. Since multiple EMG signals are included for the agonist and antagonist muscle groups, they are averaged (e.g., EMG of the biceps femoris and semitendinosus are averaged to calculate the Iant profile; Navacchia et al., 2019):
where Iago is signal averaged from the rectus femoris, vastus medialis and vastus lateralis, and Iant is signal averaged from the semitendinosus and biceps femoris. 100% indicate full co-activation. Kinematic and kinetic variables were analyzed during the stance phase of a running cycle.
Statistical Analysis
Vertical displacement of COM, vertical GRF, vertical stiffness, activation value of each muscle and Co-activation index results were compared between running velocities with a one-way repeated ANOVA and a Bonferroni correction for multiple comparisons using SPSS 21.0 (IBM, USA). The significance level was set to α=.05. Additionally, differences in Co-activation index were assessed using statistical parametric mapping (SPM) with one-way repeated ANOVA (p<.05). Since the stance phase of running includes initial contact, mid-stance, and takeoff, and each section has a different role of absorption and propulsion, SPM was used to examine significant differences at 1% intervals within the entire stance phase.
Results
Vertical Stiffness
Vertical ground reaction force (vGRF) increased significantly as running speed increased, while vertical displacement of COM (vCOM) significantly decreased (Figure 1 (A & B), Table 1). Vertical stiffness (Kvert) increased significantly as running speed increased (Figure 1 (C), Table 1).
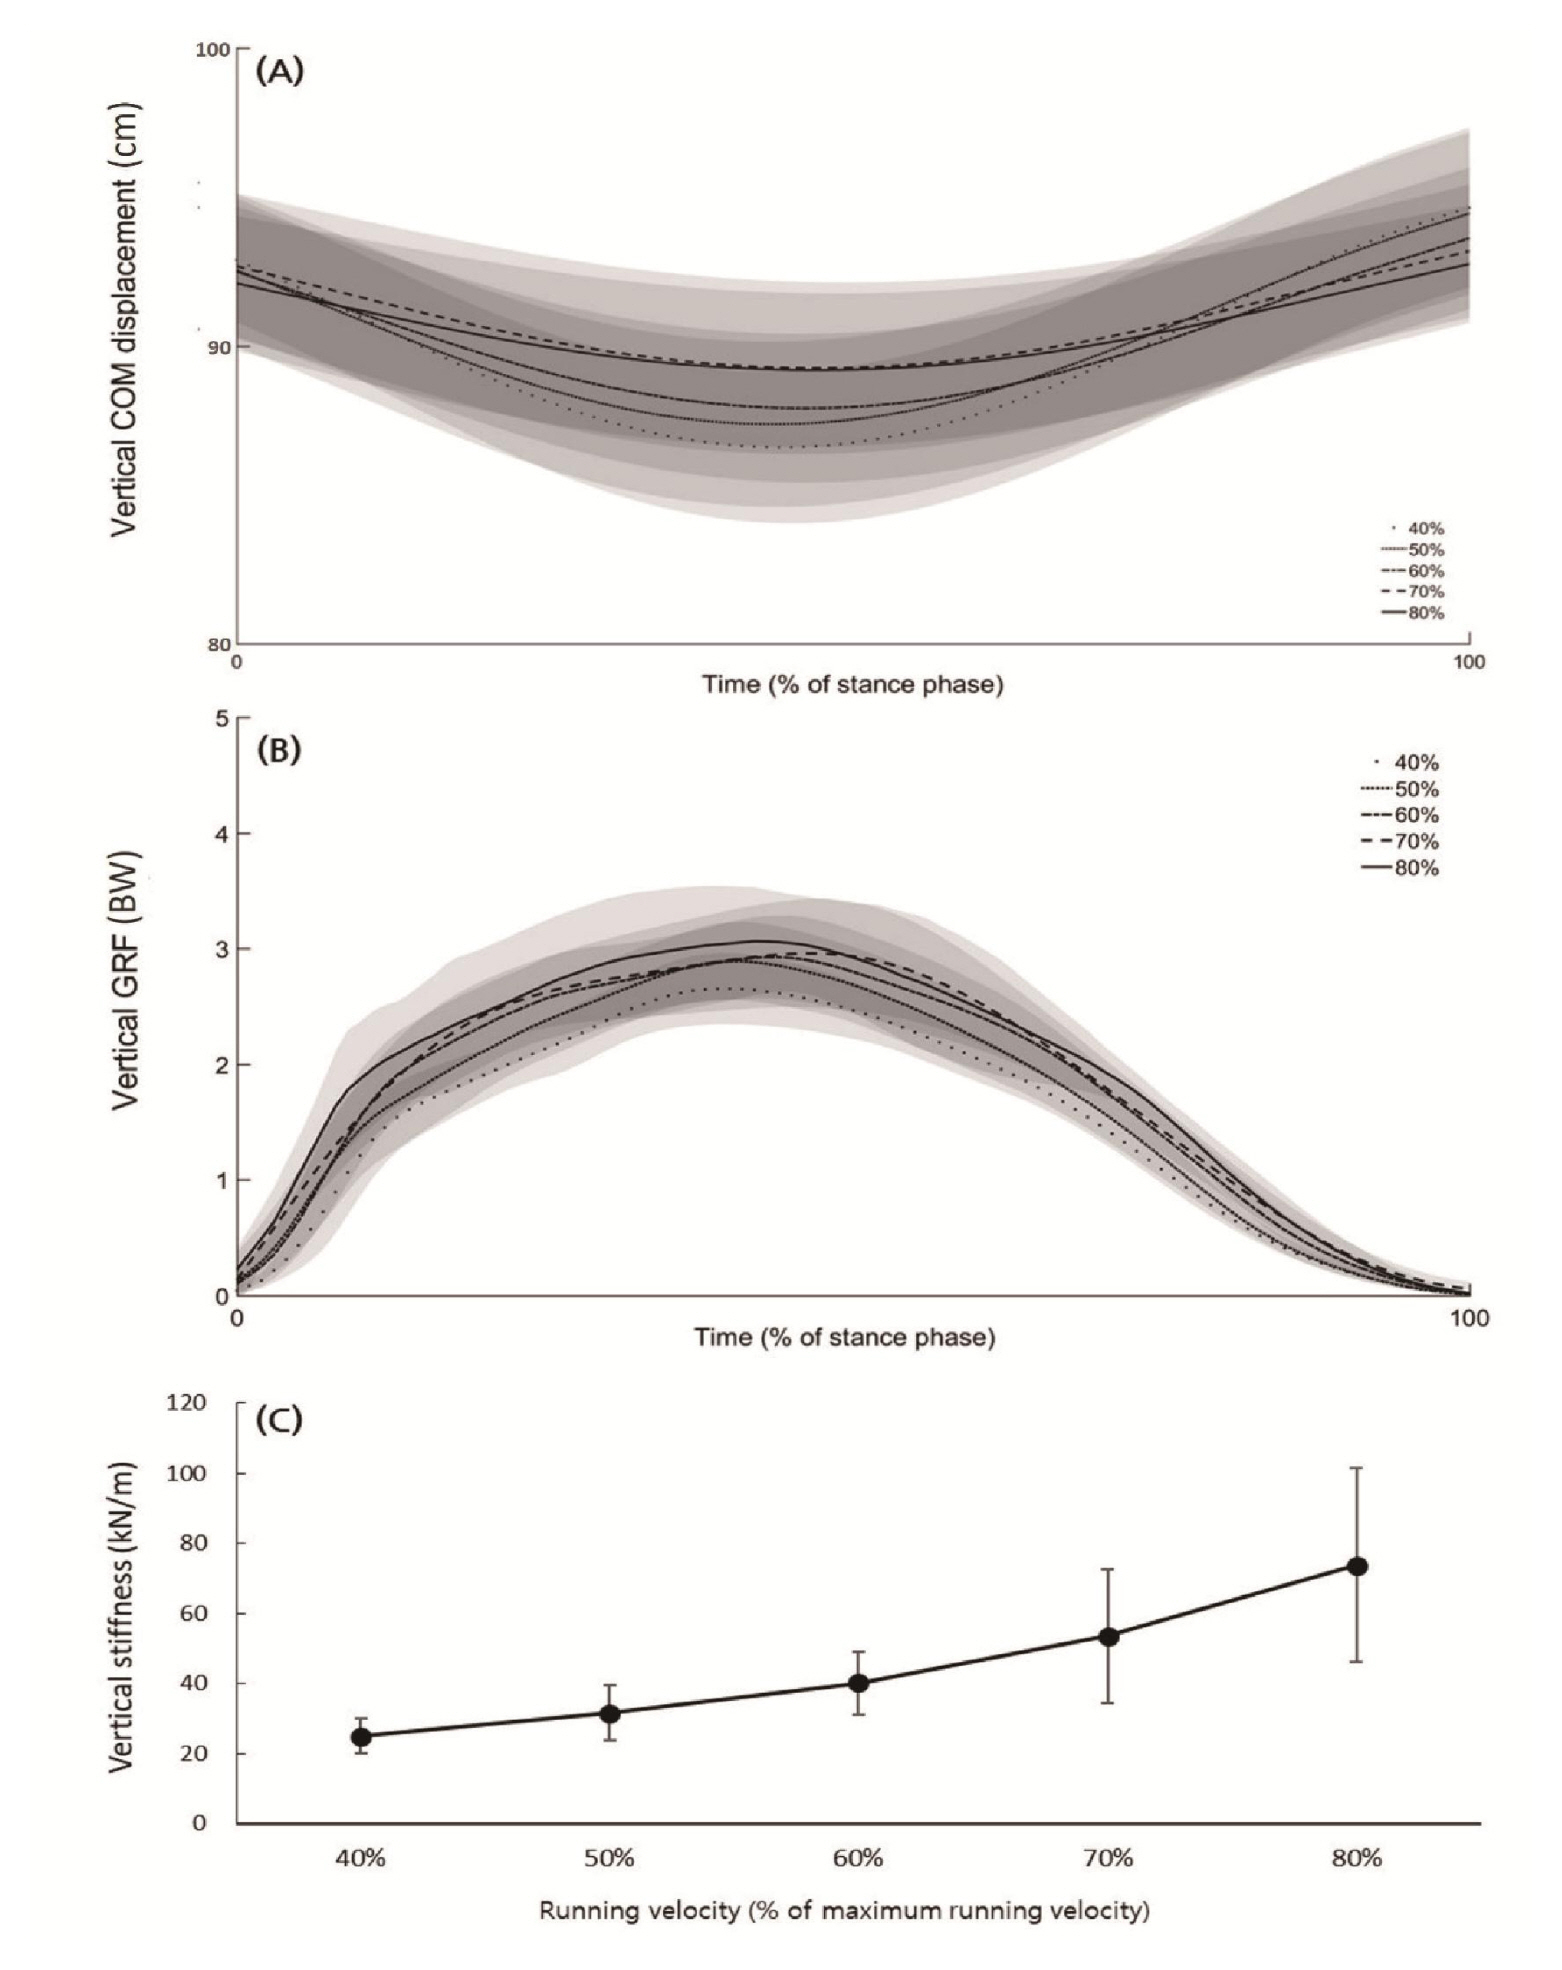
Vertical COM displacement (A) and vertical GRF (B) average curves (black line) and standard deviation (gray area) and vertical stiffness for the stance phase (0–100%) of 5 velocities (40, 50, 60, 70, 80% of maximum running velocity).

Average±standard deviation of vertical stiffness parameters and muscle activation patterns, and one-way repeated ANOVA results
Co-activation Index
In the agonist muscle group, rectus femoris (RF) increased significantly as running speed increased (p‹.05), while vastus medialis and vastus lateralis showed no significant difference among running velocities (Table 1). In the antagonist muscle group, semitendinosus (ST) and biceps femoris (BF) were significantly decreased during 80% velocity compared with 40, 50, 60% velocities (p‹.05, Table 1). Co-activation index was significantly decreased during 70% velocity compared with 40, 50% velocities and during 80% compared to 40, 50, 60% velocities (p‹.05). As a result of SPM analysis, Co-activation showed a significant difference in the entire 0–100% period of the stance phase (p‹.05, Figure 2 (B)).
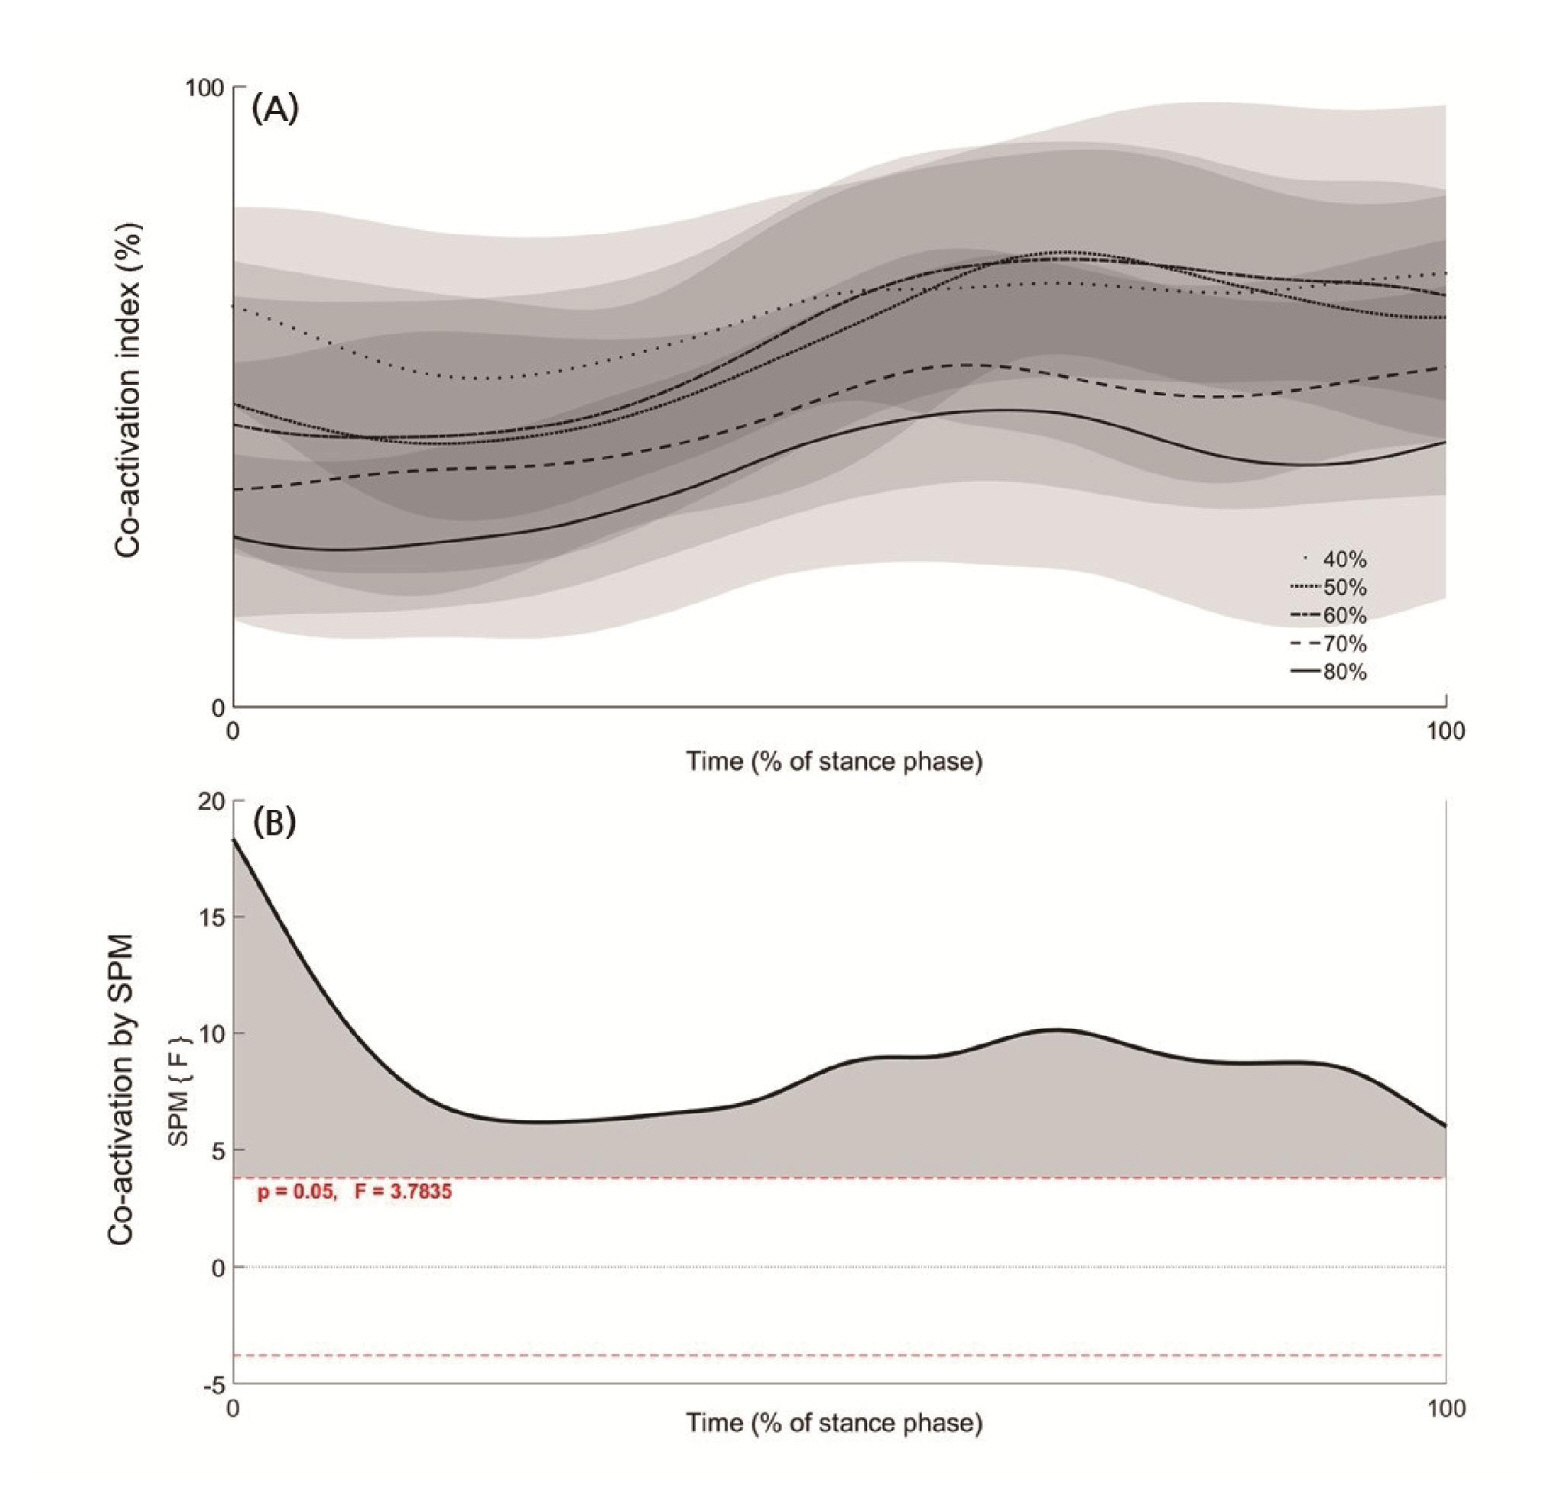
Co-activation index (A) average curves (black line) and standard deviation (gray area) for the stance phase (0–100%) of 5 velocities (40, 50, 60, 70, 80% of maximum running velocity) and statistical parametric mapping result (B). Gray area indicates a significant difference per 1% of stance phase.
Discussion
The purpose of this study was to investigate changes in vertical stiffness and muscle activation patterns with increasing running speed. Running at 40, 50, 60, 70, and 80% of the maximum velocity (100%) measured in an over ground running track was analyzed using a treadmill equipped with an infrared camera, electromyogram, and pressure sensor. Although the runners used a strategy to increase vertical stiffness as their speed increased, the co-activation between the agonist and antagonist muscle showed a decreasing pattern.
Vertical stiffness appears larger as the intensity of tasks such as running speed or exercise load increases (Maloney & Fletcher, 2018). In this study, the vertical stiffness increased as the running speed increased, and it increased more rapidly as it approached the maximum speed. The rapid increase in vertical stiffness with increasing running speed has already been demonstrated through many studies (Arampatzis et al., 1999; Kuitunen et al., 2002; Paradisis et al., 2019). Because vertical stiffness is the key to generating higher peak running speeds when performing short sprints, the ability to generate greater vertical stiffness determines a runner’s sprint level (Bret et al., 2002; García-Pinillos et al., 2019; Rumpf et al., 2015). Vertical stiffness depends on vertical ground reaction force and COM displacement. In the results of this study, as the running speed increased, the vertical ground reaction force significantly increased and the vertical displacement of the COM significantly decreased. These two factors are a product of running-technique and strategy. The level of movement for all objects is explained by the propulsion force, and in human locomotion, it can be explained by the ground reaction force that occurs between the foot and the ground. Therefore, the greater ground reaction force expressed by the runner’s physical requirements and running technique makes it possible to propel the human body faster. A running strategy appears in the effective movement of the human body, and an increase in stride length and stride frequency is a representative running strategy for increasing speed. At this time, since the stride frequency means increasing the number of propulsion by reducing the ground contact time, it is the main factor in reducing the vertical displacement of COM (Brughelli et al., 2011). A short ground contact time reduces the range of motion of the lower extremity joints, thereby reducing the vertical displacement of the COM and consequently increasing joint stiffness (Jin & Hahn, 2018).
In the human body, stiffness is determined by the properties of the muscle-tendon complex, but changes with muscle activity. The manifestation of stiffness to respond to a given load can be confirmed by the muscle activation pattern that appears in the coordination of the concentric contraction and eccentric contraction of the agonist muscle. However, the co-activation of antagonist muscles to secure additional stability during running has not been clearly demonstrated. During running, the antagonist muscle (biceps femoris) pre-activates just before ground contact and is also active during ground contact (Montgomery et al., 1994; Tam et al., 2017), but the results of studies based on running speed remain open to interpretation. In various exercise tasks, the hamstring muscle group serves as a stabilizer for injury prevention, but the role of increasing vertical stiffness for fast running speed has not been clearly identified. In this study, the activity of rectus femoris (RF) was significantly increased at 80% of maximum speed compared to 40–60%, and the activity of semitendinosus (ST) and biceps femoris (BF) was significantly decreased. Also, co-activation decreased significantly as the running speed increased. As the running speed increases, the activation of the agonist increases, which can be understood as a natural result. On the other hand, as shown in the results of the activation and co-activation of antagonist muscles, the theory of co-activation of antagonist muscles as an intrinsic factor for increasing vertical stiffness should be excluded (Tam et al., 2017). In addition, the increase in vertical stiffness with increasing running speed suggests that it is a strategy for storing and release of potential elastic energy rather than stabilization. Recruitment of antagonist muscles is not necessary for strategy of increasing vertical stiffness of COM during running for the utilization of elastic energy. Potential elastic energy can be stored and released only by responding to the load generated between the runner’s foot and the ground by activating the agonist muscle.
The co-activation of the agonist and antagonist muscles contracts in opposite directions at the same time to stabilize the joint, which plays a major role in preventing injury (Kellis et al., 2011). However, in terms of performance or exercise efficiency, it can be interpreted in the opposite way. In performing a specific movement, the increased contractile activity and activation timing of antagonist muscles due to co-activation require larger and longer activity of the agonist muscle. In particular, when performing running, excessive co-activation increases the energy cost required for movement, so the efficiency of exercise performance is very low (Moore et al., 2014). Therefore, co-activation may be a good strategy in terms of injury prevention, but it is not an effective strategy in terms of maximum performance in short sprints.
The stance phase of running includes initial contact, mid-stance, and takeoff, and propulsion is performed after absorption. Since runners must perform different running mechanisms for each running section, SPM was conducted to examine the use of selective co-activation. However, as the speed increased, co-activation decreased in the entire stance phase (0–100% of stance phase). This means that the runner performs the entire stance phase with one running strategy, rather than changing co-activation in some phases. The entire stance phase takes a shorter time as the running velocity increases. In addition, the ratio of the absorption phase is reduced, and the propulsion phase is relatively increased. Therefore, a running strategy for propulsion is required as running velocity increases, so it seems to depend more on the activation of agonists rather than antagonists.
Just as stiffness does not depend only on musculoskeletal structure and changes according to an active activation pattern, co-activation is not a result of structure but a result of selective performance. Russell et al. (2007) reported that co-activation significantly increased in adults compared to children in various tasks, suggesting that this was an intended performance strategy through learning and adaptation to the task. If increasing co-activation during running on unstable ground is also a selected running strategy, such as lowering the center of gravity, conversely, it may be possible to minimize co-activation for maximum performance. According to previous research results, elite level runners in high-speed running reported greater vertical stiffness than regular runners (García-Pinillos et al., 2019). This is thought to be the result of maximizing running efficiency by minimizing co-activation through repeated training for elite runners to perform faster at maximum running speed. Therefore, we propose short sprint training aimed at increasing vertical stiffness focused on agonist activity for elite athletes in events where short-distance sprint ability determines performance (eg, gymnastics vault, track and field long jump, field hockey, etc.).
A limitation of this study is that co-activation of the crural muscles, which control the ankle joint movement, was not investigated because this study only investigated the femoral muscle group, which controls the knee joint movement. Since the ankle joint plays an important role in propulsion in running, more meaningful results can be presented if investigated through future research.
Conclusions
The results of this study showed that the activity of the agonist muscle increased while the activity of the antagonist muscle decreased to increase vertical stiffness as the running speed increased. We conclude that antagonist muscle groups decrease with increasing running speed and depend on agonist muscle group activity.
Acknowledgements
This study has been supported by Semyung University in 2022.