The Relationships between Sport Spectators’ Experience, Destination Image, Event Image, and Behavioral Intention: The Case of the 18th FINA World Aquatics Championships
Article information
Abstract
This study aimed to identify sporting event experience factors and examine the structural relationships among experience, destination image, event image, and behavioral intention using data from sport spectators of the 18th FINA World Aquatic Championships in South Korea. The data were collected using a face-to-face questionnaire-based survey with 329 randomly selected sport spectators aged over 20 years. Factor analysis, reliability, validity, a correlation analysis, and a structural equation modeling analysis were employed utilizing SPSS 22.0 and AMOS 22.0. The results indicate that entertainment, esthetics, and escapism in sporting event experiences enhance destination image and event image. Further, destination image and event image are strong predictors of behavioral intention. The results indicate that local governments and event organizers should provide spectators with a creative sporting event environment with a wide array of potential experiences.
Introduction
International sporting events are brief occurrences which attract a lot of publicity (Carey et al., 2011); they are attractive to many individuals and hold specific import (Roche, 2000). Historically, such large-scale sporting events have been regarded to improve the appeal of their location as a tourist destination, but more fundamentally they have formed major marketing opportunities pertinent to the destination within a climate where the global competition to encourage tourists’ spending is becoming more intense (Getz & Page, 2016). In particular, major sporting events in local cities have been utilized as a powerful agent to enhance the values of destination brand (Min & Lee, 2019; Oshimi & Harada, 2019). It is believed that a local government can have tangible and intangible benefits from hosting an international sporting event; a positive image can be constructed for a host city which can raise its profile on the tourism marketplace (Jeong et al., 2019). Moreover, these events can promote the regional economy by generating new employment opportunities and infrastructural development (Boonsiritomachai & Phonthanukitithaworn, 2019). Although some academics have argued that major sporting events may not always present the destination in a positive light or revitalize the local economy (Badde & Matheson, 2016), many empirical studies have suggested that these events increase the brand value of a host city and contribute to the influx of tourists in the mid to long term by making their experiences unforgettable (Jeong et al., 2020; Kim et al., 2014).
Given the above, international sporting events have acquired renewed importance and played a significant role in the tourism industry (Gibson et al., 2008). Many regional administrations continue to compete for the opportunity to host such occasions (Walters, 2008). However, the services generated by the host cities are becoming homogeneous and equalized overall as there are currently a plethora of international sporting events being offered by local governments. Thus, sporting events should add values to the city’s offerings and provide visitors with a more unique and satisfactory experience that engages them on emotional, physical, intellectual, and spiritual fronts; these aspects should be combined to create a complete tourist experience (Getz, 2008; Pine & Gilmore, 2013). From this perspective, the experience can be considered to possess a new worth and form the focal point of tourists’ loyalty to their destination in the contemporary sport tourism industry (Jeong & Kim, 2019).
Positive experience is an untapped source for differentiation of a service provider’s offerings (Pine & Gilmore, 2013), creating unforgettable images, stimulating senses, reaching out to hearts, and activating thought processes (Song et al., 2015). As the impact of the experience is highlighted, scholars are actively investigating the solid connection between the unique nature of experiences and their ability to be utilized as a marketing or branding tool, particularly with respect to tourism and event field, which demonstrates strong experiential features (Richards, 2019), such as an atmosphere of entertainment and unusual ambiance different from daily routine (Mourão et al., 2022). Scholars are progressively emphasizing that elements pertinent to the experience economy, including entertainment, education, esthetics, and escapism, have formed an essential component of comprehending consumer behavior in the tourism and event sector. Studies have been conducted within a resort (Zaki & Abuzied, 2017), a museum (Radder & Han, 2015; Tang & Qiu, 2015), a theme park (Lee et al., 2020), baseball games (Kwon & Kim, 2018), and a festival (Yazıcı et al., 2017). Nevertheless, there is a dearth of empirical studies which have been performed in order to identify the structural dimensions of sport tourists’ experience and to investigate the relationships between experience, destination image, satisfaction, and consumer behavior within the context of international sporting events.
In light of this, the 18th FINA World Aquatics Championships, organized by Gwangju, a metropolis in South Korea, can represent an excellent case in terms of the experience economy approach, with the implementation of sporting competitions, various cultural programs, and art festivals. The aim of the current research is therefore to: (1) recognize the key elements of experience and their significance as perceived by sport tourists; and (2) to investigate the relationships between experience, destination image, event image, and behavioral intention, with particular reference to the 18th FINA World Aquatics Championships.
Literature Review and Hypothesis Development
18th FINA World Aquatics Championships
Governed by the Fédération Internationale de Natation (FINA, International Swimming Federation), World Aquatics Championships take place every two years in six aquatic sports: swimming, water polo, diving, artistic swimming, open water swimming and high diving. Following the 2018 PyeongChang Winter Olympics, the 18th FINA World Aquatics Championships, one of the world’s mega sporting events, took place in Gwangju, South Korea, for 17 days from July 12 to 28, 2019, during which 2,538 athletes from 194 countries competed for 76 gold medals (Bae, 2019). To accommodate a larger audience, the capacity of the international swimming pool in Nambu University, which was the main stadium for swimming and diving, was expanded from 3,393 to 10,648 seats. The operating facilities were also increased from 3,886 m2 to 8,797 m2, which greatly enhanced convenience for spectators. Moreover, humanoid robots equipped with touchscreens guided visitors to the venues by providing information about the events and athletes (Gwangju Organizing Committee, 2019). Besides the sporting events at the FINA World Championships, Gwangju held various cultural events for 31 days before and after the competition. In addition, a number of assiduously planned traditional and arts programs were administrated and instigated, such as Korean musical recitals, folk games, customary cultural events pertaining to the competing countries, and kimchi making and tasting opportunities (Gwangju Organizing Committee, 2019).
Experience Economy and Measurement Tools
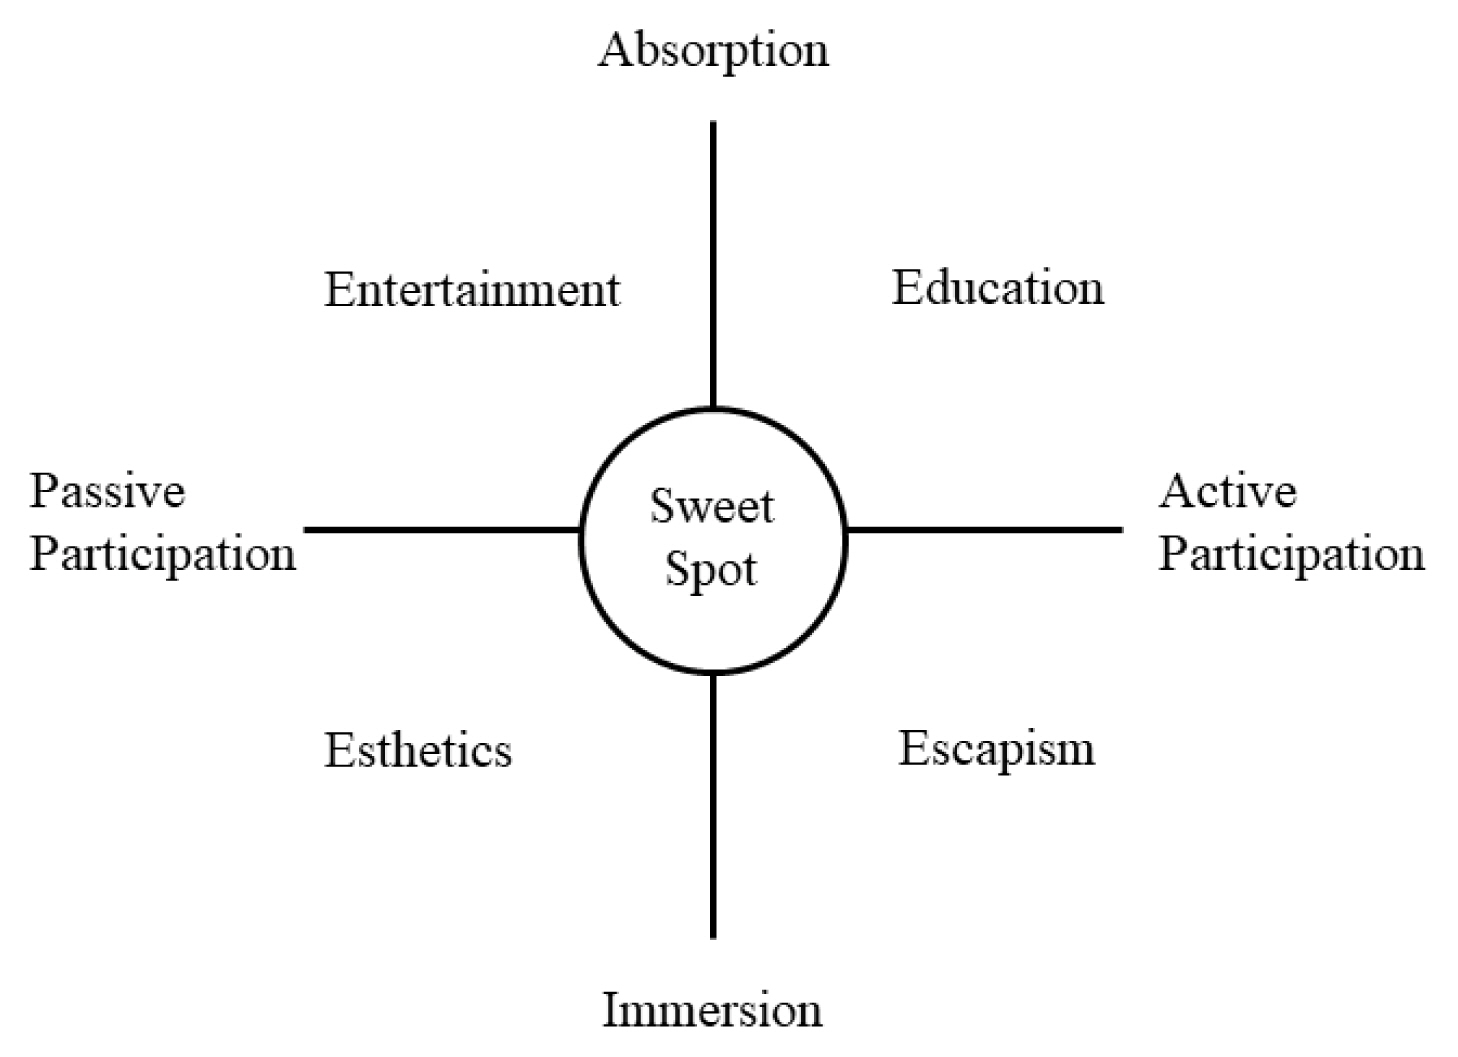
Many consumers spend time and money on experiences (Chen et al., 2012). In the field of consumer behavior, marketing experience (formed by the five senses of taste, sight, smell, hearing, and touch) refers to the consumer’s response to the stimuli provided by an event (Pine & Gilmore, 1999; Schmitt, 1999). While research on consumer behavior previously focused on product utility, it now additionally examines the value of the desired products and services to consumers as well as the extent to which providers offer a unique, memorable experience. Pine & Gilmore(1999)’s experience economy theory classifies experiences into four dimensions (termed the 4Es) according to the level of individual participation (passive and active) and relationship with the environment (absorption and immersion): entertainment, education, esthetics, and escapism. Consumers within entertainment experiences ‘sense’, within educational experiences ‘learn’, within escapist experiences ‘do’, and individuals within esthetic experiences want to ‘be’ in an attractive environment (Jeong et al., 2009).
Entertainment is among the oldest and most developed forms of experience (Hosany & Witham, 2010; Pine & Gilmore, 1999). It is passive because consumers participate indirectly (i.e., by viewing the events rather than by participating in them at the destination). Moreover, it is classified under absorption because the environmental level for consumers to immerse themselves is low (Oh et al., 2007). Spectators obtain a sensory experience by watching a baseball game, observing a parade, or listening to a concert and, accordingly, experience a sense of pleasure or enjoyment. Similar to entertainment, education is in an area of low environmental absorption. However, it involves active participation. People who desire interaction and experiential products through the active participation of the mind and body want to learn through consumption (Oh et al., 2007). For example, tourists in cultural heritage festivals can attend a traditional music/dance class and share a passion for learning about culture. Esthetic experience refers to the enjoyment of being present at the location and immersing oneself in the environment. The level of participation is somewhat passive, as participants remain in a deeply immersed state without changing or influencing the environment (Pine & Gilmore, 1999). This involves perception through the visual, auditory, and olfactory senses provided by the environment (Bitner, 1992). Finally, escapism is among the most frequently used motivations in tourism (Prentice, 2004); it involves active participation in experiential activities and refers to a state of complete immersion in the environment (Pine & Gilmore, 1999). Consumers with a high desire for escapist experiences actively seek places and activities in which to invest their time (Pine & Gilmore, 1999). Further, because tourism provides the time and space for people to escape their normal lives and temporarily enjoy unique experiences (Oh et al., 2007), escaping from daily life is the most important dimension of the tourism experience (Crompton, 1979; Iso-Ahola, 1982).
Experience does not include one of these four dimensions. Instead, all dimensions have distinct degrees of emphasis, where one dimension may be emphasized more than the others are. Therefore, the key factor is to explore different experience factors and develop distinctive factors as catalysts for eliciting others (Mehmetoglu & Engen, 2011) to ultimately find the sweet spot, as illustrated in Figure 1.
Four realms of experience
Since Pine & Gilmore (1998, 1999) provided their theoretical framework for measuring experience using the four dimensions of experience economy theory, scholars in the tourism and service field have presented valid and reliable tools to assess consumers’ experience elements. For instance, Oh et al. (2007) developed the first measurement tool in tourism based on this theory. They extracted four items for each of the four dimensions of entertainment, education, esthetics, and escapism, resulting in 16 items. Researchers in the tourism and sports fields have since conducted numerous studies to measure experience factors using the questionnaire devised by Oh et al. (2007) (e.g., Hwang & Han, 2018; Park et al., 2010; Radder & Han, 2015; Song et al., 2015; Yazici et al., 2017).
In the current research, the four described dimensions of Oh et al. (2007) were applied to the context of the 18th FINA World Aquatics Championships. Sport spectators primarily experience entertainment in the form of watching skilled athletes from all over the world compete and perform. They can also participate in a range of cultural events, interact with each other, cheer for their favorite players and countries, and get away from daily routines, thus engaging in escapist experience. Moreover, spectators can enjoy esthetic experience by immersing themselves in the atmosphere of the iconic arena and the art of the competitions, such as the dynamic motions of athletes in a 27m high diving competition and the strikingly acrobatic moves above the water in an artistic swimming competition. In addition, they obtain educational experiences by examining the techniques of athletes and processing information on the athletes, countries, and history of swimming provided by the event organizers.
Relationship between Experience and Destination Image
Many studies have adopted the term “image” in relation to a destination (Baloglu & McCleary, 1999; Echtner & Ritchie, 2003). Crompton (1979) defined destination image as the assemblage of tourists’ knowledge, beliefs, and impressions on a destination, whereas Gibson et al. (2008) defined it as a mental picture that tourists hold regarding a destination. Despite the fact that the involved properties of destination image mean that it is extremely difficult to quantify its distinct nature with respect to a particular location (Boo et al., 2009), it is broadly believed that in general, destination image is impacted by both cognitive and emotive assessments of any entity or location (Baloglu & Mangaloglu, 2001; Greaves & Skinner, 2010; Hosany et al., 2006). Accordingly, numerous studies have concentrated on recognizing destination image with reference to the cognitive-affective image theory (Baloglu & McCleary, 1999; Frias et al., 2008; Hosany et al., 2006; Lee et al., 2014). The result has been the development of scales that apply to the context of sporting events, including several aspects such as infrastructure, attraction, and value for money (Byon & Zhang, 2010).
There is a general consensus that destination image is dynamic rather than static in nature, changing over time and place, and with the potential to alter within the various stages of tourists’ experience (Lee et al., 2014; Smith et al., 2015; Stylidis & Cherifi, 2018). Many different information sources or agents contribute to the formation of the image pertaining to these disparate components, which encompass advertising strategies generated by the destination, independent data distributors, e.g., magazines, news sources, verbal referral and digital platforms such as YouTube and Instagram (Tasci & Gartner, 2007). Nevertheless, when actually present within a destination, visitors obtain new, real-time, and supplementary information regarding the destination that is frequently of a greater potency than the indirect data they obtained before they arrived (Li et al., 2021).
Scholars have explored the relationship between experience and destination image, consistently suggesting that experience factors are essential for the construction of destination image. Where visitors have a distinctive and memorable time in a destination, e.g., observing a thrilling parade, appreciating the standard of sanitation or safety, finding the generosity of the local people emotive or observing beautiful scenery, they have a greater chance to create a favorable image of destination. Su et al. (2020) examined relationships among heritage travel motivation, tourist engagement, tourists experience, heritage destination image and satisfaction at Hoi An, a UNESCO World Heritage Site in Vietnam, and proposed positive tourists’ experiences are a direct antecedent of destination image and that destination administrators should endeavor to generate memorable experiences in order to induce optimate image of heritage site. Utilizing a conceptual model which illustrated relationships between food experience, place attachment and destination image, Hsu & Scott (2020) reported that in visitors to Macau, the greater the positivity associated with the food experience, the better the destination image. They proposed that any destination wishing to intensify their emotive relationship with visitors should improve the aspect of the experience. Li et al. (2021) carried out an empirical study on relationships among experiences, post-trip destination image, satisfaction, and loyalty in relation to ecotourism, and revealed that acting, fun learning, and emotive experiences had an influence on attribute-based and holistic destination image. In view of earlier studies, this research proposes the following hypotheses:
H1: Experience has a positive effect on destination image.
H1a: Entertainment has a positive effect on destination image.
H1b: Education has a positive effect on destination image.
H1c: Esthetics has a positive effect on destination image.
H1d: Escapism has a positive effect on destination image.
Relationship between Experience and Event Image
The concept of event image is generally considered to be based on the same theoretical foundation as destination image, because a destination hosts a sporting event to attract sport tourists (Hallmann et al., 2010). Nevertheless, event image has received less attention in tourism and sport literature than destination image, and there is currently few well-acknowledged definition or measurement tool for event image (Deng et al., 2015). Gwinner (1997)’s definition of event image is the most frequently referred. According to Gwinner (1997, p. 147), event image is defined as “the cumulative interpretation of meanings or associations attributed to events by consumers”. Furthermore, following Gwinner (1997)’s view of event image, Kaplanidou & Vogt (2007, p. 5) also defined event image as “the mental representations active sport tourism participants have about the organization, environment, physical activity, socialization, fulfilment and emotional involvement with the event” from the perspective of sport tourism. In this regard, Deng et al. (2015) developed a measurement scale for event image, which included five dimensions such as benefit, facility, service, theme, and event content. Deng et al. (2015) suggested benefit was the most important aspect of the event image along with facilities, service, event content, and event theme.
Park & Lee (2018) revealed that festival experiences positively affect festival image to the regional festival in South Korea. Girish & Lee (2019) examined the relationship between the experience factors and event image in Jeju International Ultramarathon race and argued that the cognitive involvement and physiological activities positively influence event image. Thus, in this study, the following research hypotheses are formulated.
H2: Experience has a positive effect on event image.
H2a: Entertainment has a positive effect on event image.
H2b: Education has a positive effect on event image.
H2c: Esthetics has a positive effect on event image.
H2d: Escapism has a positive effect on event image.
Relationship between Destination Image and Behavioral Intention
In the service and marketing fields, behavioral intention is defined as the customer’s willingness and belief to perform a specific future behavior after forming an attitude about a product or service. It is classified into repurchase, revisit, recommendation, and positive word of mouth (Boulding et al., 1993; Fishbein & Ajzen, 1975; Shoemaker & Lewis, 1999). The behavioral intention of spectators at an international sporting event is defined as revisiting other sporting events held in the host city, revisiting the host city, recommending others to visit the host city, or attending sporting events and providing positive opinions about the host city or sporting events (Min & Lee, 2019).
The determinants of behavioral intention are a topic frequently explored in sport tourism and event research, as behavioral intention has been regarded as the decisive factor in the dramatic growth in the popularity of a destination (Jeong et al., 2019). The antecedents of behavioral intention have therefore been the subject of much investigation; one of the most significant factors recognized is destination image (Li et al., 2021; Piramanayagam et al., 2020). This can be appreciated in a straightforward manner as the destination in which tourists opt to invest both financially and with respect to time; they may make the choice to return to somewhere that they have been to before or to explore a new place. Destination marketers and event organizations consider that the way in which tourists view destination image is essential as it is well-established that this can have a large influence on the selection of the sport tourist’s destination (Pike et al., 2018). Furthermore, destination image is reported having an impact on the positive purchasing intention (Allameh et al., 2015; Chen & Phou, 2013; Hallmann et al., 2015; Prayag et al., 2017), steering individuals in a positive manner in the direction of tourism goods and amenities (De Nisco et al., 2015).
In an empirical study of marine sports tourism in Iran, Allameh et al. (2015) tested a theoretical model containing destination image, perceived quality, perceived value, satisfaction, and sport tourists’ loyalty. It was noted that destination image perceived by tourists affects behavioral intention. Similar relations were reported by Hallmann et al. (2015) in their model of destination image on behavioral intention to revisit the destination in relation to winter sport venues; they proposed that interesting sporting events should be established for tourists in order to enhance the destination image and thus promote behavioral intention. Jeong & Kim (2019) also investigated the influence of a destination image on behavioral intention among 311 sport tourists in an international marathon event and presented evidence that the relationship between destination image and behavioral intention is significantly positive. Another study conducted by Akroush et al. (2016) in the tourism industry provided supportive evidence that destination image has a positive relationship with behavioral intention. Based on the empirical perspectives described in the previous studies, the hypothesis below is suggested:
H3: Destination image has a positive effect on behavioral intention.
Relationship between Event Image and Behavioral Intention
Event image is also essential for predicting future behaviors such as repurchase, revisit, and recommendations to others (Chen & Funk, 2010; Ko et al., 2014; Li et al, 2020). Sport spectators’ positive event evaluation will increase their interests in the host region, which will lead to their intention to revisit the destination. Various studies have reported that event image is an antecedent of behavioral intention and has a positive impact (Chen & Funk, 2010; Li et al., 2020; Walker et al., 2013). Thus, in this study, the following research hypothesis is formulated.
H4: Event image has a positive effect on behavioral intention.
Based on the above hypotheses, Figure 2 illustrates the proposed research model.

Proposed hypothetical model
Materials and Methods
Data Collection
In this study, convenience sampling, a non-probability sampling method, was employed to select 346 spectators at the stadium and near the ticket office from July 15 to 27, 2019. It was intended that only sport spectators from other regions participated in this study, and locals were excluded by asking respondents whether they currently live in the host city or not.
Two research assistants who were trained for the survey explained its purpose and content to spectators through face-to-face interviews, after which the participants completed the questionnaires. The study eliminated samples with at least 10% of the questions unanswered or with insincere or unreliable responses. Consequently, 329 responses were retained for the analyses. Of these 329 responses, 50.2% were from women. The most common age group was the 30s (35.3%), followed by those in their 20s, 40s, and 50s (28.6%, 18.6%, and 8.8%, respectively). In terms of occupation, office workers comprised the largest group (108, 35.9%), followed by self-employed (16.4%), students (12.2%), and professional (10.6%). Participants with more than 8,000 USD of monthly household income comprised the largest group at 17.0%. Table 1 presents the characteristics of the study participants.

Sample characteristics (N = 329)
Instruments
In this study, a structured questionnaire based on reliable and valid items from previous studies was employed. First, to measure the event experience factors, questionnaires from prior studies (Hosany & Witham, 2010; Oh et al., 2007; Quadri-Felitti & Fiore, 2013) were revised and supplemented to form the items for entertainment (four questions), education (four questions), esthetics (four questions), and escapism (four questions), resulting in 16 questions. Destination image and event image were measured using three items each, in accordance with Byon & Zhang (2010) and Deng et al. (2015). In addition, four items were adopted to measure behavioral intention based on Zeithaml et al. (1996)’s study. The survey questions were measured using a seven-point Likert scale (1 = strongly disagree, 7 = strongly agree). The content validity, compositional suitability, and applicability of the questionnaire items as well as the questionnaire structure were reviewed by a panel of three professors and three doctoral students in sports marketing and tourism.
Data Analysis
The data from the questionnaires were coded and analyzed according to the purpose of the study. First, the study performed a frequency analysis using SPSS 22.0 to derive the demographic characteristics of the participants. It also conducted a reliability analysis to verify the validity of the survey tools. A Cronbach’s á of at least .7 was applied as the threshold (Nunnally & Bernstein, 1994).
Subsequently, a confirmatory factor analysis using AMOS 22.0 was conducted to verify the model fit of the collected data as well as the convergent validity. Some scholars recommend using at least one index to verify the model fit (Hair et al., 2010). In this study, the widely used goodness-of-fit index was employed. For the chi-squared statistics divided by the degrees of freedom ratio (CMIN/df), a criterion of 3 or less is generally employed (Kline, 1998). However, as the values are sensitive to sample sizes of 200 or more, Wheaton (1987) suggested using a criterion of 5 or less. According to Wheaton (1987), a criterion of 5 or less is used for CMIN/df, in addition to .9 or more for the comparative fit index (CFI), .9 or more for the Tucker–Lewis Index (TLI), .10 or less for the root mean square error of approximation (RMSEA), and .08 or less for the standardized root mean square residual (SRMR) (Bentler, 1990; Hu & Bentler, 1999; Shevlin & Miles, 1998). Finally, to identify the effects of the experience factors of the spectators of the FINA World Championships on destination image and event image as well as the effects of destination image and event image on behavioral intention, we employed structural equation modeling (SEM) using AMOS 22.0. The statistical significance level was set to p < .05.
Results
Reliability and Validity
The confirmatory factor analysis regarding the fit of the measurement model is CMIN = 891.469, df = 276, CMIN/df = 3.230, CFI = .934, TLI = .922, RMSEA = .082, and SRMR = .051, meeting the goodness-of-fit criteria. Average variance extracted (AVE) and composite reliability (CR) were used to verify convergent validity (Fornell & Larcker, 1981). As shown in Table 2, AVE ranged from .534 to .839 and construct reliability from .821 to .940, thus meeting the criteria of AVE > .5 and CR > .7 and confirming construct validity. All the dimensions satisfied the reliability criterion of .7 or higher, securing internal consistency.

Results of the measurement model
Construct Intercorrelations
A correlation analysis was performed to identify the correlation between the factors set in this study. As shown in Table 3, the factors demonstrated a static correlation at a statistically significant level (p < .001). Furthermore, all the correlation coefficients were less than .85, thus confirming discriminant validity (Kline, 1998).

Correlations of the variables and discriminant validity
Hypotheses Testing
According to the model fit evaluation to verify the fit of the structural model set in this study, CMIN = 936.438, df = 257, CMIN/df = 3.644, CFI = .921, TLI = .908, RMSEA = .089, and SRMR = .072; all the indices satisfied the goodness-of-fit criteria. Thus, the study hypotheses and model can explain the data adequately, and it is reasonable to interpret them empirically.
Table 4 and Figure 2 present the results of the SEM analysis of the research model. First, for H1, the three dimensions of entertainment (H1a), esthetics (H1c), and escapism (H1d) showed a significant positive effect on destination image. The entertainment experience showed the highest path coefficient of .589 (t value = 7.668, p = .000), followed by escapism (path coefficient = .207, t value = 2.537, p = .011) and esthetics (path coefficient = .148, t value = 1.999, p = .046). Education was rejected with a path coefficient of −.030, t value of −.663, and p value of .507. Second, for H2, entertainment (H2a) was supported with a path coefficient of .541, t value of 6.235, and p value of .000 as well as escapism (H2d) with a path coefficient of .321, t value of 2.584, and p value of .010 and esthetics (H2c) with a path coefficient of .145, t value of 2.162, and p value of .031. However, education (H2b) was rejected with path coefficients of .078, t values of 1.513, and p values of .130. Third, for H3, the path coefficient = .345, t value = 7.871, and p = .000; thus, it was supported. Fourth, for H4, the path coefficient = .774, t value = 18.271, and p = .000; thus, it was supported.

Results of the hypothesis testing

Results of the structural equation modeling analysis
Discussion and Conclusion
In response to a recent call for tourism researchers to develop integrative models using tourists’ experience (Li et al., 2021; Yazıcı et al., 2017), this research explored sport tourists’ experience and investigated the structural relationships among experience, event image, destination image, and behavioral intention within the context of an international sporting event by applying the experience economy framework and its four dimensions (Pine & Gilmore, 1999).
First, among the sporting event experience factors, entertainment, esthetics, and escapism showed a positive impact on destination image. Entertainment, esthetics, and escapism also had a significant positive influence on event images. However, the results indicate that education had a significant impact on neither destination image nor event image. The findings are consistent with those of previous studies in sporting event contexts (Kim & Kim, 2017; Kwon & Kim, 2018) as well as in other fields of leisure and tourism (Hosany & Witham, 2010; Kim & In, 2014; Radder & Han, 2015). Despite its suggested importance in literature (Baloglu & McCleary, 1999; Beerli & Martin, 2004) and the nature of cultural programs, educational experience does not have any statistically significant influence on destination image and event image, which is most likely due to contents and quality. Most of cultural programs in FINA World Aquatics Championships were rather one-off event, without systematic educational approach or framework. Furthermore, this result could reflect an international sporting event-specific contingency in the sample examined in this study. Similar to Mehmetoglu & Engen (2011)’s argument, this research demonstrates that experiences need to be generated and staged in relation to their settings.
More specifically, the findings of this study provide strong support for the notion that entertainment dimension is the most powerful determinants of the outcome variables such as destination image and event image in an international sporting event. Considering that the essential characteristic of sports is experience, it is important to provide sports consumers with unique experiences of enjoyment. Entertainment in sporting events refers to sports consumers’ feelings of pleasure and engagement in playful activities including the excitement and beauty of the game and dramatic scenes that sports deliver (Unger & Keman, 1983). Spectators become focused while watching a competition akin to them immersing themselves in the dramatic scenes. Meanwhile, sports fans find enjoyment when they cheer for the same athletes or teams and feel united by actively creating a unique stadium atmosphere. They can also be entertained by visual guides using AI robots or drones, virtual reality activities, as well as food and refreshments. In other words, entertainment is incorporated into all the products and services that can provide spectators with enjoyment. It is therefore crucial to stage memorable experiences for sports consumers by intensively promoting marketing strategies and using such entertainment experience elements.
Escapism is also important, as actively cheering and immersing oneself into the game is consistent with the escapism criteria presented by Pine & Gilmore (1999). Holbrook & Hirschman (1982) argued that sporting event spectators fantasize about being part of the game when they are absorbed in the action. That is, sports consumers who feel a strong connection with the team or players tend to engage their emotions with the athletes or game, vicariously satisfying their suppressed desires (Spinda, 2011). The international sporting event thus allows a spectator to exist as himself/herself in the stadium in contrast to his/her real life, as it provides the time and space to escape daily routine through delight, enjoyment, and emotion. Thus, the escapism of sporting events is a key element of experiential marketing.
Esthetic experience involves spectators’ appreciation of the elegance and beauty of the sport itself (Madrigal, 2006). The grand scale of the stadiums at the Olympics and FIFA World Cup, for example, offers an esthetic experience in terms of the physical environment. Furthermore, the outstanding performance and physical charm of the athletes provide unique memories for sports consumers. Therefore, while beautiful stadiums and comfortable seating are important, creating a better environment enhances the esthetic experience, which allows players to perform their best and sports consumers to concentrate on the remarkable skills of the athletes. Yazıcı et al. (2017) supported the results of this study, which festival participants with inauthentic, alienated, and routine daily lives occasionally wanted to escape or disconnect in search of a unique experience, thereby satisfying their travel experience.
Despite its suggested importance (Baloglu & McCleary, 1999; Beerli & Martin, 2004) and the nature of cultural programs, educational experience does not have any statistically significant influence on destination image and satisfaction, which is most likely due to contents and quality. Most of cultural programs in the FINA World Aquatics Championships were rather one-off event, without systematic educational approach or framework. Furthermore, this result could reflect an international sporting event-specific contingency in the sample examined in this study. Similar to Mehmetoglu & Engen (2011)’s argument, this research demonstrates that experiences need to be generated and staged in relation to their settings.
Second, this study demonstrated that destination image and event image have a significantly positive effect on behavioral intention. This finding is in agreement with those of previous studies that found that image and behavioral intention are related constructs and that image significantly affects behavioral intention in the context of sporting events (Allameh et al., 2015; Chen & Funk, 2010; Kaplanidou & Vogt, 2007; Kim et al., 2016; Li et al., 2020; Liu, 2013; Moon et al., 2013; Walker et al., 2013). In addition, Kim et al. (2016) revealed that the image of the host city, including its infrastructure, attraction, value, and interest, affects revisit intention and willingness to recommend a destination during the Formula 1 Chinese Grand Prix, which is consistent with the findings of this study. Moreover, Moon et al. (2013) noted that spectators’ cognitive and emotional images of the destination during the 2009 Tour de Korea encouraged them to share positive feedback about the host cities with others, similar to the results in this study. Li et al. (2020) argued that event image is a strong antecedent of the behavioral intention of visitors of beer festival. Similarly, Joo & Lee (2019) found a close relationship between event image and behavioral intention in professional golf tour.
This study provides useful practical implications for local governments and event organizers. The consumption of leisure activities is experiential in nature, and it involves absorbing the symbolic meanings associated with the more subjective characteristics of sports consumers (Madrigal, 2006). Thus, it is natural that the experience factors of sporting events are investigated using Pine & Gilmore (1999)’s model, which provides a useful framework for helping researchers and practitioners comprehend sports consumers’ preferences. This is because the experience dimensions have significant effects on destination image and event image, which in turn drive behavioral intention. Local governments and major sporting event organizing committees would thus benefit from identifying the experience factors affecting spectators’ behaviors and establishing differentiated marketing strategies.
The presented findings imply that organizers should provide spectators with not only high-quality services, high-skills and performance, and well-designed stadiums but also a creative sporting event environment in which all types of experiences can occur. This can encourage spectators to participate in an event actively as actors, by chanting, singing, and interacting to create a unique atmosphere (Woratschek et al., 2014). Practitioners should also offer visitors enjoyable programs such as photoshoots and signing events with famous athletes, cultural exhibitions, musical performances, and children’s activities to generate unique and memorable experiences. However, these results should not be interpreted to indicate that organizations can ignore the quality of a sporting event (Ko et al., 2011); up-to-date event information, high-quality concessions, and easy-to-read signage still influence spectators’ images to destination and event, and therefore contribute to revisit intention (Joo & Lee, 2019; Park & Lee, 2018).
In addition, it is not surprising that destination image and event image markedly affected spectators’ revisit intention. The attractiveness of the destination and the event must be enhanced by promoting it and communicating with visitors not only during sporting events but also before and after. Various media promotion strategies incorporating social media such as YouTube and Facebook can be adopted to swiftly disseminate information on the progress of stadium construction, status of the host region, and results of competitions or information on prominent athletes. Meanwhile, as the international sporting event is linked to the region, it is also vital to provide various experience factors to spectators through cultural tourism programs alongside the sports events. Improving destination image and event image can significantly affect local tourism.
Despite the importance of the findings, this study has its limitations. The majority of the participants in this study were sport tourists and therefore had not enough time to fill the survey. The shortage of time may have impacted the quality and authenticity of responses. Second, although the sample size of the research was sufficient, this study was limited to a single sporting event in South Korea. Future research should increase the scope of the research. Finally, this study sought to explore the dimensions of spectators’ experience using an existing measurement tool based on experience economy theory. It would thus be meaningful to develop additional items to identify and assess other facets of sporting event experience and test the relationship with spectators’ behavioral intention further.