Effect of participating in physical fitness assessment on healthcare costs in Korean adults
Article information
Abstract
This study assessed the effects of participation in physical fitness assessment on healthcare costs by analyzing healthcare costs in those who did and did not participate in the physical fitness assessment for the National Fitness Award project conducted by the Korean government. The National Health Insurance Service database was used to compare healthcare costs in the years before and after participation in the National Fitness Award project for 318 individuals who participated (participation group) and 627 individuals who did not participate (non-participation group). Healthcare costs in the years before and after participation was different between the two groups. This difference was corrected for further analysis. Results revealed that the visit days (inpatient) was -0.23±8.16 and 1.53±8.16 days in the participation and non-participation groups, respectively, and was longer in the non-participation group. The change in the total healthcare costs was 28.56±272.88 ten-thousand KRW in the participation group and 53.36±275.33 ten-thousand KRW in the non-participation group, showing an annual difference of approximately 240,000 KRW in healthcare costs between the two groups. These findings suggest that participating in physical fitness assessments can have positive effects on participation in physical activities, thereby reducing healthcare costs.
Introduction
The aging of the South Korean population has increased the public's interest in extending healthy lifespan, longevity, and improving the quality of life through physical activities. Health is determined by both personal and environmental factors. Individual health behaviours including physical activity, smoking, sobriety, and nutrition contribute to 22–51% of the health, leading to increased interest in health-promoting behaviours (Ministry of Health and Welfare of South Korea, 2015). Physical activities contribute to the prevention and management of non-communicable diseases (NCB) such as heart disease, type 2 diabetes, and various cancers and improvement of quality of life, including relief from depression and anxiety. In fact, the lack of physical activity is the fourth leading cause of death in the world after hypertension, smoking, and hyperglycemia (World Health Organization, 2009). Thus, developed countries are seeking to improve physical fitness to improve the health of the public and reduce healthcare costs (Piercy et al., 2018; Nasir & Okunrintemi, 2019; Janssen, 2012)).
In a study of the relationship between physical activity and healthcare costs, those who engaged in the recommended amount of physical activity were shown to reduce healthcare costs by approximately 1.7 million won ($1,437) per year compared to those who did not engage in the recommended amount (Carlson et al., 2015). Furthermore, those elderly people who practiced walking spent approximately 125,303 won less per year on healthcare costs than those who did not (Go, 2015).
In addition to physical activity, physical fitness is also a strong predictor of disease prevalence and mortality (Blair et al., 2001; Kodama et al., 2009; Myers et al., 2004; Ross et al., 2016), and it is an important individual factor required to perform daily activities. Assessment of physical fitness, which is the basis of all daily life activities must be conducted in addition to medical examinations to maintain and improve health (Wilder et al., 2006). Assessment of physical fitness can provide objective information for primary care providers to suggest guidelines for the physical activity of patients. The concept of physical fitness generally includes cardiovascular endurance, flexibility, muscle strength, and body composition (US Department of Health and Human Services, 2018). Guidelines based on objective results may be useful to promote health and physical fitness (Purath et al., 2009). As such, physical fitness is an essential factor for health management and affects healthcare costs (Bachmann et al., 2015). Bachmann et al. (2015) reported that high cardiorespiratory fitness in middle-aged individuals is closely related to low healthcare costs, suggesting that cardiorespiratory fitness can help reduce healthcare costs in an aging society.
Physical activities are related to an individual's physical fitness and affect health and healthcare costs caused by diseases (Bachmann et al., 2015; Okunrintemi et al. 2019; Ding et al., 2016). Thus, the Korean government is encouraging the National Fitness Award project to promote public health by promoting sports activities. The National Fitness Award project grants different levels based on physical fitness through relative evaluation, following physical fitness assessment. It provides optimal guidelines on exercises that are suitable for a person's physical fitness level including information on individual fitness compared to the standard fitness required for disease prevention and independent living. Similar systems are implemented in the US and Europe; however, those systems mainly focus on children and adolescents. The National Fitness Award project helps to evaluate the physical fitness of various groups including elementary, middle, and high school students, adults, and the elderly. It provides exercise guidelines and is acknowledged worldwide for its excellence in promoting physical activities.
Previous studies in Korea assessed the relationship of healthcare costs with cardiorespiratory fitness (Bachmann et al., 2015) and the number of physical activities (Carlson et al., 2015; Go, 2015). However, there is a lack of studies that analyze differences in medical expansion and medical service usage after physical fitness assessment and provision of customized exercise guidelines. This study evaluates the effects of participation in physical fitness assessment on healthcare costs through an analysis of healthcare costs in those who did and did not participate in the physical fitness assessment (The National Fitness Award project).
Methods
Study design
This study compared and analyzed changes in healthcare costs for the year previous to and the year following participation between the non-participating (control) and participating groups to understand the effect of participation in the physical fitness evaluation—after adjusting for changes in medical use trends such as changes in the number of participants. The study included those who participated in the physical fitness assessment of the National Fitness Award project (and agreed to the use of their personal information) and those who did not participate in the physical fitness assessment to assess differences in the healthcare costs. The participants were matched in a ratio of 1:2 (participating group: non-participating group) using the personal information of the participating group to compensate for bias that may occur due to factors other than participation in the physical fitness assessment. The variables used for matching and selection of participants in the non-participating group are shown in Table 1.
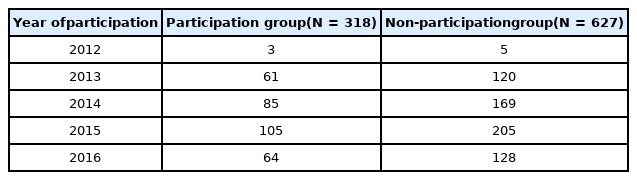
Distribution of participants by year
The National Health Insurance Service database from 2011–2016 was used. For the Healthcare utilization of the two groups, the number of inpatient visits, number of outpatient visits, number of prescriptions, visit days (inpatient), treatment days (outpatient) and prescription days were assessed. Additionally, the total healthcare cost was compared between the two groups.
Participants
A total of 318 participants who underwent physical fitness assessment for the National Fitness Award project and agreed to the use of their personal information were included in the participating group, and 627 participants were who were matched for the previous year's characteristic information (sex, age, income, etc.) of the participation group were randomly selected and included in the non-participation group. The distribution of the participation and non-participation groups is shown in Table 2. This study was approved by the Institutional Review Board (IRB) of the Korean Institute of Sports Science.

Variables used for matching for control extraction
Statistical analysis
All results obtained in this study were analyzed using SAS 9.4 (SAS Institute, Cary, NC, USA) program, and the detailed statistical analysis methods are as follows. Frequency analysis and descriptive statistics were conducted to compare the number of cases and demographic characteristics per year of participation of the participation and non-participation groups. The Wilcoxon signed rank test was conducted to compare the healthcare utilization and healthcare costs in the year before and the year after participation between the two groups. Analysis of covariance (ANCOVA) was conducted using the value of the previous year of participation as a covariance for comparison between the two groups. A p-value of less than 0.05 was considered statistically significant.
Results
Comparison of the healthcare utilization and healthcare costs before and after participation in physical fitness assessment
Table 3 shows the results of the Wilcoxon signed rank test that compared the healthcare utilization and costs in the year before and the year after participation between the participation and non-participation groups.

Comparison of healthcare costs before and after participation for each group
In the participation group, the cases of participants requiring number of prescriptions significantly increased from 16.7 ± 15.89 in the year before participation to 16.53 ± 14.02 in the year after participation (p=0.007), The prescription days increased from 270.31 ± 292.85 days in the year before participation to 295.1 ± 303.69 days in the year after participation (p=0.023). In addition, the total healthcare costs increased from 173.93 ± 240.20 ten-thousand KRW in the year before participation to 162.60 ± 204.20 ten-thousand KRW (p<0.0001). Healthcare costs (outpatient) increased from 61.66 ± 96.56 ten-thousand KRW in the year before participation to 76.92 ± 127.15 ten-thousand KRW in the year after participation (p=0.0002). The Healthcare costs (prescription) increased from 49.99 ± 64.06 ten-thousand KRW in the year before participation to 56.48 ± 66.70 ten-thousand KRW in the year after participation (p=<0.0001).
In the non-participation group, the number of impatient visits increased from 0.23 ± 0.82 in the year before participation to 0.36 ± 1.14 in the year after participation (p=0.001). The visit days (inpatient) increased significantly from 1.96 ± 9.59 days to 3.49 ± 17.42 days (p=0.033). The prescription days also increased from 275.76 ± 271.16 days to 299.37 ± 281.59 (p=0.003). The total medical care costs significantly increased from 202.49 ± 287.99 ten-thousand KRW in the year before participation to 216.25 ± 315.16 ten-thousand KRW in the year after participation (p<0.0001). The Healthcare costs (inpatient) increased from 33.96 ± 144.03 ten-thousand KRW to 60.43 ± 237.73 ten-thousand KRW (p=0.008). The Healthcare costs (outpatient) increased in the year after participation from 57.91 ± 62.52 ten-thousand KRW to 69.81 ± 118.12 ten-thousand KRW (p<0.0001). Additionally, The healthcare costs (prescription) increased from 52.68 ± 57.26 ten-thousand KRW in the year before participation to 61.31 ± 69.15 ten-thousand KRW in the year after participation (p<.0001).
Comparison of the healthcare utilization and healthcare costs between groups
Covariate analysis was conducted after adjusting for the value of the year before participation to compare differences in the healthcare utilization and costs between the participation and non-participation groups. The results are summarized in Table 4.

Group comparison in healthcare costs use: before-after change
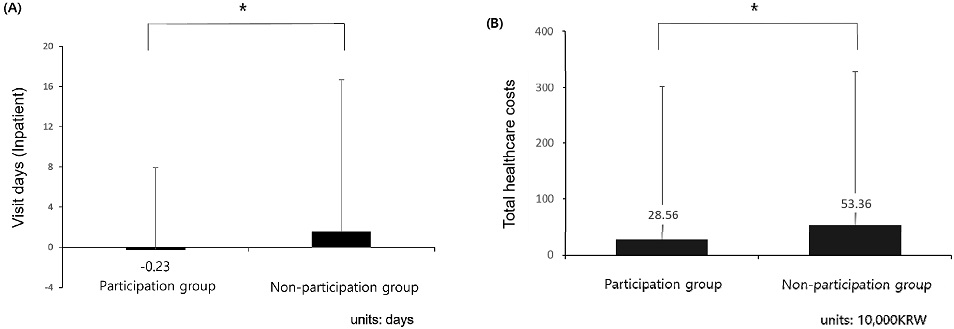
The change in the visit days for inpatients was -0.23 ± 8.16 and 1.53 ± 15.13 days in the participation and non-participation groups, respectively, and was significantly different between the two groups (p=0.024). The change in the healthcare costs were 28.56 ± 272.88 ten-thousand KRW in the participation group and 53.36 ± 275.33 ten-thousand KRW in the non-participation group, which was significantly different between the two groups (p=0.038). These results suggest that the total visit days and total healthcare costs were significantly lower in the participation group than in the non-participation group.
Discussion
Participation in physical activities is a key factor for the prevention of disease and health promotion. As national medical expenses have increased with the aging of the population, the social role of physical activities is currently emphasized. Thus, this study objectively assesses the effects of the National Fitness Award project on the healthcare utilization and costs in those who did and did not participate in physical fitness assessment.
Comparison of the healthcare utilization and costs showed that the number of prescriptions, prescription days, the total healthcare costs, cost of outpatient and prescription were increased in both groups. This finding may be attributed to the total healthcare cost coverages that are changed each year according to changes in health and medical policies. To correct for such bias, the difference-in-difference analysis method was used to compare the two groups. As shown in Figure 1, the visit days (inpatient) was greater in the non-participation group with 1.53±8.16 days compared to the participation group with -0.23±8.16 days. The change in the total healthcare cost was 28.56±272.88 and 53.36±275.33 ten-thousand KRW in the participation and non-participation groups, respectively, showing an annual difference of approximately 240,000 KRW in healthcare costs between the two groups. Participants in both groups were relatively healthy in the year of participation in physical fitness assessment, and in the year following participation, there was a significant difference only in the visit days, which is a relatively significant event. This is thought to have caused differences in the total healthcare costs. These findings suggest that physical activity promotion projects such as physical fitness assessment and provision of customized exercise guidelines can affect individual health management behaviours, thereby reducing medical expenses. This finding is significant as it was obtained from quantitative analysis based on real-life medical expenses of participants rather than from societal value creation effects using a social value measurement system (S-RIO).
Comparison of differences between physical fitness assessment and healthcare costs for each group
Note. (A) Visit days (inpatient), (B) Total healthcare costs, * Significant differences for p< .05
This study compared the healthcare costs of those who participated in physical fitness assessment (National Fitness Award project) and those who did not participate and had similar characteristics. Thus, our study could not be directly compared to previous studies. However, our finding is consistent with a previous study that reported that participation in physical activities was related to the reduction in healthcare costs (Janssen, 2012). Janssen (2012) compared adults in Canada who participated and did not participate in physical activities and provided an estimate of healthcare costs. Direct, indirect, and total health care costs in those who did not participate in physical activities were $2.4 billion, $4.3 billion, and $6.8 billion, respectively, which accounted for 3.8%, 3.6%, and 3.7% of total healthcare costs. Carlsone et al. (2015) compared the healthcare costs of 51,165 Americans by linking the number of physical activities and the cost of medical use. The participants were divided into groups—those who engaged in the recommended amount of physical activity; those who did not meet the recommended amount; and those who did not engage in physical activities at all. In that study, the difference in the annual medical cost between those who did and did not participate at all and between those who engaged in and those who did not meet the recommended amount was $1,437 (approximately 1.7 million KRW) and $713 (approximately 850,000 KRW), respectively. Engaging in the recommended amount of physical activity was shown to reduce healthcare costs, which is supported by our findings.
Physical activities reduce healthcare costs not only in healthy people but also in those with chronic diseases. Bae et al. (2011) reported that regular exercise can save 90,000 KRW in healthcare costs per one hypertension patient in the public sector, which is equivalent to 480 billion KRW nationwide in Korea. Okunrintemi et al. (2019) analyzed trends related to physical activity, sociodemographic factors, and healthcare costs in US women with cardiovascular disease (CVD) using the data of the Medical Expenditure Panel Survey from 2006–2015. Those women with CVD who did not engage in physical activities showed a higher health care cost compared to those who engaged in the recommended amount of physical activity, suggesting that efforts must be made to increase the amount of physical activity. As such, physical activities are effective in reducing medical expenses for chronic diseases such as hypertension and CVD.
In addition to physical activities, physical fitness also affects healthcare costs (Bachmann et al., 2015). The study by Bachmann et al. analyzed the relationship between cardiorespiratory fitness and healthcare costs in 19,751 Americans at the age of 49 who underwent a cardiorespiratory fitness test and were covered by Medicare insurance from 1999 to 2009. They found one metabolic equivalent (MET) decreased 6.8% and 6.7% of healthcare costs in men and women, respectively (Bachmann et al., 2015). This suggests that high cardiorespiratory fitness in middle-aged people is closely related to low healthcare costs and may help to reduce healthcare costs in an aging society.
In a previous study of the elderly, Go (2015) analyzed the reduction in healthcare costs according to the participation of the elderly in exercises. Data of 54,186 elderly people over the age of 65 were analyzed using the health insurance cohort DB from 2001–2010. The results indicated that walking once a week for 30 minutes reduced 125,303 KRW in annual healthcare costs. In addition, walking more than three days reduced more medical expenses than walking one to two days a week. Son et al. (2015) evaluated the effects of senility on healthcare costs in the elderly in Korea. Senility was assessed by measuring weight loss, fatigue, grip strength, gait speed, and a lower amount of physical activity. The physical activities and physical fitness (grip strength) of the elderly were major factors of senility, and the average monthly medical cost for healthy, previously senile, and senile elderly people was 67,100, 73,800, and 88,900 KRW, respectively, suggesting that senility increased the average deductible monthly medical expense. These findings suggest that in general, physical activities, participation in exercise, and physical fitness had effects on healthcare costs. Our findings support these studies on the differences in the total medical cost according to participation in physical fitness assessments.
In this study, healthcare cost were calculated as health insurance claim costs. Expenses that are not covered by health insurance were excluded. Thus, the effects on reduced healthcare costs from participating in physical fitness assessment may be further increased. The National Fitness Award project can track changes in the usage of medical care before and after the project through panel research or the establishment of a cohort, and the effects of other policy changes can be simultaneously evaluated. Moreover, assessing the relationship of the results with a health insurance claim data source (secondary data), the study can be further expanded to be used for policies and reduce the possibility of a failed follow-up.
This study is the first to show that physical fitness assessments and provision of customized exercise guidelines, in addition to continuous physical activity or fitness level, may reduce healthcare costs. Participation in physical fitness assessment is a step that is necessary for regular physical activity and increased physical fitness and can also be a motivating method for continuous participation in physical activities. Assessment of physical fitness and customized guidelines for exercises are the first steps required for behavioural changes of those who do not participate in physical activities. Our findings suggest that experimental personal physical fitness assessment and customized guidelines on exercise, which is different from education materials on the importance and recommended amount of physical activities to encourage physical activities, can reduce the medical expense for the public.
Conclusions
To ascertain an objective relationship between participation in physical fitness assessment and healthcare costs, the National Health Insurance Service database from 2011–2016 was used to evaluate the healthcare utilization and costs in the year before and after participation in two groups—those who did and did not participate in the National Fitness Award project. The visit days was longer in the non-participation than in the participation group, and the total healthcare costs was also approximately 240,000 KRW higher in the non-participating group. Future studies should investigate the characteristics (income quantile and economic level) of sports welfare project participants and assess the relationship with a reduction in medical expenses as data for determining resource allocation priorities.
Acknowledgements
This study was supported by the National Health Promotion.
References
Bachmann, J. M., DeFina, L. F., Franzini, L., Gao, A., Leonard, D. S., Cooper, K. H., Berry, J. D., & Willis, B. L. (2015). Cardiorespiratory fitness in middle age and health care costs in later life. Journal of the American College of Cardiology, 66(17), 1876–1885.
10.1016/j.jacc.2015.08.030.Bae, J. J., Lee, B. Y., Choi, J. W., & Jeong, I. G. (2011). The Relationship on an Isokinetic for the Ankle Joint Muscular and Anaerobic Power on the Record of Elite Short Speed Skating Athletes. Journal of Sport and Leisure Studies, 43(2), 855–864.
10.51979/KSSLS.2011.02.43.855.Blair, S. N., Cheng, Y., & Holder, J. S. (2001). Is physical activity or physical fitness more important in defining health benefits? Medicine and Science in Sports and Exercise, 33(6; SUPP), S379–S399.
10.1097/00005768-200106001-00007.Carlson, S. A., Fulton, J. E., Pratt, M., Yang, Z., & Adams, E. K. (2015). Inadequate physical activity and health care expenditures in the United States. Progress in Cardiovascular Diseases, 57(4), 315–323.
10.1016/j.pcad.2014.08.002.Colley, R. C., Butler, G., Garriguet, D., Prince, S. A., & Roberts, K. C. (2018). Comparison of self-reported and accelerometer-measured physical activity in Canadian adults. Health Rep, 29(12), 3–15.
Ding, D., Lawson, K. D., Kolbe-Alexander, T. L., Finkelstein, E. A., Katzmarzyk, P. T., Van Mechelen, W., ... & Lancet Physical Activity Series 2 Executive Committee. (2016). The economic burden of physical inactivity: a global analysis of major non-communicable diseases. The Lancet, 388(10051), 1311–1324.
10.1016/S0140-6736(16)30383-X.Go, S. J. (2015). The effects and policy implications of health exercise for the elderly. Ministry of Health and Welfare Forum, 2015 (7).
Janssen, I. (2012). Health care costs of physical inactivity in Canadian adults. Applied Physiology Nutrition, and Metabolism, 37(4), 803–806.
10.1139/h2012-061.Kodama, S., Saito, K., Tanaka, S., Maki, M., Yachi, Y., Asumi, M., Sugawara, A., Totsuka, K., Shimano, H., Ohashi, Y., Yamada, N., & Sone, H. (2009). Cardiorespiratory fitness as a quantitative predictor of all-cause mortality and cardiovascular events in healthy men and women: a meta-analysis. JAMA, 301(19), 2024–2035.
10.1001/jama.2009.681.Ministry of Health and Welfare (2015). Korea Health Promotion Development Institute. 『The 4th Comprehensive National Health Promotion Plan 2016~20200』
.Myers, J., Kaykha, A., George, S., Abella, J., Zaheer, N., Lear, S., Yamazaki, T., & Froelicher, V. (2004). Fitness versus physical activity patterns in predicting mortality in men. The American Journal of Medicine, 117(12), 912–918.
10.1016/j.amjmed.2004.06.047.Nasir, K., & Okunrintemi, V. (2019). Association of patient-reported experiences with health resource utilization and cost among US adult population, medical expenditure panel survey (MEPS), 2010–13. International Journal for Quality in Health Care, 31(7), 547–555.
10.1093/intqhc/mzy217.Okunrintemi, V., Benson, E. M. A., Tibuakuu, M., Zhao, D., Ogunmoroti, O., Valero-Elizondo, J., Gulati, M., Nasir, K., & Michos, E. D. (2019). Trends and costs associated with suboptimal physical activity among US women with cardiovascular disease. JAMA network open, 2(4), e191977-e191977.
10.1001/jamanetworkopen.2019.1977.Piercy, K. L., Troiano, R. P., Ballard, R. M., Carlson, S. A., Fulton, J. E., Galuska, D. A., George, S. M., & Olson, R. D. (2018). The physical activity guidelines for Americans. JAMA, 320(19), 2020–2028.
10.1001/jama.2018.14854.Purath, J., Buchholz, S. W., & Kark, D. L. (2009). Physical fitness assessment of older adults in the primary care setting. Journal of the American Academy of Nurse Practitioners, 21(2), 101–107.
10.1111/j.1745-7599.2008.00391.x.Ross, R., Blair, S. N., Arena, R., Church, T. S., Després, J. P., Franklin, B. A., ... & Wisløff, U. (2016). Importance of assessing cardiorespiratory fitness in clinical practice: a case for fitness as a clinical vital sign: a scientific statement from the American Heart Association. Circulation, 134(24), e653-e699.
10.1161/CIR.0000000000000461.Son, J. H., Kim, S. Y., Won, C. W., Choi, H. R., Kim, B. S., & Park, M. S. (2015). Physical frailty predicts medical expenses in community-dwelling, elderly patients: three-year prospective findings from living profiles of older people surveys in Korea. European Geriatric Medicine, 6 (5), 412–416.
10.1016/j.eurger.2015.05.003.US Department of Health and Human Services. (2018). Physical activity guidelines advisory committee. Department of Health and Human Services.
Wilder, R. P., Greene, J. A., Winters, K. L., Long III, W. B., Gubler, K. D., & Edlich, R. (2006). Physical fitness assessment: an update. Journal of Long-term Effects of Medical Implants, 16(2).
10.1615/JLongTermEffMedImplants.v16.i2.90.World Health Organization: WHO (2009). Global health risks: mortality and burden of disease attributable to selected major risk. World Health Organization.