Dynamic Coordination Phase and Joint Profiles: Cluster and Fixed-point Shift Techniques
Article information
Abstract
This study aims to represent a more preferential bilateral movement template by introducing empirical measures of cluster (Experiment 1) and fixed-point shift (Experiment 2) during the bimanual coordination. We showed how the phase dynamics can be calculated using the cluster method (analysis 1). Relatively stable patterns defined by the cluster process were employed for the fixed-point shift calculation to compare three joint oscillations (wrist, elbow, and shoulder; Analysis 2). The analysis revealed that (i) anti-phase coordination was less stable underlying the cluster phase and amplitude analysis; a significance that was mainly driven by higher radial variability. (ii) The three joint couplings and noise oscillations showed that they were wider for the distal (wrist) than the proximal (shoulder) areas. (iii) Repetition with one joint (i.e., wrist) may be significantly associated with trial effects; thus, using data of pick only one joint (wrist) but collecting data from different (three) joints seems more reliable to be a typical dependent variable for the trial effect. Observations and suggestions derived from this aspect represent how the bilateral movement calculation methods can be applied to measure the type of coordination stability eliminating of the learning effect stemming from numerous trials.
Bilateral movement has been extensively investigated in movement science (Frank & Richardson, 2010). Such a characteristic (i.e., synchrony) including a detailed understanding of its significant implications for symmetric patterns (Mo et al., 2020) and elementary coordination has been considered a fundamental means of evaluating the stability of one’s self with others (Paladino et al., 2010). In particular, measurements have played an important role in identifying collective variables and their dynamics that govern the formation and change of patterns in a variety of coordination tasks (Walter & Swinnen, 1992; Kenville et al., 2020). Many studies have accounted for the relative stability between in-phase (synchronized movements using homologous muscles of the limbs) and anti-phase (alternating movements, 180° out of phase) (Pikovsky et al., 2003).
Background
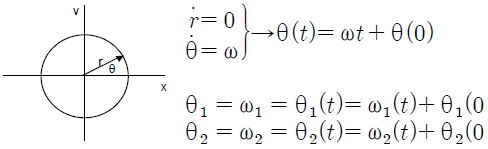
Mutuality between the relative oscillators arises from the insight of perception-action coupling perspective with work on the coordination problem (Bernstein, 1967), and has become a major tenet in the physical sciences (Kugler et al., 1980; Shaw & Turvey, 1981). Evidently, when adopting this view, phase synchrony is a traditional paradigm in behavioral dynamics (Warren, 2006). In particular, a bi-manual 1:1 frequency locking in-phase and anti-phase pendulum can represent a wide range of control theories (Turvey, 1990; Fultot, 2020).
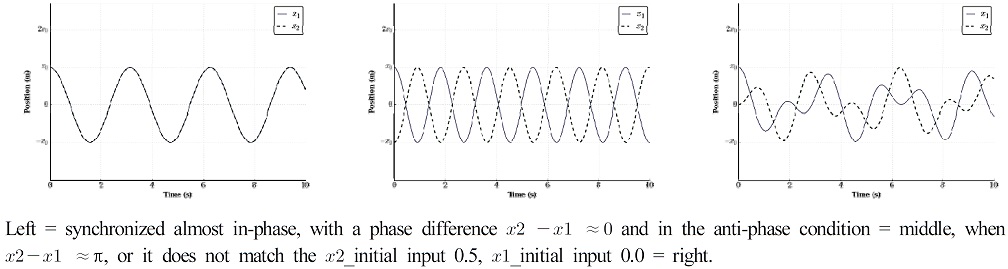
In this equation, the phase difference, θ2-θ1 ≈ 0, denotes a condition of nearly synchronized in-phase and θ2-θ1 ≈ π indicates this in an anti-phase. The observed relative phase or phase relation (ϕ) between two oscillators at ϕ ≈ 0 deg (in-phase) and ϕ ≈ 180 deg (anti-phase) have been modeled as point attractors in our limb system, as they are purely stable patterns (Pikovsky et al., 2003).
Several studies on the 1:1 frequency locking of the left-and-right-hand phase, defined as ϕ = (θL-θR): the difference between the left (L) and right (R) phase angles (ϕ), have led to the identification of important invariant human system features (Kelso, 1984).
In this equation, ϕ is the phase angle of the individual oscillator. In addition, α and b are coefficients that denote the strength of the coupling between the two oscillators. A relative 1:1 frequency-locked coordination phase [V(ϕ)] is determined by the differences between the two component oscillators’ continuous phase angle [-α cos(ϕ)- b cos(2ϕ)]; the stability of the point attractor can be varied by varying the pendulum’s dimensions (Kugler & Turvey, 1988). This function indicates that the minima of the potential are located at ϕ = 0, and ϕ=±π (Haken et al., 1985).
Synchronous diagrams of the possible point attractors
Gap statement
Motivation for the research question was derived from the above assumptions and various work given the following model: function can be estimated in how the potential will change in shape as the other measurements. Although the magnitude (or stability) of synchrony can differ across different conditions (Schaffert et al., 2019), the most used quantifications are the spatiotemporal and neuronal performance that occurs between the movements of the limbs (Mechsner et al., 2001). Indeed, there is a lack of verified quantification of the magnitude and stability of systems that can occur between different categories (Purpura et al., 2017), even though such assumptions play an important functional role in the assembly of different oscillations (Kelso et al., 1991). Cluster methods and the fixed-point shift process can be integrated with methodological techniques that allow for modeling of data (Chen & Huang, 2017), providing the ability to look at the exact level of patterns as well as different constraints (Soechting & Lacquaniti, 1981). Particularly, a homogeneous characteristic (or data) can be detected from heterogeneous observations by clustering data that is unlabelled and without a defined variable pool (Frank & Richardson, 2010; Lin et al., 2019). Further, a locally stable or ultimate compact state (attractor) can be defined by the fixed point shift process (Ren et al., 2013; Park, 2019). These applications with constraints may be imposed on the redundant degrees of freedom problem (Bernstein, 1967) embracing purely stable patterns.
Purpose
In this study, therefore, we address these questions by adapting and testing cluster and fixed-point shift techniques (Frank & Richardson, 2010). We propose that the nature of this method is called radial calculation (Richardson et al., 2012), primarily suggesting which phase is more stable as a particularly well-suited physical model. In addition, we further expand such a functional linkage into a topological constraint that can be used to examine any other phase of synchronization of different bodies of topological systems (Shih et al., 2019).
Theoretical Value
The above work designed on a systemic investigation may elicit degree of freedom issues to deal with task-specific characteristics (Park, 2020). This will allow us to estimate a useful reference for system stability coordination tasks in which this functional pattern can be applied to all human movements, muscles, and even neural networks.
Methods
Participants
For this study, bimanual coordination embedding synchrony context data were collected from students (n = 24) at the University of Connecticut (n = 16) and Seoul National University (n = 8). They participated in this study to fulfill their course requirements. None of the participants were compensated for volunteering. All participants were not aware of the study’s purpose and had not previously participated in an experiment on rhythmic or synchrony movement coordination. They participated in different experiments in the three groups and were confirmed to have no physical or psychological problems. All of them provided written informed consent for the study, approved by the local ethics committee (SNUIRB No.1509/002-002). The study conformed to the ethical standards of the 1964 Declaration of Helsinki.
Experimental design
The present experiment was designed to verify whether a more stable bimanual synchrony variable exists between phases and anatomies. Although the in-phase on the wrist joint is properly used compared to other possible bimanual pendulums (Kelso, 1984; Turvey, 1990), whether this value is representative of the overall characteristics of a system must be assessed. Moreover, repeating the assessment for only one position under several different conditions with many trials is likely to be associated with learning (or fatigue) effects. The collected data were analyzed to compare different characteristics between phases (experiment 1: in-phase and anti-phase) as well as different limb joint performances (experiment 2: wrist, elbow, and shoulder).
Apparatus and procedure
Bimanual coordination without detuning was performed while each subject was seated in a chair holding a pendulum vertically without occluding their vision. The pendulums used here were two standard wooden rods (85 g, 1 m in length, 1.2 cm in diameter) with DC potentiometers attached. A 200 g weight was positioned 30 cm from the bottom of the rods. Each participant was asked to grasp the pendulum firmly 60 cm from the bottom so that the pendulum would not slip out of their hands; they were also asked not to rotate their finger joints. Their forearms were fixed voluntarily so that the pendulum motion was restricted to the sagittal parallel plane and the joint vertical axes (i.e., each oscillation pertained to only one joint, with the other joints being held immobile) (see Appendix 1). The appenidx (1) shows experimental sessions that were tapped into the ongoing bimanual coordination, focusing on its design structure (each experiment section includes more detail about the apparatus and procedures).

Data collection for experiment 1: two conditions, eight participants, six trials at each point
Experiment 1
As shown in the Introduction, because many ambiguities still exist between the purely stable phases [ϕ ≈ 0 deg (in-phase), or ϕ ≈ 180 deg (anti-phase)], we observed the elementary coordination composed of different measurements as well as stability, which may differ between the variables (Soechting et al., 1986). Thus, for the experiment, the sessions were divided into two conditions (in-phase and anti-phase). Each trial block lasted for 1 min, with a rest of 5 min. During the first session, participants received instructions about the preferred pendulum movements to establish in the in-phase and anti-phase 1:1 frequency locking at a 1.21 s metronome beat (this period was chosen because it corresponded to the natural period of the pendulum system without concern over amplitude or frequency; Amazeen et al., 1997).
In the different phase sessions (two levels), the participants received instructions about the preferred pendulum, but with the additional instruction of keeping different joints (elbow and shoulder) voluntarily fixed. Some experience was provided to help avoid difficulty in complying with the session requirements by giving instruction beforehand. During the actual trial, no feedback was given, and the participants were not to report, except when a problem arose (the data from that problem trial were not analyzed, and the trial was later repeated). Two different oscillation phases were used in a random order.
Analysis
Expectation values
These are (real) numbers that are computed from a continuous mathematical model. It can be an infinitely large dataset (i.e., pendulum = x), probability distribution or probability density describing certain aspects of a distribution. For example, Mean is the center of a distribution of values:
and Variance is the variability in the values of the distribution:

A normal distribution. The parameters are µ = mean and σ2 = variance (width given by σ). Prob. = probability, a.u. = arbitrary unit
This is intuitive if we think about our empirical variable. We assume, here, that the variable we are interested in is X. The moments can then be the expected values of X: E(X), E(X2), E(X3), and so on.
Mean of the first moment:
and that of the nth moment:
For example, when we practice with moment values, the first moment of the mean is defined as
where X(k) are the realizations (i.e., statistically independent scores) from a statistical ensemble. The average value can be interpreted as the sample (i.e., relative phase) average. Figure 3 below illustrates the limiting process. It shows that sample means me taken from a normal distribution with parameter μ = 7 and σ = 1 for samples of increasing size. The sample sizes used in the figure are shown in below.
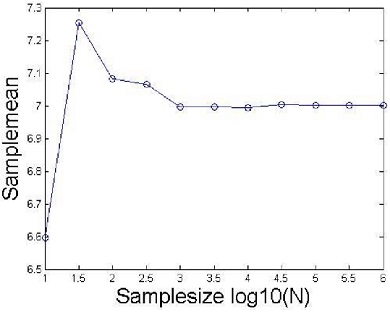
Statistical representation of the expectation function. The figure suggests that in the limiting case when N goes to infinity, the sample mean converges to the value 7 (i.e., we have m = μ = 7).
Given the function of the variables X: ɡ(X), we can assume which function value we would expect to observe on average (expectation value) with a notation E[ɡ(X)]. For example, first moment (mean value): ɡ(X) = X → m=E[X]=<X>, given a function ɡ of the process X: ɡ(X), we calculate E[ɡ(X)] as follows:
Thus, the notation of the expectation value of function ɡ;
where the equations E[g(X)] represent measures of central tendency and variability for continuous variables defined on a real line pendulum movement dynamics.
Cluster Methods
Now, let us take the expectation values for the cluster phase (θ) and cluster amplitude (r) of circular statistics (Vancleef et al., 2016) because they can also be applied under certain circumstances to periodic variables (this technique is to create homogeneous groups (or data) out of heterogeneous observations where data is unlabelled and without a defined variable pool; Lin et al., 2019; Richardson et al., 2012). The cluster phase describes the center of the angle distribution. For instance, if the mean relative phase between two limbs is zero, they are perfectly in-phase with one another. The cluster amplitude can assume values between 0 and 1. Specifically, low values indicate high variability, whereas high values indicate low variability. For r = 1, all the angles have the same value. The cluster amplitude and cluster phase are defined by the expectation value of a complex function (Richardson et al., 2012).
The complex function is the exponential function of iX, where i is the imaginary unit [i.e., the square root of –1 (
The last relation must be inverted using the arctan function to obtain the cluster phase. To obtain the cluster phase and amplitude from the data, we replaced the two expectation values (a, b) with the respective averages.
Results
We determined the cluster amplitudes r and phases θ for the data sets G1, phase data A and G1 phase data B. For each data set, we computed the amplitude and cluster phase and compared the results obtained in Table 2.

Averaged production from the values of the cluster methods
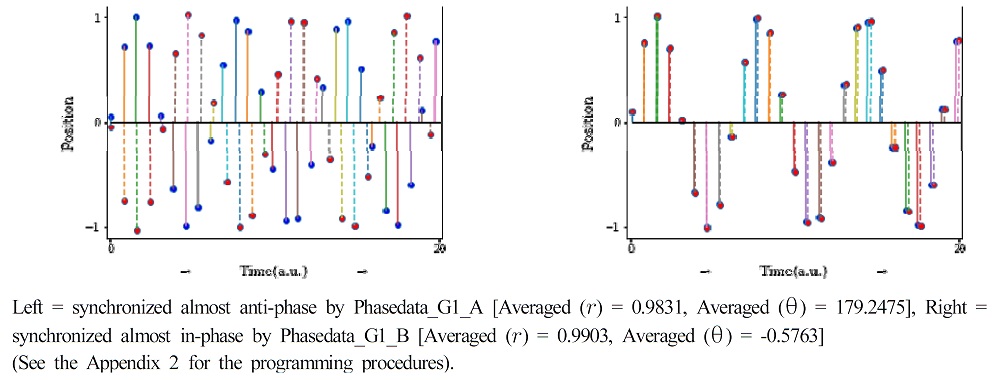
The cluster amplitude of the datasets seems to be variable, and the cluster phase appears to be anti and in-phase. Regarding the data, the G1_A data looked anti-phase as theta was 179 (left side of Figure 4), whereas the G1_B data had a theta of –.57 (in-phase; right side of Figure 4). The results showed that motor performance varied given the shift in and the of these behavioral variables. The main observation was that the in-phase was significantly associated with stability, while the other condition (anti-phase) was lower. Moreover, there was a significance, as the cluster amplitude from an anti-phase was significantly wider: F(2, 47) = 4656.999, (p < 0.001).
Synchronous diagrams of the cluster methods
Discussion
Formation and retention refer to propriospecific information about the states of the muscular-articular links, and these patterns are constrained by the dynamic criteria of stability patterns (Kelso, 1997; Park et al., 2015). Specifically, let us consider a qualitative physical system such as stiffness, damping, and position over time in a dynamic mass spring system, as given.
Here, m is the mass, b is the friction, and k denotes the stiffness. The variable t is time, χ denotes the position,
Such systems possess a static equilibrium point, which is called a point attractor (Kugler et al., 1980). The property of this dynamic has been applied not only to a physical system but also to descriptions of the human neuromuscular level (Kay et al., 1987). This function involves an investigation of the intact movement of a limb oscillator in terms of muscle–joint kinematic variations (kinematic position, velocity, and acceleration) over time (Park, 2018). As it is, when we are asked to swing two limbs comfortably, it can be characterized by the pendulum’s dimension (Kugler & Turvey, 1988; Turvey, 1990), simplifying the point attractor while restricting it to certain domains of phase space.
In the observed relative rhythmic segment patterns, some studies have reported that the in-phase ϕ = 0 condition is more stable than the anti-phase ϕ = π condition (Schmidt et al., 1998; Li et al., 2019), and other studies have highlighted that this is not always the case in certain conditions and analyses (Shih et al., 2019). In particular, the stability of coordination has been leaning toward in-phase movements (Carson & Kelso, 2004), although such coordination is influenced by a constraint. This investigation specifically considers these perspectives to determine a more reliable characteristic of different phases, based on which one would be better as the experimental dependent variable, to illustrate the different phase effects between the two conditions. We confirmed that while the anti-phase pattern entailed larger instability with the cluster methods and structure (Cattaert et al., 1999), in-phase was more associated with a preference for homologous activations.
Experiment 2
From the previous investigation, it is clear that the in-phase is more stable than the anti-phase leading to the identification of important invariant system features (Haken et al., 1985). With respect to the reconfirmation based on cluster methods, the present experiment was designed to find a relevant in-phase bimanual synchrony variable by using another fundamental technique (intensively defined as a prototype modeling for contexttual constraints invetigation (i.e., symmetry, handedness, and topological attractor; Pikovsky et al., 2003; Shea et al., 2016; Treffner & Turvey, 1996;)), and the collected data were calculated to compare different characteristics between one joint performance and several different joint performances (Bashkirtseva et al., 2021). In particular, although the wrist point is properly used compared to other possible bimanual pendulum areas, such as the elbow or shoulder, whether this value was representative of the overall characteristics of a system had to be assessed (Bossel, 2002). Moreover, repeated assessments for only one position under several different conditions and several trials is likely to be associated with learning (or fatigue) effects (Gonzalez et al., 2011). To observe this, data were collected from 16 participants (at the University of Connecticut) (M=10, F=6, age 22 ± 3) to compare one typical anatomical position (wrist: M=5, F=3) and several different joint positions (wrist, elbow, and shoulder: M=5, F=3).
The sessions were divided into two conditions (one joint = Group 2, and different joint = Group 3). Each trial block lasted for 1 min with a rest for 5 min. During the one-joint session (wrist), participants received instructions about the preferred pendulum movements to establish in-phase 1:1 frequency locking at a 1.21 s metronome beat (this period was chosen because it corresponded to the natural period of the pendulum system: Amazeen et al., 1997) without concern over amplitude or frequency. In the different joint sessions (wrist, elbow, and shoulder), the participants received instructions about the preferred pendulum, as in the single-joint session, but with the additional instruction of keeping different joints voluntarily fixed. Some experience was provided to help avoid difficulty in complying with the session requirements by giving instruction beforehand. During the actual trial, no feedback was given, and the participants were not to report, except when a problem arose. If the participants accidentally moved a joint that was supposed to be fixed voluntarily, the data from that trial were not analyzed, and the trial was later repeated. Three different oscillation joints were used in a random order.

Data collection for experiment 2: two conditions, 16 participants, six (two) trials at each point
Analysis
Calculating Relative Phase Coordination
Corresponding to the previously introduced model (see Background), the mechanism of oscillation on two different (left pendulum and right pendulum), but nearly identical, process phases was defined by the following dynamic:
Here, ϕ is the phase of the strength between the left (θL) and right hand (θR). The degree of relative phases (0° ~ 180°) depends on the difference between the two oscillators. If each θ is defined as a sine function as follows:
the logic can simply be rewritten to ϕ as the same dynamic function.
Then, each θ can be specified as the following equation:
Calculating fixed-point shift Dynamics
To realize the relative phase-time series of both hands as calculated with the above logic, first, data from both hands were divided into left and right components. Next, the separated data were collapsed as each peak point (left_peaks and right_peaks) in terms of a one-dimensional dataset, and these peak points were defined with each vector value to link each peak point according to the time series. Finally, these sets were analysed using a discrete relative phase formula, as follows:
In this equation, tmaxLi is the time of the ‘i’th maximum extension of limb L, and ϕi is the relative phase for cycle i. The phase of relativity time series for both oscillators was established using a direct function of the data analysis program. Based on these procedures, the standard location and relative stability of the stable phase relationships or fixed points were measured (the fixed point of a system is an attractor whether it is a locally compact space or an ultimate compact space; Ren et al., 2013; Park, 2019). In these calculations, the locations of the fixed points were indexed as the shift of the mean relative phase from an intended phase.
Here, ϕ0 is the intended phase of the point shift as a function of the degree of frequency competition (Δω = 0). Although the experimental setting was designed with a 1:1 frequency and phase locking with a metronome beat, the mean degree (ϕave-ϕ0) was considered in which the importance of the degree of closeness between the in-phase (0, 360 degree) or anti-phase (± 180 degree) condition with regard to detecting the different conditional phase relationships was represented. For the deviation value, it was necessary to check the datasets for the degree (converted from radian values) of phase variability with the following equation:
The locations of the fixed points are indexed as the deviation or shift of the mean relative phase ϕave from the intended phase ϕ of 0. The stability here is inversely related to the variability with which ϕave is produced, as indexed by the standard deviation of relative phase SDϕ. These simulations with the observations reflect that the fixed-point shift can be calculated using the deviation of the average relative phase from the intended phase (ϕave - ϕ0), and the variability can be calculated as the standard deviation of the relative phase (SDϕ). This provides us with a basic tool for measuring the system’s ability to remain stable in some circumstances (Amazeen, et al., 1997; Amazeen, et al., 1998; Treffner & Turvey, 1996).
Results
Participants were divided into different experimental groups for the following two reasons: (a) although the wrist point is commonly considered compared to other possible bimanual pendulum areas, such as the elbow and the shoulder, representing this value as the overall characteristic of the system had to be confirmed. Moreover, (b) there was uncertainty that repeating only one position under several different conditions through a number of trials can be associated with learning (or fatigue) effects. This investigation specifically considered these differences to determine the fundamental characteristics of different anatomical joints.
Figure 5 illustrates the average stability of each joint for the wrist, elbow, and shoulder. Topological asymmetry, couplings, and statistics are reflected, showing that they are significantly wider for the distal (wrist) than the proximal (shoulder) with different joint parameters (Figure 6). Specifically, the results showed that coordination performance varied with different anatomical parts given the fixed-point shift [ϕave - ϕ0] and the standard deviation of the relative phase [SDϕ] of the three behavioral variables. This indicates that the topology Pearson correlation R = .5 (p = 0.00041)]. There was hierarchical significance, as the [ϕave - ϕ0] and the [SDϕ] were significantly wider for distal anatomy: F (2, 47) = 4656.999, (p < 0.001).
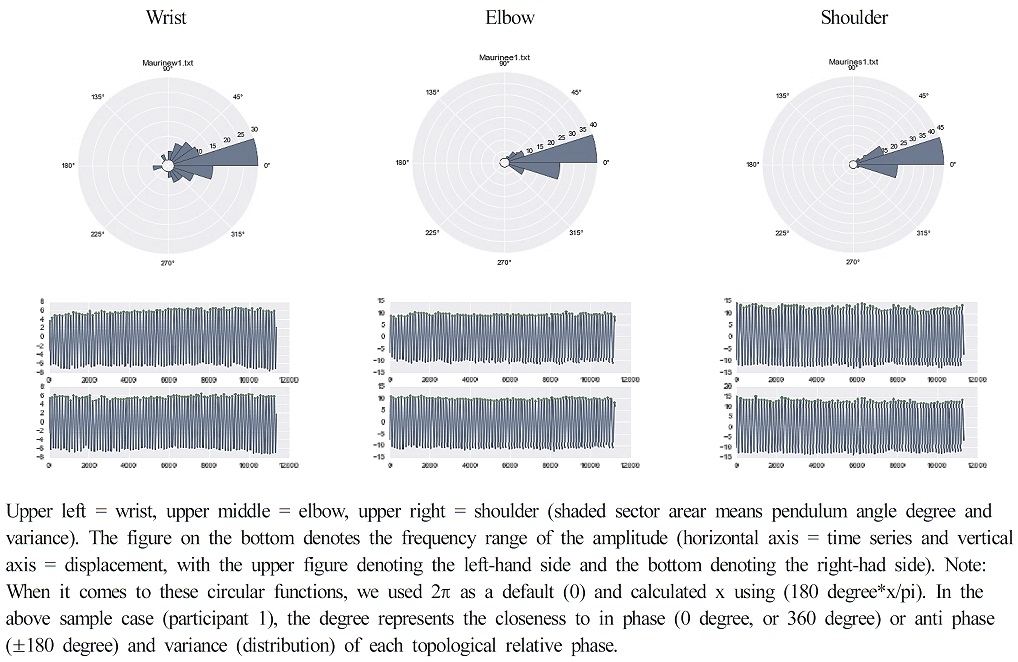
Circular representation of the different joint coupled oscillations

Coupling strength of the different joint coupled oscillations
Next, the data were separated into phases for different conditions according to the trial. The data were then analyzed using two values regarding which one would be better as the experimental dependent variable to illustrate the different trial effects between the two conditions of the one joint (wrist) or the position of different joints (wrist, elbow, and shoulder).
The results showed that motor performance varied with different anatomical parts given the fixed-point shift [ϕave - ϕ0] and the standard deviation of the relative phase [SDϕ(rad)] of these three behavioral variables. The important fact from these observations is that repetition with one joint may be significantly associated with increased stability, akin to trial effects (see the left plot of Figure 7) [Pearson Correlation R = .284 (p < 0.025)], while the other condition (different topology) did not have a significant effect according to the trial (see the middle plot of Figure 7) [Pearson Correlation R = .110 (p < 0.236)]. However, there was hierarchical significance, as the mean relative phase from the [ϕave - ϕ0] and the [SDϕ(rad)] was significantly wider for distal anatomy (see the right plot of Figure 7): F (2, 47) = 4656.999, η2 = 8.077 (p < 0.001).

In-phases for the different conditions according to the trial
Discussion
Inquiry into the possibility of relating perception-action to dynamics began in the 1970s with the problem of coordination: could a principled dynamical account of fundamental rhythmic capabilities be given involving multiple joints, scores of muscles, and millions of cells? Efforts to address this question invoked the concepts and tools of nonlinear dynamics (Kugler & Turvey, 1987). We suggested a method of data collection (including trial effects; recommended to create as a relevant dependent variable) that can be used to measure the internal source of stability (Frank & Richardson, 2010; Shih et al., 2019; Gruevski et al., 2017). In particular, collecting different values for three joints but using only wrist data for biological characterization was determined for the following reasons: (a) although there was a significant learning effect when the participants undertook a task repeatedly with only the wrist point, it led to significant typicality compared to the other two (elbow and shoulder) data sets. As it is, to overcome the learning (or fatigue) effects, data were collected for three joints randomly but used only the wrist data. (b) Even though investigations could use combined data that included all three different motor positions, representing the combined data as the characteristic of a biological system appears to remove the important value of representativeness, as this combination likely has too many variables to manage. Moreover, (c) there was an expectation that collecting different motor scales but using concretely represented data (i.e., wrist position) may meet both requirements of typicality as a well-defined system characteristic eliminating the learning effect stemming from numerous trials. This implies a demonstration of the question of whether data from only one condition in many trials can be represented as a well-defined characteristic of the internal source of a system (Thomaz et al., 2017).
Conclusions and Practical Applications
The principal features of self-organizing are multi-stable, depending on system dynamics, and such characteristics have been reported in many coordinative structures (Kelso, 1997). Here, the observed features can be modeled as attractors of the order parameter (Schoner et al., 1986) identified as the most reliable recruitment of the dependent variable. In particular, we presented and tested a method proposed by a cluster and fixed-point shift to measure the magnitude and patterning of the coordination that occurred between the limbs interested in two major points. First, we determined (i) whether the cluster phase method could effectively measure elementary synchrony and identify important characteristics. Second, we concluded that (ii) the detection phase could effectively determine whether the different anatomical synchronized movements would be the best for the internal source (elementary biological characteristic) by the fixed-point shift process.
To achieve this, each participant was seated with their arms on armrests and with a pendulum in each hand, held firmly to prohibit within-grasp motions. The gaze was elevated to prevent viewing of the pendulum oscillations that arose from the motions. After determining a more stable internal source (Experiment 1; homogeneous characteristic from heterogeneous pool) applied to the cluster phase methods, we determined which can be the most prototypical dependent variable (Experiment 2; prototype modeling for the contexttual constraints invetigation). Then, we focused on the detected in-phase bimanual coordination that may need to be analyzed in different joint conditions (Koeneke et al., 2004; Wolf et al., 2020) investigating the synchronization that can occur between topologies in the limbs. Although there are important theoretical reasons why measuring synchrony at a different topological level may be essential (topological level of synchrony may be an important behavioral indicator for existence as an entity; Campbell, 1958), most of the observations have been made with neuromuscular constraints (Fink et al., 2000) and cognitive influence (i.e., visual and auditory event; Spencer & Ivry, 2007).
The analysis of experiment 1 revealed that in-phase coordination was more stable because it was relatively more associated with a preference for homologous activations underlying the cluster phase and amplitude calculation. The analysis of experiment 2 demonstrated that data from only one joint in many trials cannot be represented as the well-defined characteristic of a system. Instead, collecting different values for various joints but using only one (i.e., wrist) for a biological characterization appears more reliable as a typical dependent variable, including the trial effect. Observation derived from the analysis of both profiles might reveal the applicability of measuring the type of phase and topology stability, fulfilling the requirements of a typically well-defined system characteristic as well as eliminating the learning effect stemming from numerous trials.
Practical Implications
The results revealed that the cluster phase and amplitude measures of the relative phases can be used to identify synchrony patterning. The methods applied in the experiments demonstrated that wrist in-phase motion was suggested as a reliable order parameter with a value of amplitude and the trail effect compared with other stable relative-phase patterns (three joints). At present, the observation across constraints is diverse, but consistencies occur in the suppression of the wrist joint and the attraction to stable phasing patterns (Stergiou, 2020). The dynamics of the performance are reasonable, even though conditional differences can be presented. Many reasons may evolve for such a condition namely, constraint, level, ability, and experience in specific tasks (Kelso et al., 2018). This study, at least, was designed to address such details, mainly for investigating the reliability in the order coordination parameter dynamics (Warren & Whang, 1987). In addition, although the cluster and fixed-point shift method presented here cannot account for coupling delays or leading/following/detuning, it is plausible to assume that the method can be generalized to take such effects into account.
Regarding the practical implications, the present study has several insights that can be applied in future studies to strengthen the applicability of the present findings. First, the present study is based on data collected from a time dependent dynamic (expectation value based cluster statistics), which boosts the generalizability of the study findings to different synchrony (intra and interpersonal synchrony; Loras et al., 2019). For instance, the moderating effect of cluster amplitude may be more marked at transportation stochastic effects, where the impact of the time series on the performance relationship is much stronger for participants, as their functional flexibility is essential to maintain biological stability (Kaur et al., 2018). Thus, the findings of the present study can be replicated across different conditional effects to ensure their generalizability.
Further, instead of behavioral performance-based measurements from participants, objective outcome variables related to stability, such as neural/chemical functions and microstate severity, can be used as important variables in an examination of the variant and invariant effects (Klinshov et al., 2017). If similar findings are obtained with these objective neuro-chemical outcome variables, the practical importance of systematically managing biological adaptations can be further understood (Forestier & Nougier, 1998).
Finally, although the experimental group’s company was considered as an identical population with regard to studying at a university, other potential individual effects that were not seriously considered in this study may exist. The possibility must be left open that there may be important boundary conditions for the moderation of individual effects of biological stability on the relationships between external levels and internal behaviors (Vieluf et al., 2015). For instance, working hours and habit (i.e., how long participants worked and rested before participating in the experiment) could possibly interfere with biological performance by themselves or in conjunction with the experimental setting. The uniqueness of the moderating effect of individual tendency variability can be confirmed by examining the effects of potentially confounding variables.
Researchers may have some concerns regarding whether the tools are constrained to situations in which the points are measured during rocking. The analyses presented here all involve periodic coordination, and it is important to note that the techniques and results could be extended to situations where the movements involve natural coordination. The benefits of investigating these levels of synchrony, i.e., different anatomical position, are that they allow us to empirically test the extent with which the synchrony is a process that emerges because of relatively stable prototypes. Accordingly, this suggestion could be used in future research to determine whether and how the magnitude and stability of synchrony influences the coordination dynamics of movements (Richardson et al., 2010).
References
Amazeen, E. L., Amazeen, P. G., Treffner, P. J., & Turvey, M. T. (1997). Attention and handedness in bimanual coordination dynamics. Journal of Experimental Psychology: Human Perception and Performance, 23(5), 1552.
10.1037/0096-1523.23.5.1552.Amazeen, P. G., Amazeen, E. L., & Turvey, M. T. (1998). Dynamics of human intersegmental coordination: Theory and research. In D. A. Rosenbaum & Charles E. Collyer (Eds.), Timing of behavior: Neural, psychological, and computational perspectives (pp. 237-259).
Bashkirtseva, I., Ryashko, L., & Pisarchik, A. N. (2021). Stochastic transitions between in-phase and anti-phase synchronization in coupled map-based neural oscillators. Communications in Nonlinear Science and Numerical Simulation, 95, 105611.
10.1016/j.cnsns.2020.105611.Bernstein, N. A. (1967). The co-ordination and regulation of movements: Conclusions towards the Study of Motor Co-ordination. Biodynamics of Locomotion, 104-113.
Bossel, H. (2002). Assessing viability and sustainability: A systems-based approach for deriving comprehensive indicator sets. Conservation Ecology, 5(2).
10.5751/ES-00332-050212.Campbell, D. T. (1958). Common fate, similarity, and other indices of the status of aggregates of persons as social entities. Behavioral Science, 3(1), 14.
10.1002/bs.3830030103.Carson, R. G., & Kelso, J. S. (2004). Governing coordination: Behavioural principles and neural correlates. Experimental Brain Research, 154(3), 267-274.
10.1007/s00221-003-1726-8.Cattaert, D., Semjen, A., & Summers, J. J. (1999). Simulating a neural cross-talk model for between-hand interference during bimanual circle drawing. Biological Cybernetics, 81(4), 343-358.
10.1007/s004220050567.Chen, Y. A., & Huang, T. R. (2017). Multistability of the brain network for self-other processing. Scientific reports, 7(1), 1-13.
10.1038/srep43313.Fink, P. W., Kelso, J. A., Jirsa, V. K., & De Guzman, G. (2000). Recruitment of degrees of freedom stabilizes coordination. Journal of Experimental Psychology: Human Perception and Performance, 26(2), 671.
10.1037/0096-1523.26.2.671.Forestier, N., & Nougier, V. (1998). The effects of muscular fatigue on the coordination of a multijoint movement in human. Neuroscience Letters, 252(3), 187-190.
10.1016/S0304-3940(98)00584-9.Frank, T. D., & Richardson, M. J. (2010). On a test statistic for the Kuramoto order parameter of synchronization: An illustration for group synchronization during rocking chairs. Physica D: Nonlinear Phenomena, 239(23-24), 2084-2092.
10.1016/j.physd.2010.07.015.Fultot, M. (2020). Tensegrity and Recurrent Neural Networks: Towards an Ecological Model of Postural Coordination. (Publication No. 2616) [Doctoral dissertation]. OpenCommons@UConn.
Gonzalez, C., Best, B., Healy, A. F., Kole, J. A., & Bourne Jr, L. E. (2011). A cognitive modeling account of simultaneous learning and fatigue effects. Cognitive Systems Research, 12(1), 19-32.
10.1016/j.cogsys.2010.06.004.Gruevski, K. M., Hodder, J. N., & Keir, P. J. (2017). Upper extremity muscle activity during in-phase and anti-phase continuous pushing tasks. Human factors, 59(7), 1066-1077.
10.1177/0018720817714367.Haken, H., Kelso, J. S., & Bunz, H. (1985). A theoretical model of phase transitions in human hand movements. Biological Cybernetics, 51(5), 347-356.
10.1007/BF00336922.Kaur, M., Srinivasan, S. M., & Bhat, A. N. (2018). Comparing motor performance, praxis, coordination, and interpersonal synchrony between children with and without Autism Spectrum Disorder (ASD). Research in Developmental Disabilities, 72, 79-95.
10.1016/j.ridd.2017.10.025.Kay, B. A., Kelso, J. A., Saltzman, E. L., & Schöner, G. (1987). Space–time behavior of single and bimanual rhythmical movements: Data and limit cycle model. Journal of Experimental Psychology: Human Perception and Performance, 13(2), 178.
10.1037/0096-1523.13.2.178.Kelso, J. A. (1984). Phase transitions and critical behavior in human bimanual coordination. American Journal of Physiology-Regulatory, Integrative and Comparative Physiology, 246(6), R1000-R1004.
10.1152/ajpregu.1984.246.6.R1000.Kelso, J. S. (1997). Dynamic patterns: The self-organization of brain and behavior. MIT Press.
Kelso, J. A. S., Buchanan, J. J., & Wallace, S. A. (1991). Order parameters for the neural organization of single, multijoint limb movement patterns. Experimental Brain Research, 85(2), 432-444.
10.1007/BF00229420.Kelso, J. A. S., DelColle, J. D., & Schöner, G. (2018). Action-perception as a pattern formation process. In M. Jeannerod (Ed.), Attention and performance XIII (pp. 139-169). Psychology Press.
10.4324/9780203772010-5.Kenville, R., Maudrich, T., Vidaurre, C., Maudrich, D., Villringer, A., Nikulin, V. V., & Ragert, P. (2020). Corticomuscular interactions during different movement periods in a multi-joint compound movement. Scientific reports, 10(1), 1-13.
10.1038/s41598-020-61909-z.Klinshov, V., Yanchuk, S., Stephan, A., & Nekorkin, V. (2017). Phase response function for oscillators with strong forcing or coupling. EPL (Europhysics Letters), 118(5), 50006.
10.1209/0295-5075/118/50006.Koeneke, S., Lutz, K., Wüstenberg, T., & Jäncke, L. (2004). Bimanual versus unimanual coordination: What makes the difference? Neuroimage, 22(3), 1336-1350.
10.1016/j.neuroimage.2004.03.012.Kugler, P. N., Kelso, J. S., & Turvey, M. T. (1980). On the concept of coordinative structures as dissipative structures: I. Theoretical lines of convergence. In Advances in Psychology (Vol. 1, pp. 3-47). North-Holland.
10.1016/S0166-4115(08)61936-6.Kugler, P. N., & Turvey, M. T. (1988). Self-organization, flow fields, and information. Human Movement Science, 7(2-4), 97-129.
10.1016/0167-9457(88)90009-7.Li, L., Zhao, Z., & Gu, H. (2019). Bifurcations of time-delay-induced multiple transitions between in-phase and anti-phase synchronizations in neurons with excitatory or inhibitory synapses. International Journal of Bifurcation and Chaos, 29(11), 1950147.
10.1142/S0218127419501475.Lin, Y., Dong, X., Zheng, L., Yan, Y., & Yang, Y. (2019). A bottom-up clustering approach to unsupervised person re-identification. In Proceedings of the AAAI Conference on Artificial Intelligence, 33(1), 8738-8745.
10.1609/aaai.v33i01.33018738.Lorås, H., Aune, T. K., Ingvaldsen, R., & Pedersen, A. V. (2019). Interpersonal and intrapersonal entrainment of self-paced tapping rate. PLOS ONE, 14(7), e0220505.
10.1371/journal.pone.0220505.Mechsner, F., Kerzel, D., Knoblich, G., & Prinz, W. (2001). Perceptual basis of bimanual coordination. Nature, 414(6859), 69-73.
10.1038/35102060.Mo, S., Lau, F. O., Lok, A. K., Chan, Z. Y., Zhang, J. H., Shum, G., & Cheung, R. T. (2020). Bilateral asymmetry of running gait in competitive, recreational and novice runners at different speeds. Human movement science, 71, 102600.
10.1016/j.humov.2020.102600.Paladino, M. P., Mazzurega, M., Pavani, F., & Schubert, T. W. (2010). Synchronous multisensory stimulation blurs self-other boundaries. Psychological Science, 21(9), 1202-1207.
10.1177/0956797610379234.Park, C., Profeta, V. L., Davis, T., & Carello, C. (2015). Circadian influences on bimanual coordination. Studies in Perception and Action XIII, 31.
Park, C. W. (2018). Biological autonomy and control of function in circadian cycle. Korean Journal of Sport Science, 29(3), 443-455.
10.24985/kjss.2018.29.3.443.Park, C. (2019). Systemic Commitments of the Context-Dependency; Basics of Elementary Coordination in Circadian Cycles. bioRxiv.
10.1101/738872.Park, C. (2020). Evolutionary understanding of the conditions leading to estimation of behavioral properties through system dynamics. Complex Adaptive Systems Modeling, 8(1), 2.
10.1186/s40294-019-0066-x.Pikovsky, A., Kurths, J., Rosenblum, M., & Kurths, J. (2003). Synchronization: A Universal Concept in Nonlinear Sciences (Vol. 12). Cambridge University Press.
Purpura, G., Costanzo, V., Chericoni, N., Puopolo, M., Scattoni, M. L., Muratori, F., & Apicella, F. (2017). Bilateral patterns of repetitive movements in 6-to 12-month-old infants with autism spectrum disorders. Frontiers in Psychology, 8, 1168.
10.3389/fpsyg.2017.01168.Ren, Y., Lu, Y., Lv, J., & Chen, Z. (2013). Fixed point attractors of dynamical systems. Proceedings of the 32nd Chinese Control Conference (pp. 1220-1223).
Richardson, M., Garcia, R. L., Frank, T. D., Gregor, M., & Marsh, K. L. (2012). Measuring group synchrony: A cluster-phase method for analyzing multivariate movement time-series. Frontiers in Physiology, 3, 405.
10.3389/fphys.2012.00405.Schaffert, N., Janzen, T. B., Mattes, K., & Thaut, M. H. (2019). A review on the relationship between sound and movement in sports and rehabilitation. Frontiers in Psychology, 10, 244.
10.3389/fpsyg.2019.00244.Schmidt, R. C., Bienvenu, M., Fitzpatrick, P. A., & Amazeen, P. G. (1998). A comparison of intra-and interpersonal interlimb coordination: Coordination breakdowns and coupling strength. Journal of Experimental Psychology: Human Perception and Performance, 24(3), 884.
10.1037/0096-1523.24.3.884.Schöner, G., Haken, H., & Kelso, J. A. S. (1986). A stochastic theory of phase transitions in human hand movement. Biological Cybernetics, 53(4), 247-257.
10.1007/BF00336995.Shaw, R. E. & Turvey, M. T. (1981). Coalitions as models for ecosystems: A realist perspective on perceptual organization. In M. Kubovy and J. Pomerantz (Eds.), Perceptual organization (pp. 343-416). Hillsdale, NJ: Lawrence Erlbaum and Associates.
10.4324/9781315512372-11.Shea. C. H., Buchanan, J. J., & Kennedy, D. M. (2016). Perception and action influences on discrete and reciprocal bimanual coordination. Psychonomic bulletin & review, 23(2), 361-386.
10.3758/s13423-015-0915-3.Shih, P. C., Steele, C. J., Nikulin, V., Villringer, A., & Sehm, B. (2019). Kinematic profiles suggest differential control processes involved in bilateral in-phase and anti-phase movements. Scientific Reports, 9(1), 1-12.
10.1038/s41598-019-40295-1.Soechting, J. F., & Lacquaniti, F. (1981). Invariant characteristics of a pointing movement in man. Journal of Neuroscience, 1(7), 710-720.
10.1523/JNEUROSCI.01-07-00710.1981.Soechting, J. F., Lacquaniti, F., & Terzuolo, C. A. (1986). Coordination of arm movements in three-dimensional space: Sensorimotor mapping during drawing movement. Neuroscience, 17(2), 295-311.
10.1016/0306-4522(86)90248-4.Spencer, R. M., & Ivry, R. B. (2007). The temporal representation of in-phase and anti-phase movements. Human Movement Science, 26(2), 226-234.
10.1016/j.humov.2007.01.002.Stergiou, N. (2020). Biomechanics and Gait Analysis. Academic Press.
Thomaz, E., Bedri, A., Prioleau, T., Essa, I., & Abowd, G. D. (2017). Exploring symmetric and asymmetric bimanual eating detection with inertial sensors on the wrist. In Proceedings of the 1st Workshop on Digital Biomarkers (pp. 21-26).
10.1145/3089341.3089345.Treffner, P. J., & Turvey, M. T. (1996). Symmetry, broken symmetry, and handedness in bimanual coordination dynamics. Experimental Brain Research, 107(3), 463-478.
10.1007/BF00230426.Turvey, M. T. (1990). Coordination. American Psychologist, 45(8), 938.
10.1037/0003-066X.45.8.938.Vancleef, K., Meesen, R., Swinnen, S. P., & Fujiyama, H. (2016). tDCS over left M1 or DLPFC does not improve learning of a bimanual coordination task. Scientific Reports, 6, 35739.
10.1038/srep35739.Vieluf, S., Godde, B., Reuter, E. M., Temprado, J. J., & Voelcker-Rehage, C. (2015). Practice effects in bimanual force control: Does age matter?. Journal of Motor Behavior, 47(1), 57-72.
10.1080/00222895.2014.981499.Walter, C. B., & Swinnen, S. P. (1992). Adaptive tuning of interlimb attraction to facilitate bimanual decoupling. Journal of Motor Behavior, 24(1), 95-104.
10.1080/00222895.1992.9941605.Warren, W. H. (2006). The dynamics of perception and action. Psychological review, 113(2), 358.
10.1037/0033-295X.113.2.358.Warren Jr, W. H., & Whang, S. (1987). Visual guidance of walking through apertures: Body-scaled information for affordances. Journal of Experimental Psychology: Human Perception and Performance, 13(3), 371.
10.1037/0096-1523.13.3.371.Wolf, T., Sebanz, N., & Knoblich, G. (2020). Adaptation to unstable coordination patterns in individual and joint actions. PloS one, 15(5), e0232667.
10.1371/journal.pone.0232667.Appendices


Programming Procedures (Experiment 1)
