Foot arch height affects the effect of BMI on gait and lower-limb joint kinematics
Article information
Abstract
Foot arch structure contributes to walking in adults with obesity. However, little is known about the relationship between arch height and walking in these populations. The purpose of this study was to investigate if arch height affects gait characteristics among adults classified into three groups by body mass index (BMI). In this study, dynamic plantar pressure, spatiotemporal gait parameters, and lower-limb joint kinematics were collected from adults with normal weight (n=21), moderate obesity (n=18), and severe obesity (n=8) during walking at their preferred speed. Digital foot pressure data were used to compute a measure of arch height, the Chippaux-Smirak Index (CSI). Our results revealed that adults with higher BMI scores had lower arches than adults with lower BMI scores (p<0.01). Arch height was related to step width, double-limb support time, knee joint extension angle, and knee joint abduction angle (ps<0.01). Our results have implications for improving gait stability and increasing physical activity for obese populations via intervening in arch height.
Introduction
Obesity is a major public health concern worldwide and a complex disease involving excessive amounts of body fat. Obesity is a medical problem that increases the risk of other health problems such as heart disease, stroke, type-2 diabetes, osteoarthritis, and certain cancers that may cause premature death (Jensen et al., 2014). The prevalence of obesity in the United States is 42.4% in 2017-2018 among adults aged over 20 years old and has increased 12% over the past 20 years (Hales et al., 2020). To combat obesity, increasing energy expenditure via increasing physical activity level has been strongly recommended; physical activity promotes weight loss, prevents weight gain and regain, and can help maintain cardiovascular and metabolic health (Jensen et al., 2014). Walking is a common and cost-effective intervention used to increase overall physical activity and to meet the recommended 150 minutes of weekly moderate-to-vigorous physical activity (WHO, 2010). However, most obese adults fall short of these recommendations (Blanchard et al., 2005).
One major contributor to decreased physical activity in individuals with obesity includes impaired gait stability due to the excessive body weight with the greater girth of the thigh and trunk (Alonso et al., 2012). Walking requires coordinating motor actions specific to constraints such as body weight (Hung et al., 2013). Compared to adults with normal weight, adults who are classified as obese show differences in spatiotemporal gait parameters. They take shorter but wider steps by decreasing step length and increasing step width, walk more slowly by reducing velocity, and spend more time with their feet on the ground by reducing swing time as well as increasing double-limb support time (Forhan & Gill, 2013; Lai et al., 2008). Moreover, obesity affects gait kinematics and kinetics in adults. Obese adults, who have slower gait velocity than normal-weight adults, have greater knee abduction (McMillan et al., 2010; Peyrot, 2012) and greater absolute ground reaction forces (Browning & Kram, 2007) compared to normal-weight adults. These differences in walking, especially slower gait velocity, are attributed to obese adults’ attempt to increase stability because of impaired balance (Singh et al., 2009), to minimize mechanical external work (Malatesta et al., 2009), to decrease load at the knee (Browning & Kram, 2007), and to curb energy cost and relative effort (Peyrot et al., 2010). However, the differences in walking are actually associated with increased safety risks such as tripping (Gill & Narain, 2012).
Obese adults also tend to have lower arches or “flat feet” based on footprint and plantar pressure measures (Azarfam et al., 2014; Gravante et al., 2003; Wearing et al., 2006). Their feet tend to be less flexible during the propulsive phase of walking due to fallen arches (DeSilva & Gill, 2013; Walters & Mendicino, 2014). Individuals with lower arches based on weight-bearing static measurements are sometimes characterized as exhibiting a phenomenon known as excessive foot pronation during standing (Figure 1). Data on static weight-bearing foot position in obese adults suggests that those with overpronated feet in standing are more likely to develop foot pain (Butterworth et al., 2012) such as chronic plantar heel pain (Dicharry et al., 2009). The combination of differences in walking and arch height in obese adults is thought to contribute to musculoskeletal injuries due to soft tissue damage (Churchill & Sferra, 1998) such as posterior tibial tendon dysfunction (Timm et al., 2005), ankle sprains (Lai et al., 2008), and plantar fasciitis (Frey & Zamora, 2007). Obese adults also showed greater toe-out angle during walking than normal-weight adults (Lai et al., 2008; Messier et al., 1994).

Representative excessive foot pronation during standing.
Although spatiotemporal gait parameters, lower-limb joint kinematics, and arch height have been shown to differ in obese adults and to contribute to their increased injury risks, to our knowledge, no studies have examined the relationship between walking and arch height in these populations. That is, we have no knowledge to confirm whether both excessive weight and low arches together result in altered gait compared to the effects of either excessive weight or low arch height alone. Anthropometrics contribute to obesity-related gait characteristics (Lai et al., 2008), but only the effects of some weight-related anthropometrics have been examined. The purpose of the current study is to determine whether arch height affects obesity-related changes in gait using standard three-dimensional gait analysis. We hypothesized that foot arch height would affect gait characteristics in obese adults as measured by spatiotemporal gait parameters and lower-limb joint kinematics.
Methods
Participants
Forty-seven young adults (21 normal weight, 18 moderate obesity, and 8 severe obesity) participated in this study (Table 1). BMI group was subdivided into three categories: 1) Normal: BMI of 18.5-25; 2) Class 1 & 2: BMI of 30-40; and 3) Class 3: BMI of 40 or higher. Study eligibility included being between 18–35 years old, having no weight loss surgery, having no significant cardiovascular, vestibular, or other neurologic disorders, having no hip, knee, or foot pain on most days during the past 90 days, and having the ability to walk independently on a treadmill for over 40 minutes. All participants gave informed written consent before participating. Boston University Institutional Review Board (4922E) approved the protocols.

Demographics and anthropometric information. Means are listed with standard deviations in parentheses.
Arch Height Measures
We estimated participant’s arch height using two methods: digital footprints with a plantar pressure mat and navicular height measures. First, foot pressure was measured with a digital pressure mat (Tekscan Inc., South Boston, MA). The mat (488 mm × 447 mm) collected data vis 8,448 sensing elements at 185Hz. When participants stand barefoot on the right leg on the digital foot pressure mat, Tekscan software locates peak pressure distributions from each sensor to create a digital footprint (Figure 2). These digital footprints estimated arch height using the Chippaux-Smirak Index (CSI) (Fascione et al., 2012; Mathieson et al., 2004). The CSI is the ratio between the midfoot's smallest width and the largest width of the metatarsal head area, CSI = B/A 100 (Figure 2b). The CSI has commonly been used to measure the arch height (Gill et al., 2014; Queen et al., 2007), which is correlated with skeletal measures of arch height, such as the navicular height (Forriol & Pascual, 1990; Onodera et al., 2008).
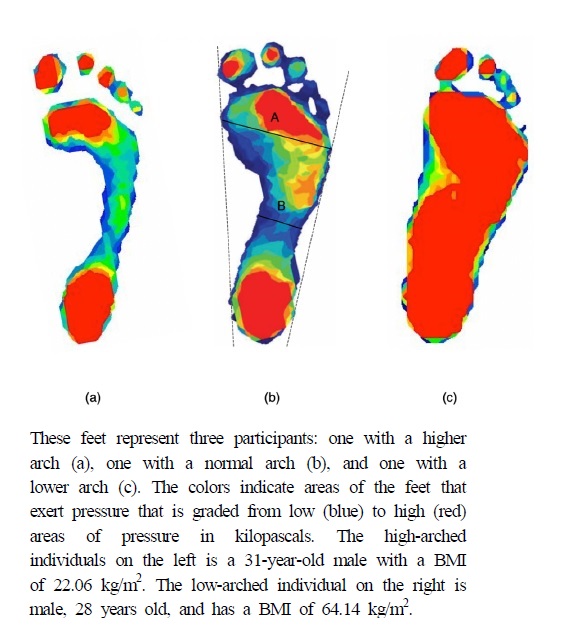
Example of digital foot pressure data.
Spatiotemporal Gait Measures
We used a portable, pressure-sensitive gait carpet (6.10 m long × 0.89 m wide) to measure the distance (x and y coordinates) and timing of each footfall at a spatial resolution of 1.27 cm and a sampling frequency of 120 Hz (Protokinetics, LLC; Peekskill, NY, USA). Participant’s preferred over-ground gait velocity was calculated by the total step length divided by total step time (m/s). Step length and width were measured by the absolute difference in anteroposterior and mediolateral center of pressure (COP) position between the right and left foot at the heel strike (m). Double-limb support time was measured by the period between heel strike and contralateral toe-off (s).
Kinematic Measures
We used a 10-camera motion capture system (Vicon Motion Systems, Oxford, UK; 100 Hz sampling frequency) to capture the positions of 40 reflective markers attached to the trunk, pelvis, thighs, shanks, and feet. Briefly, markers were placed bilaterally on the posterior heel, three metatarsal heads (1st, 2nd, and 5th), medial and lateral malleoli, medial and lateral femoral epicondyles, and greater trochanter, anterior superior iliac spine, posterior superior iliac spinae, and acromion process. A single marker was placed on the xiphoid process, jugular notch, 7th cervical vertebra, and 10th thoracic vertebrae. Rigid clusters of three markers were attached to the shank and thigh bilaterally. Raw marker positions were filtered using a second-order low-pass Butterworth filter with a cut-off frequency of 6 Hz. A static standing trial was captured, and the positions of markers on segment endpoints were used to calibrate an eight-segment model for each participant using established inertia parameters (De Leva, 1996). Lower-limb joint angles for the ankle, knee, and hip of the right leg were computed in three dimensions as the orientation of the distal segment with reference to the proximal segment and differentiated to calculate joint velocities. To assess toe-out angle during walking, foot progression angle was computed as the angle between the longitudinal axis of the right foot and the line of forward progression.
Force data were recorded during walking using the two force plates embedded in the treadmill (Bertec Corporation, Columbus, OH; 1000 Hz sampling frequency). For walking trials, participants were instructed to walk with each foot hitting its ipsilateral force plates to separate individual limb contributions during double support. Raw analog force signals were filtered with a second-order low-pass Butterworth filter with a cut-off frequency of 10 Hz. Lower-limb joint kinematics were calculated for the right leg only, and it was assumed that the left leg behaved symmetrically. All kinematic calculations were performed using Visual 3D software (C-motion Inc., Germantown, MD, USA) and analyzed using MATLAB (R2020a, Mathworks, Natick, MA, USA).
Experimental Procedure
Participants' weight was obtained with a digital scale. Height was measured with a tape measure attached to a wall. Weight and height were used to calculate the body mass index (BMI). Waist circumference and leg length were measured with a tape measure. Waist circumstance was measured as the midpoint between participants’ last rib and the top of the iliac crest. The digital foot pressure mat and the gait carpet were placed abutting one another to create a continuous walking path approximately 6.5 m long. Participants began walking at 2 meters before the edge of the carpet and ended the trial 2 meters after stepping off the carpet. Participants were instructed to walk at their normal pace (i.e., preferred walking speed). Following this, participants were positioned in the middle of the treadmill with one leg on each belt and asked to walk on the treadmill at their preferred over-ground walking speed for 2 minutes.
Statistical Analysis
SPSS 24.0 statistical software was used to complete all statistical analyses. The results were presented as means (M) and standard deviations (SD). Separate one-way ANOVAs were conducted on anthropometric measures and on CSI with BMI classification as the independent variable to examine group differences. To investigate the relationship between CSI and gait parameters and joint kinematics by group, ANCOVAs were run with BMI classification as the independent variable and CSI as a covariate separately for gait parameters and joint kinematics as the dependent variable. A Pearson’s correlation analysis was run to determine the relationship between CSI, spatiotemporal gait parameters, foot progression angle, and joint angles at the ankle, knee, and hip. For all tests, statistical significance was set at 0.05 (two-tailed). We applied Bonferroni adjustments to follow up comparisons on significant group differences for anthropometrics, CSI, and the relationship between CSI and spatiotemporal gait parameters and joint kinematics. Effect sizes were reported via partial eta squared after p-values, giving 0.01 (small), 0.09 (medium), and 0.25 (large) effects.
Results
Anthropometrics
As expected, we found the relationship between anthropometric measures and BMI classification (Table 1). Our results revealed significant differences for waist circumference (F(2,44)=101.03, p<0.01, ηp2=0.83) and body weight (F(2,44)=54.45, p<0.01, ηp2=0.72). Adults with severe obesity had higher waist circumference measures than moderate obese and normal-weight participants (ps<0.01). Results were similar for bodyweight; participants with severe obesity had higher measures than moderate obesity and normal weight (ps<0.01). There were no differences in height (F(2,44)=0.91, p=0.41, ηp2=0.04) across BMI groups.
BMI Classification and Arch Height
We examined whether there were differences in CSI according to BMI classification. The one-way ANOVA with BMI classification as the independent variable and CSI as the dependent variable showed a significant difference in CSI across BMI groups (F(2,44)=70.41, p<0.01, ηp2=0.77; Table 1). Higher values indicate lower arches. Follow-up pairwise comparisons showed that the severely obese group had lower arches than moderate obese and normal-weight groups (ps<0.01; Table 1).
BMI Classification, Arch Height, and Gait Kinematics
Results from the ANCOVA showed that the covariate, CSI, was significantly related to the participant’s step width (F(1,43)=20.15, p<0.01, ηp2=0.33) and double-limb support time (F(1,43)=8.75, p<0.01, ηp2=0.18; Table 2). CSI was also significantly associated with knee extension angle (F(1,43)=4.79, p=0.03, ηp2=0.12) and abduction angles (F(1,43)=5.89, p=0.01, ηp2=0.21; Table 3). Therefore, step width, double-limb support time, knee extension, and knee abduction angles were influenced by CSI. However, with the effect of CSI removed, BMI classification alone could not predict step width, double-limb support time, knee extension angle, and abduction angle (ps>0.05; Table 2 & 3). Although CSI did not predict, BMI classification predicted knee adduction and internal rotation, and hip internal- and external-rotation angles in the absence of CSI (ps<0.01; Table 3).

F-values (significance) for main effects of BMI on spatiotemporal gait parameters, with and without controlling for arch height

F-values (significance) for main effects of BMI on foot progression angle and lower-limb joint angles, with and without controlling for arch height
Participants with higher BMI scores demonstrated a relationship between arch height and gait parameters and lower-limb joint angles. As illustrated in Figure 3, Pearson’s correlations indicate that participants with higher BMI scores who had lower arches had a higher toe-out angle, higher gait velocity, wider step width, longer double-limb support time, higher knee extension angle, and higher knee abduction angle than participants with lower BMI scores (ps<0.01).

Relationships between lower-limb joint kinematic measurements and BMI.
Discussion
The purpose of this study was to determine whether arch height would be a mediator of obesity-related characteristics in walking among adults with different BMI classifications. Our findings revealed that obese adults had lower arches than normal weight and moderately obese adults. Arch height predicted step width, double-limb support time, and knee joint extension and abduction angles. Participants with severe obesity who have pronated feet exhibit a more cautious gait by walking more slowly with greater toe-out angles, wider steps, longer double support periods, and greater knee joint extension and abduction angles.
Our findings that arch height affects knee joint kinematics in the obese population suggest that future investigations on the direct relationship between BMI classification and musculoskeletal injury should include examining the arch height and musculoskeletal injury risk or osteoarthritis during walking in the obese population. These results are essential because no previous studies have focused on the effect of arch height on lower-limb joint kinematics during walking in the obese population. However, conditions that coexist with obesity and flat feet can cause a misalignment in the lower body, subsequent damage to the joints over time, and a devastating impact on postural stability. It is unclear whether lower arch height observed in adults with obesity represents musculoskeletal problems. However, given our findings, the effect of arch height on changes in knee joint range of motion was evident in individuals with obesity, suggesting that relationships between arch height and knee mechanics may increase the risk of musculoskeletal injuries such as knee osteoarthritis and subsequent instability during walking, which may cause fall risks.
This study is unique in examining the relationship between arch height and gait kinematics in adults with varied BMI classifications. In particular, our findings highlighted relationships between arch height and lower-limb joint kinematics in obese adults. Our results suggest that body mass and gait alterations that increase biomechanical stability during walking (e.g., increasing step width and double-limb support time) are associated with lower arches for obese adults. Lower arches lead to excessive knee extension and abduction during the heel-strike phase, which provides an insufficient propulsive force that enables faster steps with limited foot contact on the ground (Yan et al., 2013). Although a lower arch via a wider footprint may increase balance, a lower arch may be less able to provide a forceful push off during walking.
Our results have practical implications for aiding increased physical activity for obese adults and for gaining a better understanding of how arch height may affect gait kinematics based on BMI classification. In particular, these findings suggest that intervening in obese adults’ arch height may be necessary for supporting increased walking, a common and cost-effective method for increasing physical activity. Adults who are obese and who have lower arches may be more likely to respond to activity modification if provided with increased arch support. For example, orthotics designed to induce higher arches may facilitate physical activity for overweight or moderately obese individuals and prevent them from transitioning to becoming severely obese. The current findings are congruent with research suggesting that it is critical to address factors that contribute to walking instability in the obese population to increase participation in physical activity (Hulens et al., 2003). These findings, most importantly, provide insight into how increased physical activity through walking can be supported in adults with obese BMI scores.
One limitation of the current study includes using BMI to determine body composition and subsequent classification. We chose BMI to categorize our groups because it has been used for the same purposes in previous studies. Other methods for determining body composition and classification, such as body fat percentage, can yield more precise information about individuals’ weight status. However, to ensure proper reliability, sophisticated equipment is usually required, whereas BMI only requires height and weight measurements. Second, we recruited less participants with class 3 obesity than participants with normal-weight and class 1 & 2 obesity due to the lower participation rate. We acknowledge that the presence of unequal variance between groups might have resulted in an incomplete comparison between groups. A third limitation includes that we did not capture non-weight bearing arch height in participants. This did not allow us to capture a measure of foot flexibility. However, the focus of the current study was on foot structure during weight-bearing activity. A fourth limitation involves testing direct links between spatiotemporal gait measures, lower-limb joint kinematics, and arch height. With this being one of only a few studies to test relationships between spatiotemporal gait, lower-limb joint motion, and arch height in obese adults, we would expect questions to arise from the findings, which would lead to future studies. Future studies that use different methodologies (e.g., recruiting subjects who have similar BMI scores but different arch height) are needed to investigate direct links between changes in joint kinematics and kinetics during walking mediated by arch height in obese individuals.
Conclusion
In conclusion, the findings suggest that arch height affects obesity-related changes in spatiotemporal gait parameters and knee joint kinematics. The data reported here are the first to find that kinematic changes in lower-limb joint associated with excessive weight may be contingent on foot anatomy and, more specifically, the height of the foot arch.
Acknowledgements
There are no conflicts of interest.
This study was supported by the Research Program funded by SeoulTech(Seoul National University of Science and Technology) (SKK).
References
Alonso, A. C., Luna, N. M. S., Mochizuki, L., Barbieri, F., Santos, S., & Greve, J. M. D. (2012). The influence of anthropometric factors on postural balance: The relationship between body composition and posturographic measurements in young adults. Clinics, 67(12), 1433-1441.
10.6061/clinics/2012(12)14.Azarfam, A. A. Y., Özdemir, O., Altuntaş, O., Çetin, A., & Kutsal, Y. G. (2014). The relationship between body mass index and footprint parameters in older people. The Foot, 24(4), 186-189.
10.1016/j.foot.2014.08.009.Blanchard, C. M., McGannon, K. R., Spence, J. C., Rhodes, R. E., Nehl, E., Baker, F., & Bostwick, J. (2005). Social ecological correlates of physical activity in normal weight, overweight, and obese individuals. International Journal of Obesity, 29(6), 720-726.
10.1038/sj.ijo.0802927.Browning, R. C., & Kram, R. (2007). Effects of obesity on the biomechanics of walking at different speeds. Medicine & Science in Sports & Exercise, 39(9), 1632-1641.
10.1249/mss.0b013e318076b54b.Butterworth, P. A., Landorf, K. B., Smith, S. E., & Menz, H. B. (2012). The association between body mass index and musculoskeletal foot disorders: A systematic review. Obesity Reviews, 13(7), 630-642.
10.1111/j.1467-789X.2012.00996.x.Churchill, R. S., & Sferra, J. J. (1998). Posterior tibial tendon insufficiency. Its Diagnosis, Management, and Treatment. American Journal of Orthopedics (Belle Mead, NJ), 27(5), 339-347.
De Leva, P. (1996). ADJUSTMENTS TO ZATSIORSKY-SELUYANOV" S SEGMENT IN ERTIA PARAMETERS. J Biomech, 29(9), 1223-1230.
10.1016/0021-9290(95)00178-6.DeSilva, J. M., & Gill, S. V. (2013). Brief communication: A midtarsal (midfoot) break in the human foot. American Journal of Physical Anthropology, 151(3), 495-499.
10.1002/ajpa.22287.Dicharry, J. M., Franz, J. R., Croce, U. D., Wilder, R. P., Riley, P. O., & Kerrigan, D. C. (2009). Differences in static and dynamic measures in evaluation of talonavicular mobility in gait. Journal of Orthopaedic & Sports Physical Therapy, 39(8), 628-634.
10.2519/jospt.2009.2968.Fascione, J. M., Crews, R. T., & Wrobel, J. S. (2012). Dynamic footprint measurement collection technique and intrarater reliability: Ink mat, paper pedography, and electronic pedography. Journal of the American Podiatric Medical Association, 102(2), 130-138.
10.7547/1020130.Forhan, M., & Gill, S. V. (2013). Obesity, functional mobility and quality of life. Best Practice & Research Clinical Endocrinology & Metabolism, 27(2), 129-137.
10.1016/j.beem.2013.01.003.Forriol, F., & Pascual, J. (1990). Footprint analysis between three and seventeen years of age. Foot & Ankle, 11(2), 101-104.
10.1177/107110079001100208.Frey, C., & Zamora, J. (2007). The effects of obesity on orthopaedic foot and ankle pathology. Foot & Ankle International, 28(9), 996-999.
10.3113/FAI.2007.0996.Gill, S. V., Lewis, C. L., & DeSilva, J. M. (2014). Arch height mediation of obesity-related walking in adults: Contributors to physical activity limitations. Physiology Journal, 2014.
10.1155/2014/821482.Gill, S. V., & Narain, A. (2012). Quantifying the effects of body mass index on safety: Reliability of a video coding procedure and utility of a rhythmic walking task. Archives of Physical Medicine and Rehabilitation, 93(4), 728-730.
10.1016/j.apmr.2011.09.012.Gravante, G., Russo, G., Pomara, F., & Ridola, C. (2003). Comparison of ground reaction forces between obese and control young adults during quiet standing on a baropodometric platform. Clinical Biomechanics, 18(8), 780-782.
10.1016/S0268-0033(03)00123-2.Hales, C. M., Carroll, M. D., Fryar, C. D., & Ogden, C. L. (2020). Prevalence of obesity and severe obesity among adults: United States, 2017-2018.
Hulens, M., Vansant, G., Claessens, A. L., Lysens, R., & Muls, E. (2003). Predictors of 6-minute walk test results in lean, obese and morbidly obese women. Scandinavian Journal of Medicine & Science in Sports, 13(2), 98-105.
10.1034/j.1600-0838.2003.10273.x.Hung, Y.-C., Gill, S. V., & Meredith, G. S. (2013). Influence of dual-task constraints on whole-body organization during walking in children who are overweight and obese. American Journal of Physical Medicine & Rehabilitation, 92(6), 461-471.
10.1097/PHM.0b013e31828cd59d.Jensen, M. D., Ryan, D. H., Apovian, C. M., Ard, J. D., Comuzzie, A. G., Donato, K. A., Hu, F. B., Hubbard, V. S., Jakicic, J. M., & Kushner, R. F. (2014). 2013 AHA/ACC/TOS guideline for the management of overweight and obesity in adults: A report of the American College of Cardiology/ American Heart Association Task Force on Practice Guidelines and The Obesity Society. Journal of the American College of Cardiology, 63(25 Part B), 2985-3023.
10.1016/j.jacc.2013.11.004.Lai, P. P., Leung, A. K., Li, A. N., & Zhang, M. (2008). Three-dimensional gait analysis of obese adults. Clinical Biomechanics, 23, S2-S6.
10.1016/j.clinbiomech.2008.02.004.Malatesta, D., Vismara, L., Menegoni, F., Galli, M., Romei, M., & Capodaglio, P. (2009). Mechanical external work and recovery at preferred walking speed in obese subjects. Medicine & Science in Sports & Exercise, 41(2), 426-434.
10.1249/MSS.0b013e31818606e7.Mathieson, I., Upton, D., & Prior, T. D. (2004). Examining the validity of selected measures of foot type: A preliminary study. Journal of the American Podiatric Medical Association, 94(3), 275-281.
10.7547/0940275.McMillan, A. G., Pulver, A. M. E., Collier, D. N., & Williams, D. B. (2010). Sagittal and frontal plane joint mechanics throughout the stance phase of walking in adolescents who are obese. Gait & Posture, 32(2), 263-268.
10.1016/j.gaitpost.2010.05.008.Messier, S. P., Davies, A. B., Moore, D. T., Davis, S. E., Pack, R. J., & Kazmar, S. C. (1994). Severe obesity: Effects on foot mechanics during walking. Foot & Ankle International, 15(1), 29-34.
10.1177/107110079401500106.Onodera, A. N., Sacco, I. C. N., Morioka, E. H., Souza, P. S., de Sá, M. R., & Amadio, A. C. (2008). What is the best method for child longitudinal plantar arch assessment and when does arch maturation occur? The Foot, 18(3), 142-149.
10.1016/j.foot.2008.03.003.Peyrot, N. (2012). Biomechanical constraints associated with walking in obese individuals. Physical Therapy Reviews, 17(5), 352-353.
10.1179/1743288X12Y.0000000029.Peyrot, N., Morin, J.-B., Thivel, D., Isacco, L., Taillardat, M., Belli, A., & Duche, P. (2010). Mechanical work and metabolic cost of walking after weight loss in obese adolescents. Medicine and Science in Sports and Exercise, 42(10), 1914-1922.
10.1249/MSS.0b013e3181da8d1e.Queen, R. M., Mall, N. A., Hardaker, W. M., & Nunley, J. A. (2007). Describing the medial longitudinal arch using footprint indices and a clinical grading system. Foot & Ankle International, 28(4), 456-462.
10.3113/FAI.2007.0456.Singh, D., Park, W., Levy, M. S., & Jung, E. S. (2009). The effects of obesity and standing time on postural sway during prolonged quiet standing. Ergonomics, 52(8), 977-986.
10.1080/00140130902777636.Timm, N. L., Grupp-Phelan, J., & Ho, M. L. (2005). Chronic ankle morbidity in obese children following an acute ankle injury. Archives of Pediatrics & Adolescent Medicine, 159(1), 33-36.
10.1001/archpedi.159.1.33.Walters, J. L., & Mendicino, S. S. (2014). The flexible adult flatfoot: Anatomy and pathomechanics. Clinics in Podiatric Medicine and Surgery, 31(3), 329-336.
10.1016/j.cpm.2014.03.005.Wearing, S. C., Hennig, E. M., Byrne, N. M., Steele, J. R., & Hills, A. P. (2006). Musculoskeletal disorders associated with obesity: A biomechanical perspective. Obesity Reviews, 7(3), 239-250.
10.1111/j.1467-789X.2006.00251.x.WHO, W. (2010). Global recommendations on physical activity for health.
Yan, S., Zhang, K., Tan, G., Yang, J., & Liu, Z. (2013). Effects of obesity on dynamic plantar pressure distribution in Chinese prepubescent children during walking. Gait & Posture, 37(1), 37-42.
10.1016/j.gaitpost.2012.05.018.