


Introduction
A high correlation between maximum strength and performance levels in different movement tasks in athletes (Case et al., 2020; Lum et al., 2020; Mcguigan, Newton et al., 2010; Mcguigan, Winchester et al., 2006; Requena et al., 2009) but also in rehabilitational settings (Rosecrance et al., 1991) can be assumed. This relationship is not only evident in traditional performance diagnostic test exercises, such as the squat, but also in maximum strength of plantar flexors (Hartmann et al., 2012; Möck et al., 2018). Furthermore, results of maximal strength tests in the plantar flexors can be seen as predictors for lower limb injuries and therefore are of high importance in injury prevention (Dallinga et al., 2012).
In training, isometric or dynamic maximum strength tests are used to monitor current strength capacities. Several study results point out isometric maximum strength measurement as a reliable and valid method with advantages in standardization of testing conditions (Lum et al., 2020; Lynch et al., 2021) while minimizing injury risk especially in multi-joint movement as the squat (Lynch et al., 2021) as well as being time-efficient (Mcguigan, Newton et al., 2010). Besides, a commonly used field-based test of strength is the one-repetition maximum (1RM) test. This test can also be considered reliable and safe (Grgic et al., 2020; Mccurdy et al., 2004). The argument used to implement 1RM tests is the dynamic muscle movement which corresponds to contractions in most sports. However, both the dynamic and isometric tests are intended to capture the construct of maximal strength and should consequently achieve a similar or the same assessment.
Several studies analyzed the relationship between maximum strength in different testing conditions (isometric vs. dynamic) for different movements. Literature shows a wide range of correlations coefficients with r ranging from 0.34 to 0.97 (Baker et al., 1994; Mcguigan, Newton et al., 2010; Mcguigan, Winchester et al., 2006; Nuzzo et al., 2008; Requena et al., 2009; Wang et al., 2016) for multi-joint exercises like the isometric mid-thigh pull (IMTP) and 1RM in the squat. This range may be explained by differences in motor unit recruitment between isometric and dynamic contractions (Nakazawa et al., 1993) and thus, differences in standardization. It seems that the level of correlation depends on several factors as investigated muscle, type of contraction (Rutherford & Jones, 1986), use of specific angles (Lum et al., 2020; Murphy et al., 1995; Rosecrance et al., 1991; Weir et al., 1995), movement velocity and whether testing is performed in single joint or multi-joint movements (Birch et al., 2007; Feeler et al., 2010; Mcguigan et al., 2010). Also, in single joint movements very different correlation coefficients could be determined. Birch et al. (Birch et al., 1994) showed correlations of r=0.59 between isometric lifting strength and back strength as well as leg strength of r=0.74, while Feeler et al. (Feeler et al., 2010) determined correlation of just r=0.34 between a dynamic and static leg lift. High correlation coefficients are sometimes used to make statements about the replaceability of one test procedure by another: “Given that the test seems to indicate to a large extent the dynamic performance characteristics of athletes, it may not be necessary to perform 1RM testing on a large number of exercises.“ (Mcguigan & Winchester, 2008). Because of diverse correlation coefficients reported in literature between isometric and dynamic testing conditions (r ranging from 0.34 to 0.97) that depend on many factors, e. g. the tested muscle group, correlation between both contraction specificities cannot be determined as a general relationship and should be determined for each muscle group independently.
To the best of our knowledge, first, there are no studies investigating maximal strength in plantar flexion to determine correlations between maximal isometric and dynamic strength. Signorile et al. (2002) and Arampatzis et al. (2006) indicate that with a 90° knee joint angle more power output is produced by the soleus and at 180° the gastrocnemius contribute more to power output in plantar flexion under both isometric as well as dynamic conditions. From this, the question arises whether maximal strength depends on knee joint angle as well as contraction type in maximal strength in plantar flexion. Second, assuming that the calculation of Pearson correlation coefficients is not a valid procedure to examine whether two testing conditions measure the same parameter (Lin, 1989), no studies could be detected investigating the concordance correlation coefficient (CCC) which was suggested by Lin (1989).
Consequently, the aim of this study is to show the relationships between the different strength tests (knee angle [180° vs. 90°] and type of contraction [isometric vs dynamic]) of the plantar flexors.
METHODS
Experimental Approach to the Problem
To answer the research question maximal strength of the plantar flexors with 180° knee angle was tested using a 45° leg press via a force plate which was attached to the footpad. Maximal strength in 90° knee angle was determined via a calf muscle testing device via a force plate which was attached to the testing device.
Testing order was randomized, and all measurements were performed within one week.
Subjects
Included were 87 (age: 28.3 ± 5.3 years, range 18-38 years, height: 178.3 ± 6.6 cm, weight: 81.5 ± 7.4 kg) subjects studying sports science or subjects who trained at university sports center and fitness clubs. There were 52 male subjects (28.8 ± 5.5 years, range 18-38 years, height: 179.5 ± 6.4 cm, weight: 83.6 ± 5.5 kg) and 35 female subjects (age: 28.1 ± 4.9 years, range 18-37 years, height: 176.9 ± 5.3, weight: 79.1 ± 3.1 kg) recruited. Subjects with knee pain, or surgery in the lower extremities in last 6 months were excluded from the study. All participants were sportive active and experienced in strength training of a least one year and trained 3 times a week in a gym. To ensure, that training of the plantar flexors is no unfamiliarized stimulus, only participants training their calf muscle weekly were included. Since all participants were familiar with the movement used in tests, no habituation unit was included in this study.
All participants were informed about the experimental risks involved with the research and provided written informed consent to participate in the present study. Furthermore, approval for this study was obtained from the medical ethics committee of the university Oldenburg, Nr. 2021-121. The study was performed with human participants in accordance with the Helsinki Declaration.
Procedure
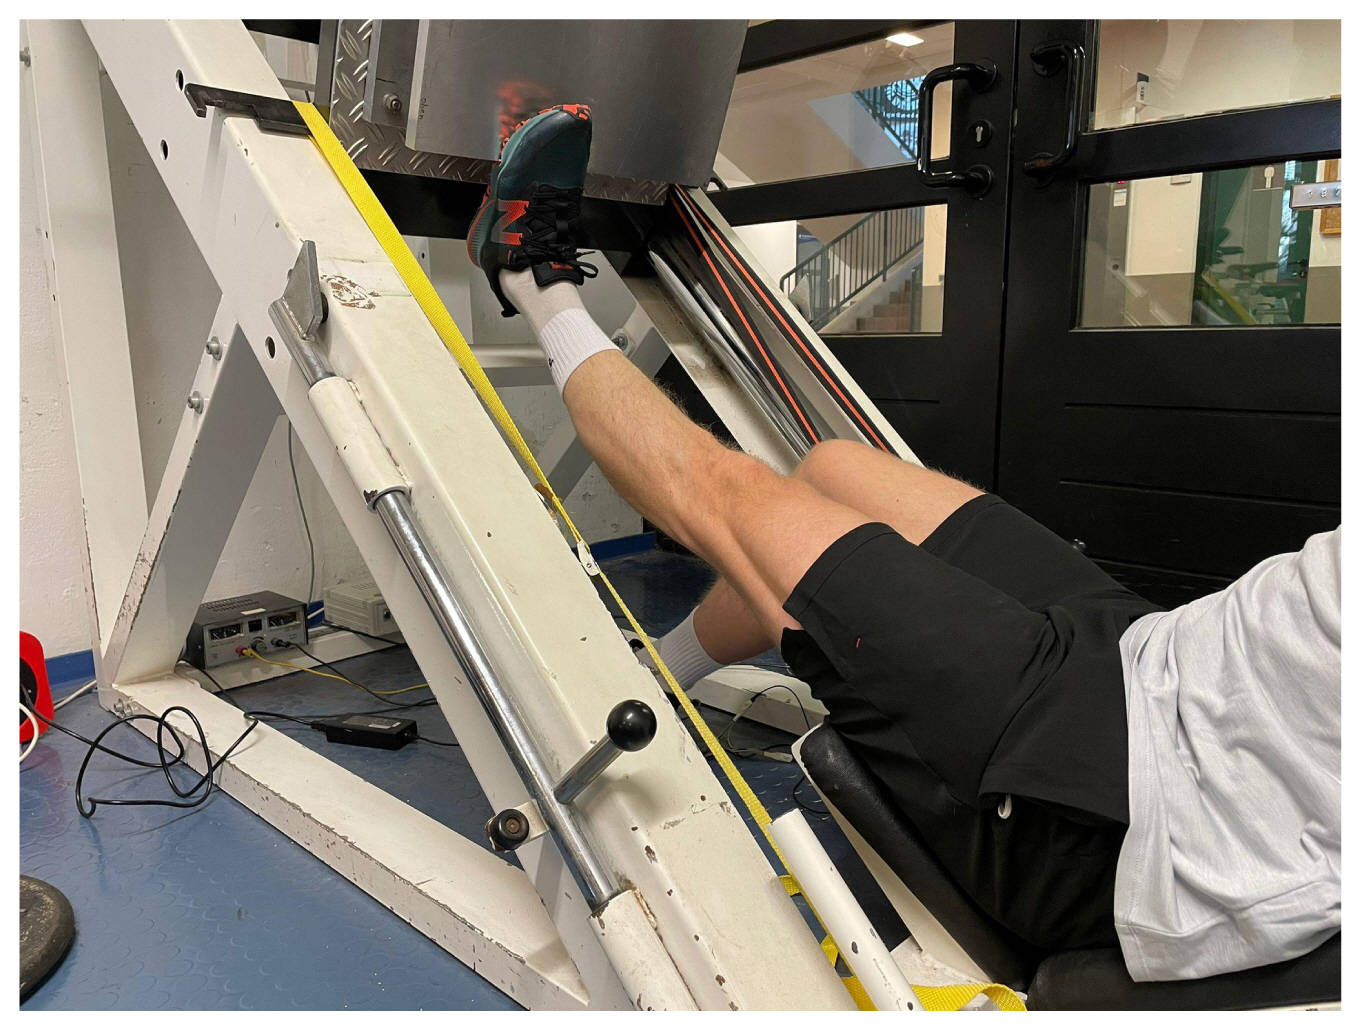
Forty-five-degree leg press was used to measure maximal isometric strength in the calf muscles in extended knee joint via a force plate which was attached to the footpad. To examine maximal strength in extended knee a 50×60 cm “AST” force plate with strain gauges was used with a resolution of 1.25N, a pull-in frequency of 1000 Hertz, and a measurement range of ±5000N.
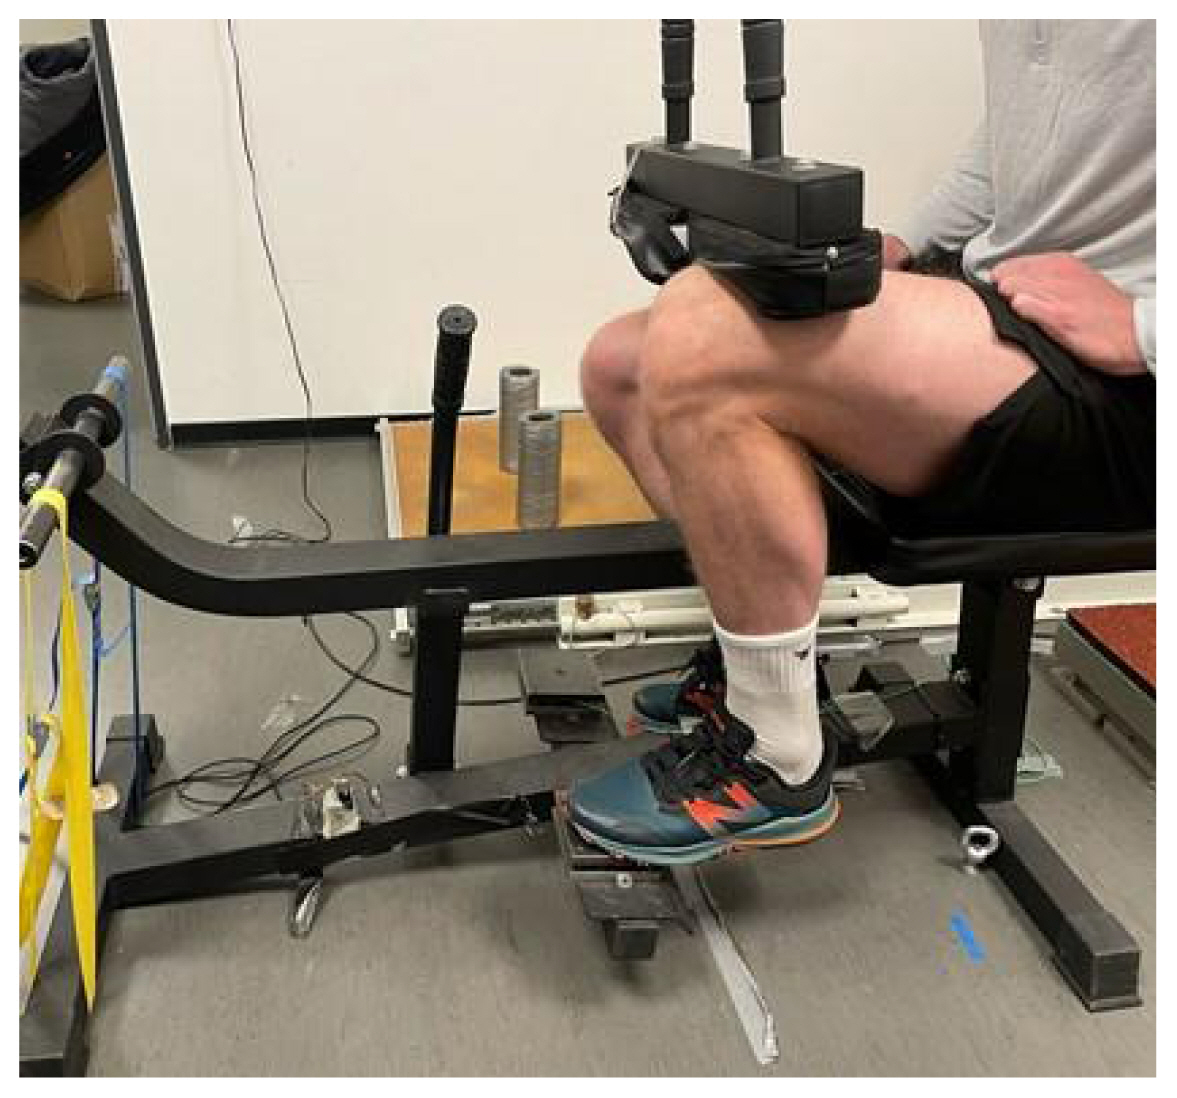
To examine maximal strength in the bended knee joint, a Calf muscle testing device was used. Maximal strength was determined using a 10×10 cm force plate in which force sensors “Kistler Element 9251A” with a resolution of 1.25 N, a pull-in frequency of 1000 Hertz, and a measurement range of ±5000 N. The vertical forces (Fz) were recorded and a charge amplifier “Typ5009 Charge Amplifier” and a 13-bit analog-to-digital converter NI6009 were used. Tests were performed within one week.
Maximal strength measurements in the calf muscle
Maximal isometric and dynamic strength were assessed using single-leg testing in extended as well as in flexed knee joint. Before testing a warm-up routine consisting of five-minute ergometer cycling at 130-bpm heart rate was performed.
Maximal isometric strength in 180° knee joint angle
To measure maximal isometric strength, the subject was instructed to place the foot on the attached force plate such as that the metatarsophalangeal joints of the feet were placed on the edge flush (Fig. 1). The starting position was chosen to give a 90° ankle joint angle with foot in neutral position to achieve a balanced activation of both heads of the gastrocnemius (Cibulka et al., 2017). The force plate was fixed to form an impassable resistance from this position. The subject was instructed to perform a maximal voluntary contraction with a plantarflexion for two seconds in response to an audible signal. After each attempt, a one-minute rest was provided to avoid fatigue. Measurements were conducted until no improvement in maximal strength was recorded.
The 1RM measurement was performed also from 90° ankle angle starting position. From this, the subject was instructed to press the applied weight into a maximal plantarflexed position. For this purpose, the covered distance was recorded with a motion sensor from the company “MicroEpsilon” with an accuracy of 0.1mm with a resolution of 0.15cm and a reliability of ICC=0.999. The investigator gradually added weight to the leg press machine until full ROM in 1RM plantarflexion could no longer be performed. The criterion for the end of measurement was the distance measurement via the displacement sensor.
Maximal isometric strength in 90° knee joint angle
To measure maximal isometric strength in the bended knee joint, the subject was instructed to place the foot on the force plate of the calf muscle testing device so that the metatarsophalangeal joints of the foot were placed on the edge flush (Fig. 2). The starting position was chosen to give a 90° ankle joint angle with foot in neutral position to achieve a balanced activation of both heads of the gastrocnemius (Cibulka et al., 2017). From this, participants were instructed to perform a maximal plantarflexion, so that the knee was pushed versus the immoveable resistance of the calf muscle testing device.
1RM measurement in plantar flexion in 90° knee joint angle
The 1RM measurement was performed also from 90° ankle angle starting position. From this, the subject was instructed to perform maximal plantar flexion vs the calf muscle testing device. In this test, the covered distance was also recorded with motion sensor from the company “MicroEpsilon” with an accuracy of 0.1mm. The investigator gradually added weight to the calf muscle testing device until full ROM in 1RM plantarflexion could no longer be performed. The criterion for the end of measurement was the distance measurement via the displacement sensor. Grgic et al.(2020) show reliability with ICC from 0.64 to 0.99 for dynamic testing condition.
Statistical analyses
The data were analyzed using SPSS 28.0. (IBM, Ehningen, DE, Germany). The significance level for all statistical tests was set at p < 0.05. The descriptive statistics for all measures are presented as the mean ± standard deviation (SD) with 95% CI. Kolmogorov Smirnov test was performed to ensure normal distribution
Reliability analyses were performed for test bests and the tests second best values using the Intraclass Correlation Coefficient (ICC) with 95% confidence interval (CI) and the coefficient of variance CV). Furthermore, a bivariate two-tailed Pearson correlation analysis was used to assess the relationship between maximal strength in the plantar flexors with 90°- and 180° knee angle for isometric as well as dynamic maximal strength measurement. To determine significant differences in the correlation coefficients between subgroups (male vs. female; different knee joint angles 90° vs. 180°), the data were z’-transformed according to the Fisher method. The difference between the two transformed values after standardization was assessed for significance (
z = ( z 1 - z 2 ) / 1 / ( n 1 - 3 ) + 1 / ( n 2 - 3 )
To evaluate whether one method can reproduce the results based on another methods, Pearson correlation seems not to be a valid method, since it measures only a linear relationship. If the first measurement is plotted against the second measurement and both measuring the same parameter, a 45° line through the origin would be estimated. Consequently, if the aim of a study is to investigate, if to methods testing the same parameter, Pearson correlation fails to show departure from the 45° line. Lin(1989) proposes the use of the concordance correlation coefficient (ρc). To show the difference between Pearson correlation and to investigate whether both procedures measuring the same parameter, ρc is determined in addition to r. Because there are different scales and units between 1RM and maximal isometric strength as well as between the knee joint angles, data was z-transformed with (measured value-M)/ SD.
Pearson correlation (r) was analyzed via “SPSS” (IBM SPSS Statistics Version 28, IBM Corp., Armonk, New York, USA) and CCC (ρc) was calculated with “R” (Version R ×64 4.1.3, Lucent Technologies. Dormagen, Germany). Post-hoc power (1-β) was calculated via G-Power (Version 3.1, Düsseldorf, Germany).
RESULTS
Testing for normal distribution using Kolmogorov Smirnov Test shows that requirements for Pearson’s product-moment correlation is fulfilled. ICC with 95% CIs, CV and correlations for the performance tests are listed in Table 1. With ICCs between 0.99 and 0.99 a good reliability can be assumed for maximal isometric strength measurements.
Table 2 shows descriptive statistics of measured values. Since the correlation coefficients for gender subgroups did not differ significantly (p<0.05) all correlations coefficients presented correspond to the entire group.
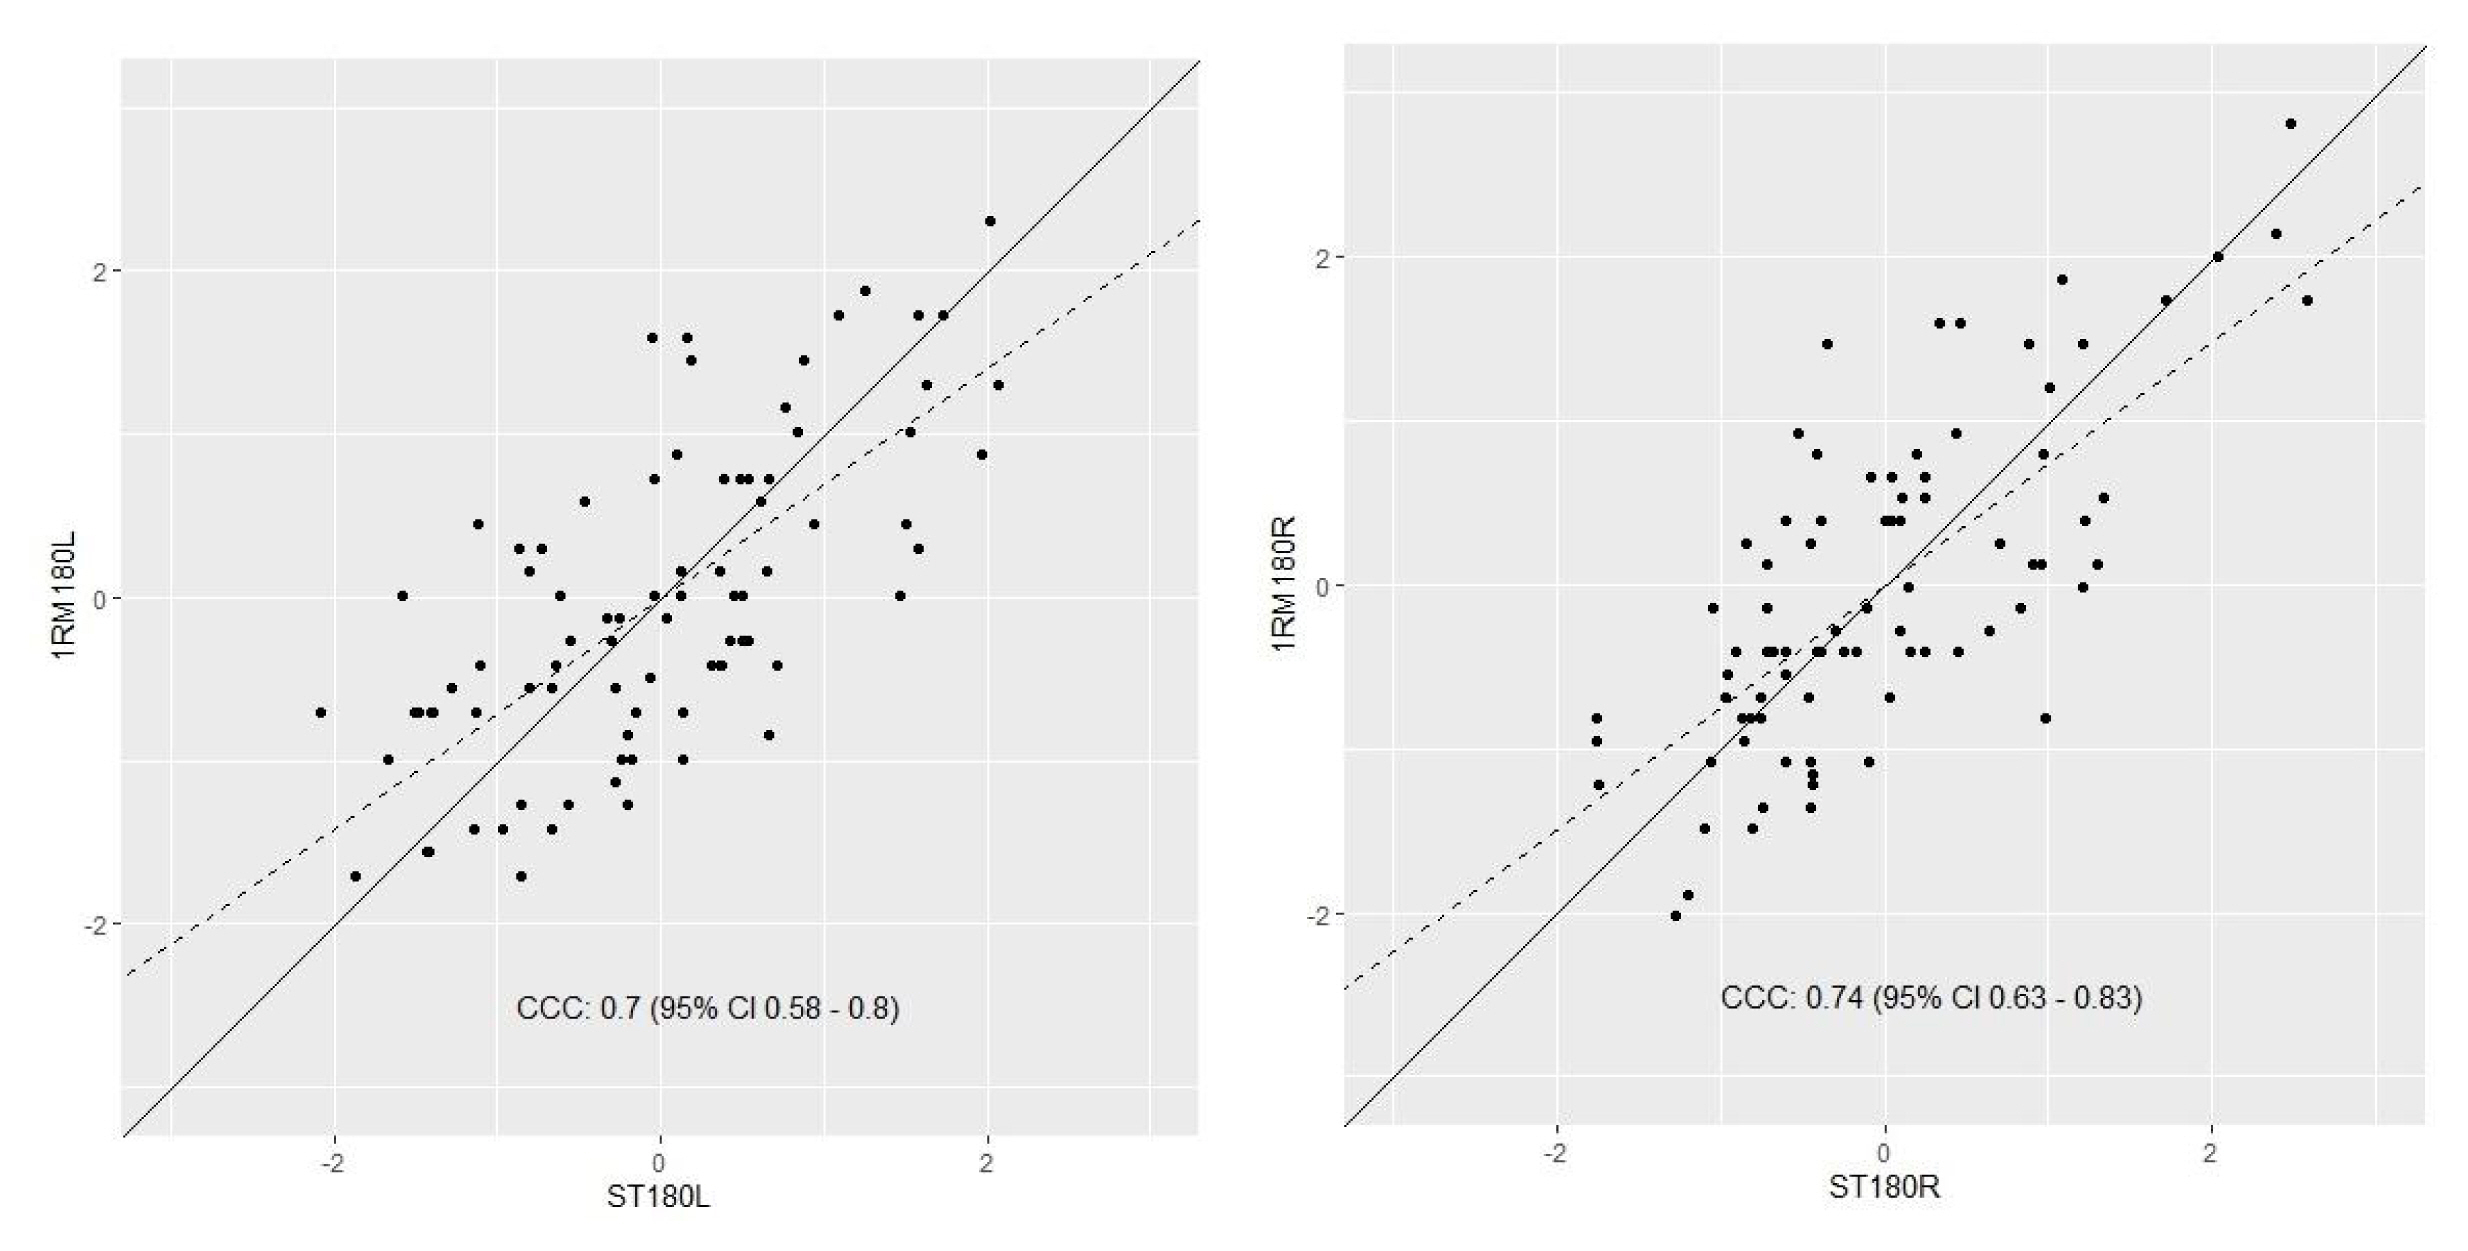
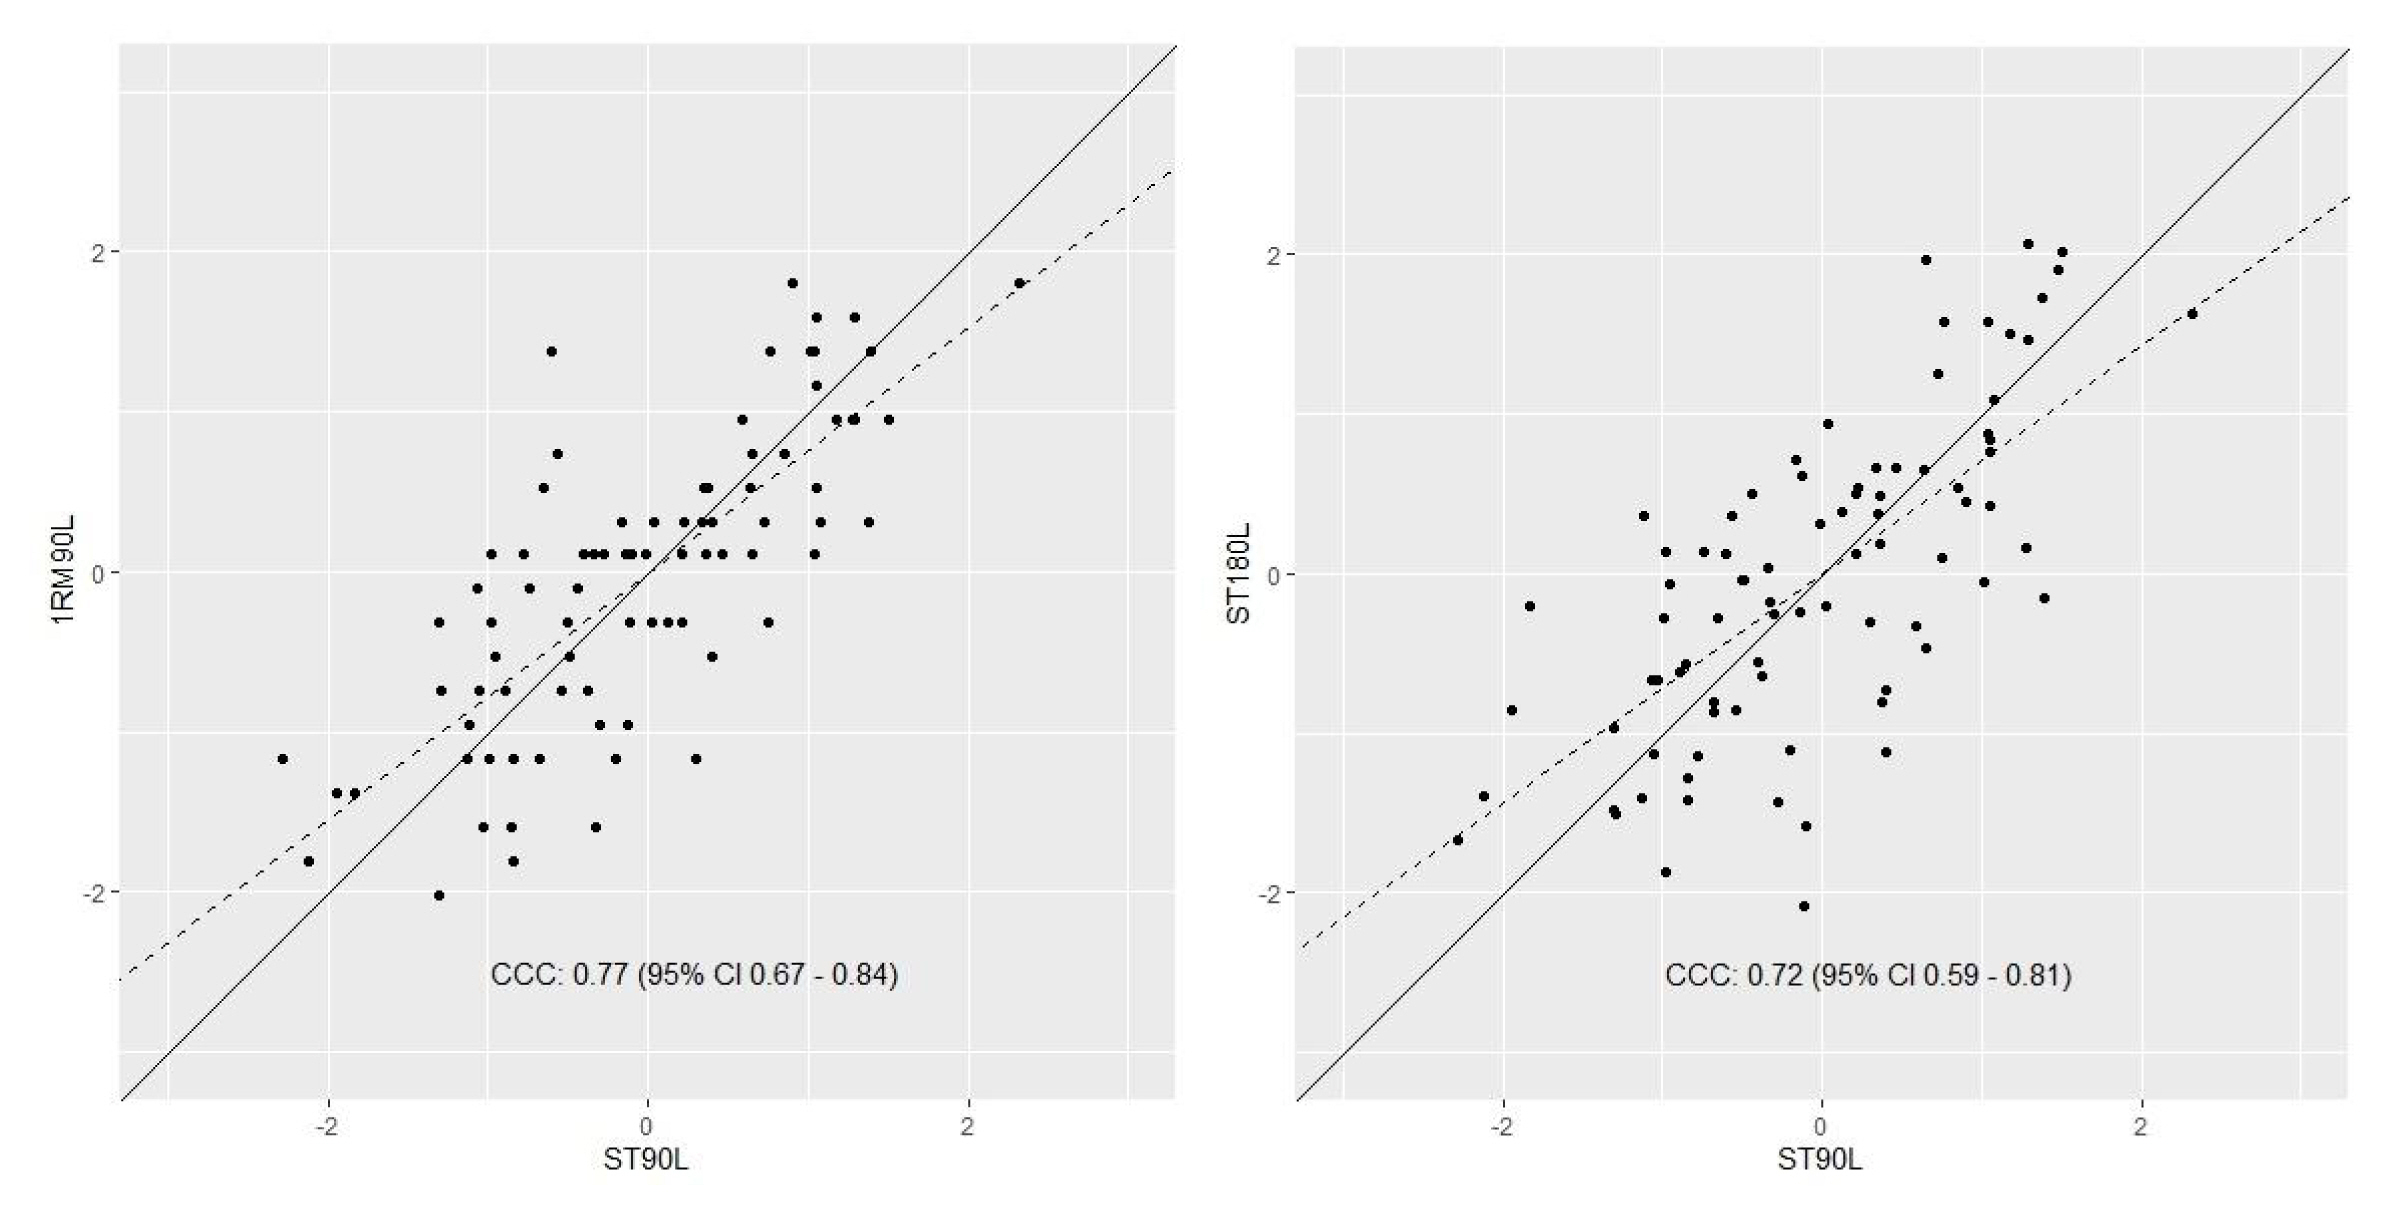
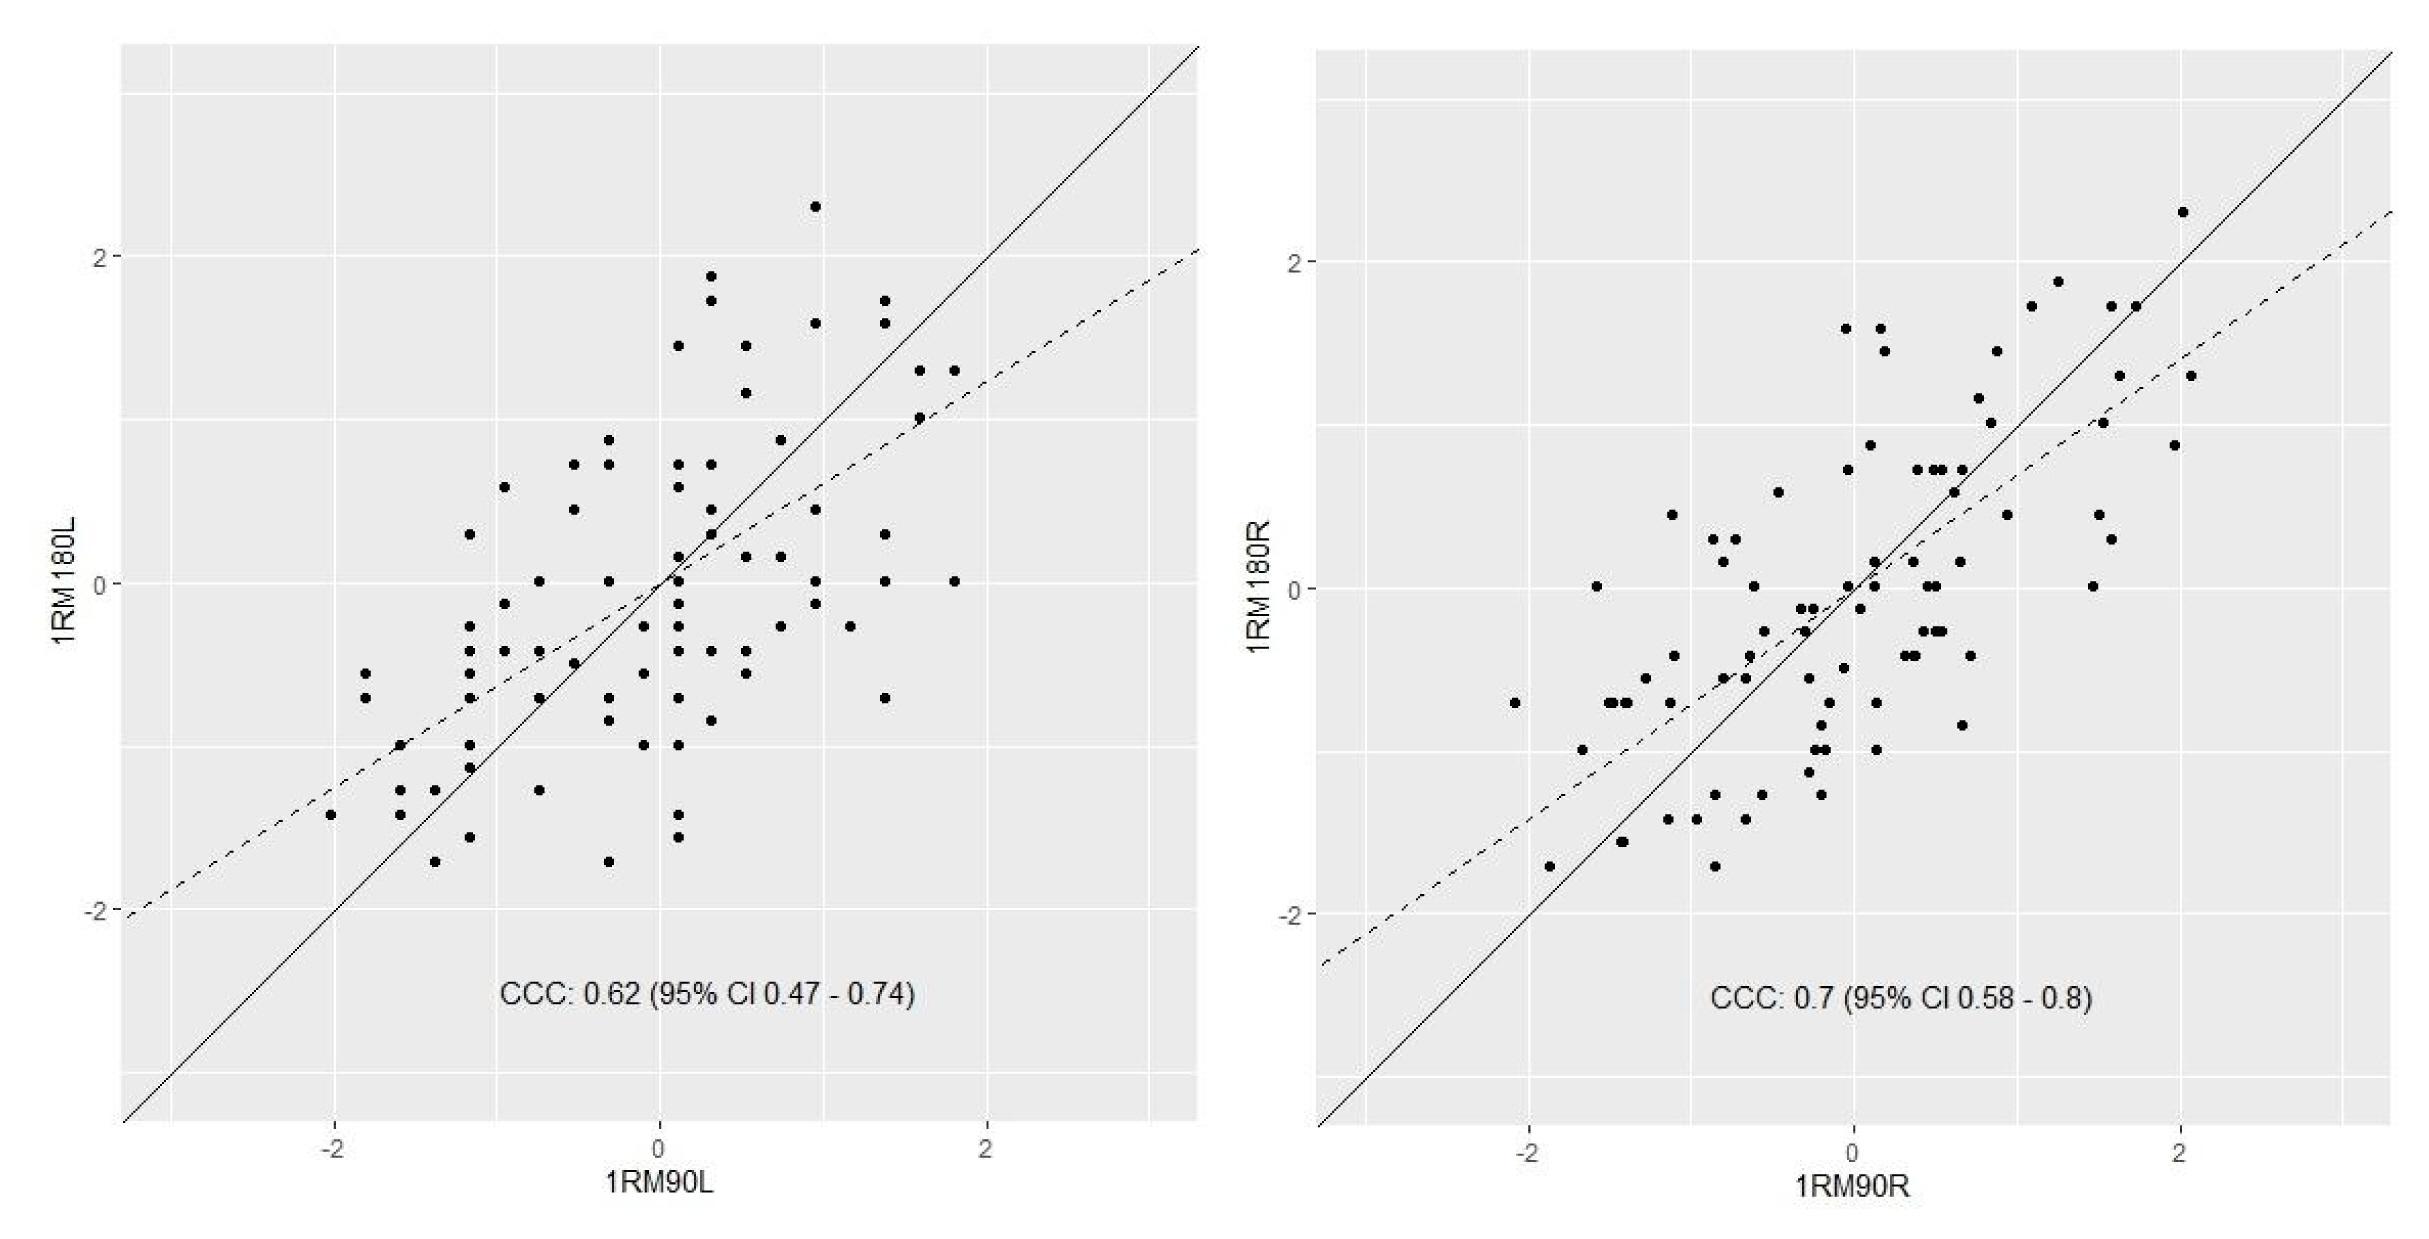
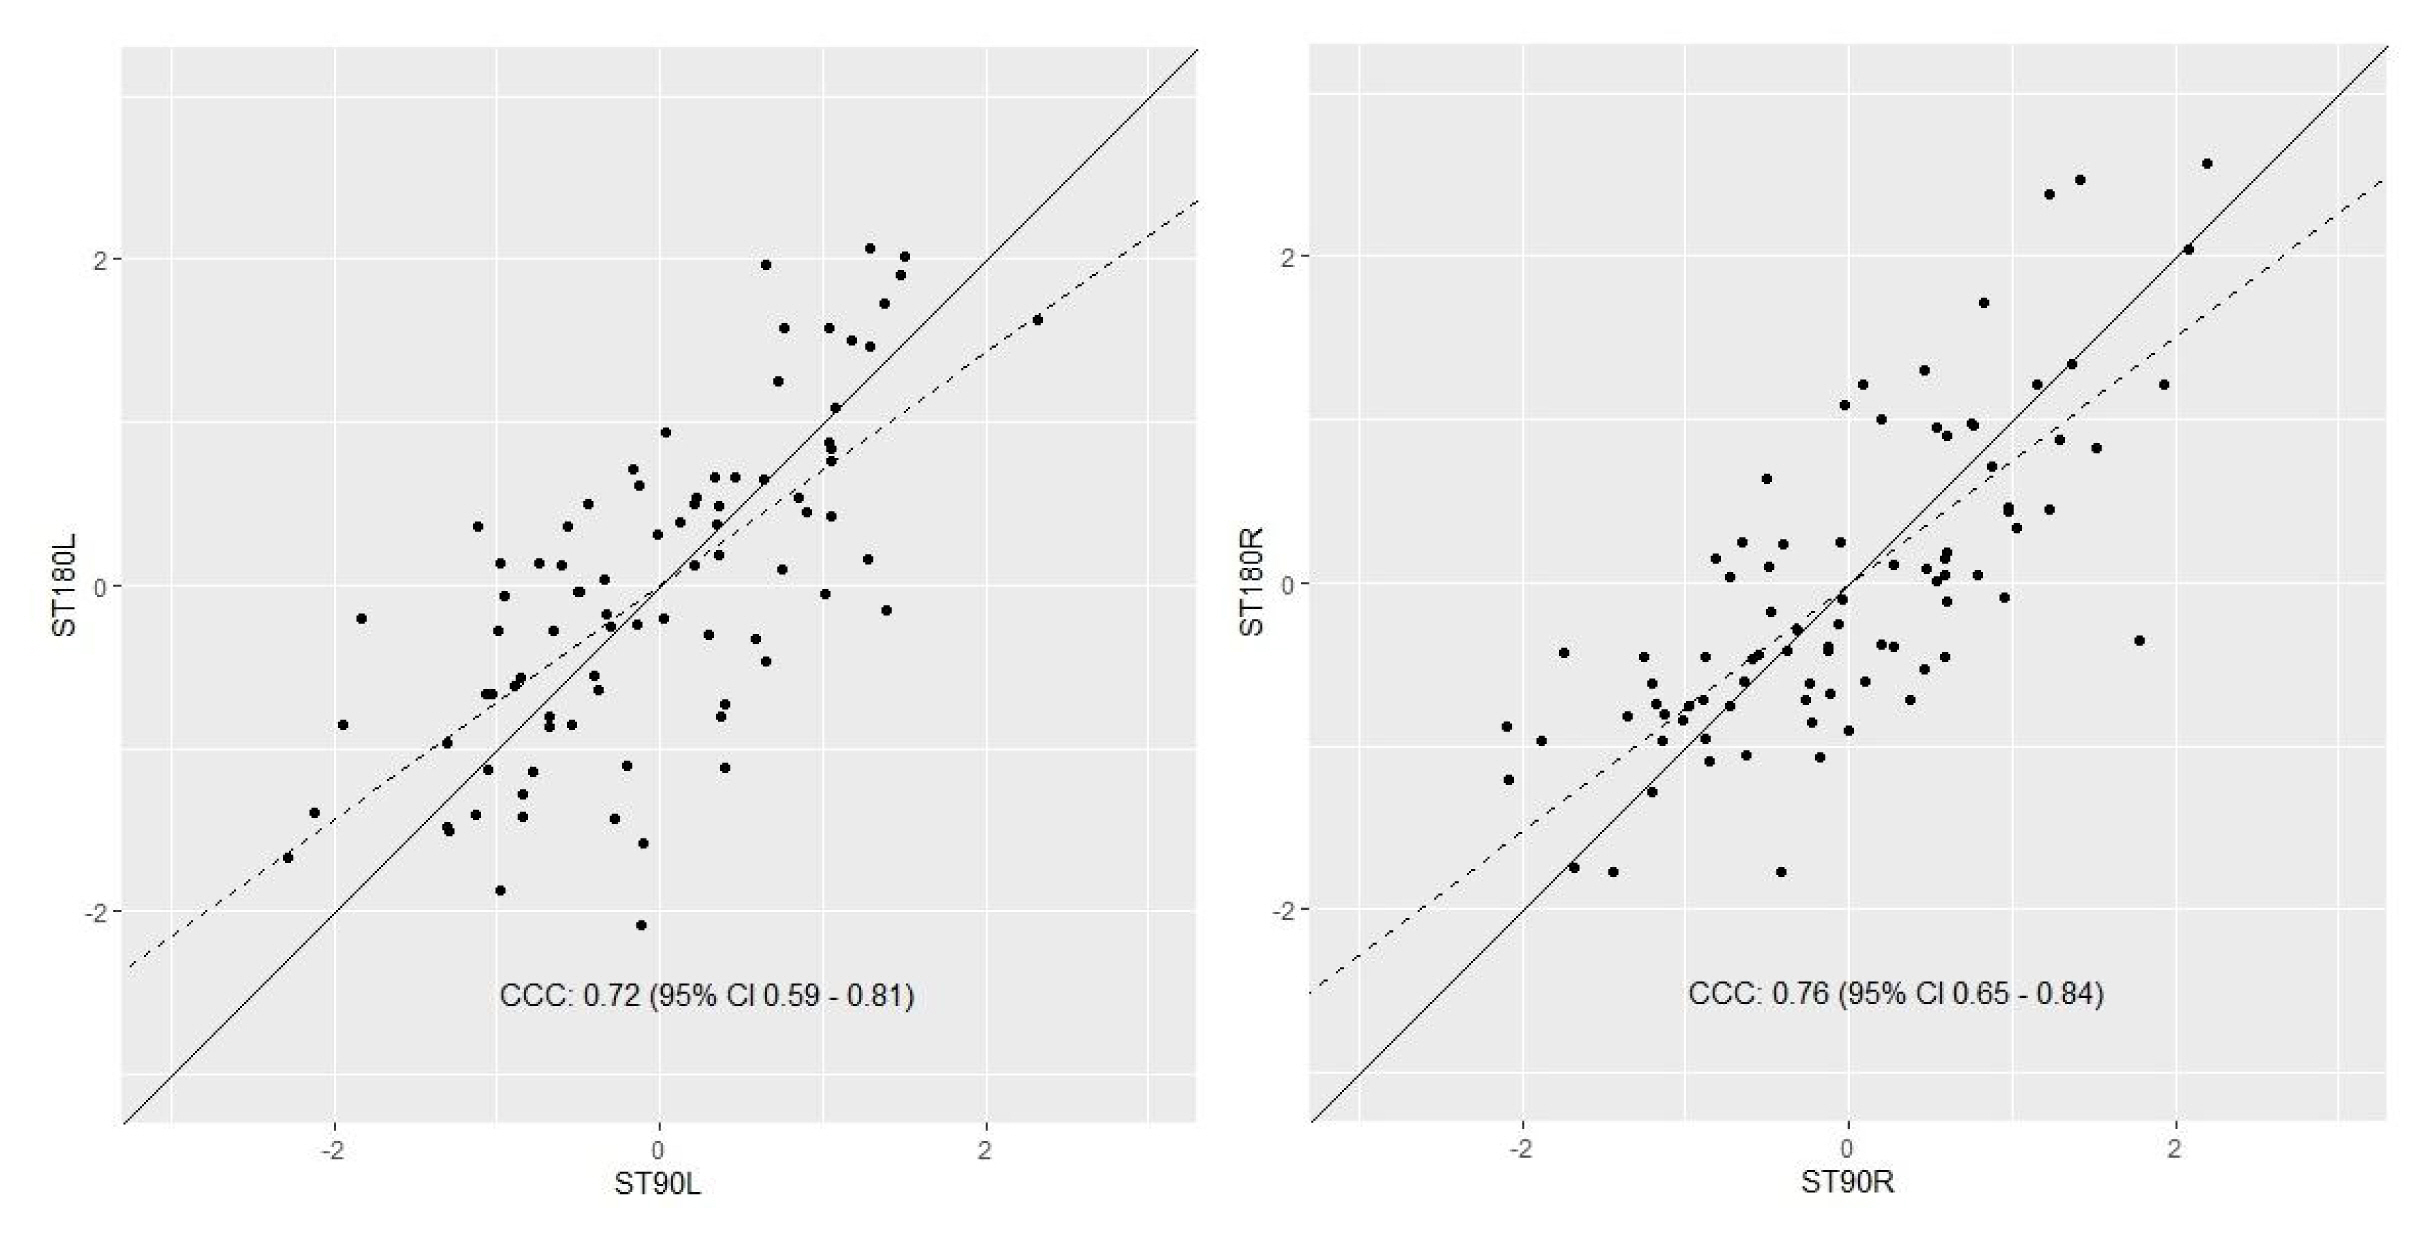
There are correlation coefficients between maximal isometric strength and maximal dynamic strength in 180° knee joint angle (r=0.76 (CI 95% 0.65-0.84), r =0.72 (CI 95% 0.60-0.81) and in 90° knee joint (r=0.77 (CI 95% 0.67-0.85), r= 0.77 (CI 95% 0.67-0.84)). Furthermore, there are correlations between maximal isometric strength in the plantar flexors for 180° and 90° knee angle (r= 0.76 (CI 95% 0.65-0.84), r=0.72 (CI 95% 0.60-0.81)) and in maximal dynamic strength (0.68 (CI 95% 0.54-0.78, r=0.63 (CI 95% 0.48-0.74)).
Post-hoc analysis for Pearson correlation was used to determine power. G-Power calculated a power (1-β err prob) of 1.0 with a critical t of 1.66 considering a total sample size of 87 and an assumed effect size of 0.7.
ST180L= static strength measurement in 180° knee joint in the left leg; 1RM180L= 1RM measurement in 180° knee joint in the left leg; ST180R= static strength measurement in 180° knee joint in the right leg; 1RM180L= 1RM measurement in 180° knee joint in the right leg
ST90L= static strength measurement in 90° knee joint in the left leg; 1RM90L= 1RM measurement in 90° knee joint in the left leg; ST90R= static strength measurement in 90° knee joint in the right leg; 1RM90L= 1RM measurement in 90° knee joint in the right leg
1RM90L= 1RM measurement in 90° knee joint in the left leg, 1RM180L= 1RM measurement in 180° knee joint in the left leg, 1RM90R= 1RM measurement in 90° knee joint in the right leg, 1RM180R= 1RM measurement in 180° knee joint in the right leg.
ST90L= static strength measurement in 90° knee joint in the left leg, ST180L= static strength measurement in 180° knee joint in the left leg; ST90R= static strength measurement in 90° knee joint in the right leg, ST180R= static strength measurement in 180° knee joint in the right leg
There were no significant differences in correlations between isometric and dynamic conditions in both legs and both knee joint angles (p < 0.005).
DISCUSSION
In this study correlations between isometric and dynamic strength (1RM) tests are examined in the triceps surae with different knee joint angels. Maximal strength was investigated in bended (90°) and extended (180°) knee joint because different parts of the triceps surae are main contributor depending on the knee angle (Arampatzis et al., 2006; Signorile et al., 2002). Analyses show correlations of r = 0.63-0.77 and rc = 0.62-0.77 for maximal isometric strength and 1RM for both knee angles. Regarding contraction specificity, correlations for maximal isometric strength and 1RM are r > 0.70 (r = 0.71-r = 0.77) and ρc = 0.7-0.77. Influence of the flexed and extended knee test conditions are not significantly different (p < 0.05).
In literature there are many studies investigating correlations between maximal isometric and dynamic strength in other movements and joints. In the squat, several authors reported correlation coefficients ranging from r = 0.69 to r = 0.86 between isometric and dynamic measurement (Bayzler et al., 2015; Blazevich et al., 2002; Drake et al., 2018). There are various factors influencing strength performance, e.g. central nervous aspects. The high variations in listed correlations can possibly be attributed to lacking familiarization with isometric testing conditions (Drake et al., 2018) since limited ability to produce high strength values in unfamiliar movement tasks can be seen. In sports or daily living performance, only very rarely isometric actions can be found. This could have led to lower correlations between isometric and eccentric-concentric measurement (Wirth et al., 2015). Furthermore, an isometric measurement is always angle-specific and the starting position in the testing procedure can be very different from the position in sports or daily living activities. Both could, on the one hand, underestimate isometric measurement und lead to lower correlations. On the other hand, there are some factors leading to an underestimation of dynamic strength testing. If there would be maximal strength from a physical point of view, the force produced from the test subject must be equal to the counterforce produced by the used weight and gravity in the 1RM testing. Since there is, in fact, a movement velocity by performing 1RM testing, the force produced by the test subject must be superior. Consequently, produced force is not maximal which leads to an underestimation in the construct of maximal strength. If maximal strength would be tested no movement would actually occur. In addition, correlations between maximal isometric and dynamic strength in different knee joints and different motor tasks as jumping and sprinting or postural control tests should be examined as well. It seems questionable to assume transferability of isometric strength values to dynamic movement conditions particularly to performance tests as the counter movement jump (CMJ) or sprinting performance (Jarić et al., 1989; Murphy & Wilson, 1996; Wilson & Murphy, 1996).
Testing specificites
In the bended knee, a higher focus on the soleus can be assumed while in extended knee the gastrocnemius is included in the movement to a higher extend (Hébert-Loiser et al., 2012). Since Feeler et al. (2010) show that maximal strength capacity is dependent on muscle length as the point out that “[d]ue to the musculoskeletal length-tension relationship of the human body, maximum force is typically produced in the mid-range of motion” standardization is required. In the present study the starting angle of the ankle joint was standardized with 90° because muscle length could not be measured and standardization of the starting joint position is commonly used in listed studies. Differences were produced by varying the starting angle in the knee joint that leads to differences in focusing muscle groups in the triceps surae (gastrocnemius vs. soleus). However, the knee angle does not appear to affect the magnitude of the correlations between strength measurements of the two forms of contraction. Since there is no difference in the correlation level of the two strength measurements between the flexion angles in the knee joint (resulting in a difference in muscle activity), this finding can almost be considered a sensitivity test of this study. In accordance with the literature, the data show that both force measurements measure/estimate the construct strength but do not measure the same capability and that this finding does not seem to apply only to individual exercises/muscles but can be generalized.
Basically, the study is limited by the unequal number of subjects between the sexes because an eventual equal distribution in the population is to be assumed. To control for this limitation, the correlations were controlled for differences between the sexes and only analyzed as total group in the follow-up. Another limitation arises from the ad hoc sample which in principle can lead to bias. To control a possible bias a significantly higher number of subjects was analyzed in this study compared to similar cross-sectional studies. Despite the limitations mentioned above, this study offers a valuable addition to the heterogeneous studies conducted to date. Based on the results, it can be assumed that maximal isometric and dynamic strength are influencing each other to a significant degree but both methods measure different capabilities.
Practical applications
Based on the results, there should be increased attention when recording performance parameters as the choice of test conditions (isometric vs dynamic) as well as angular positions of joints seem to have an influence on generation of maximal strength in the triceps surae. Since Murphy & Wilson (Murphy & Wilson, 1996) and Wilson & Murphy (Wilson & Murphy, 1996) point out better transferability of 1RM testing to sport specific movements in contrast to isometric testing, it could be hypothesized that monitoring programs investigating performance specific tasks should primary include 1RM testing conditions. Second, since classification of Pearson correlations strongly depend on specific content as well as the research methodology (Cohen, 1988: 25), it must be questioned whether a Pearson correlation coefficient of r=0.7 can be classified as high when the replacement of one method by another is requested. Based on this, it must be suggested to overthink statements as “[given that the test seems to indicate to a large extent the dynamic performance characteristics of athletes, it may not be necessary to perform 1RM testing on a large number of exercises“ (Mcguigan & Winchester, 2008), if the only reason for this statement is a correlation with r classified as strong without considering the context.
 PDF Links
 PubReader
 ePub Link
 Full text via DOI
 Download Citation
 Print
Print