Int J Appl Sports Sci > Volume 31(1); 2019 > Article
Kim, Oh, and Kim: Abdominal fat accumulation as a potential risk factor for low back pain in adult men

Abstract

The purposes of this study were twofold: (a) to examine role of body mass index in incidence of low back pain and (b) to investigate more relevant causes of low back pain in body composition. Of the 250 initial subjects, 188 subjects were included for the first analysis and divided into quartiles based on the scores of Japan Low Back Pain Evaluation Questionnaire which was adopted to assess low back pain. We selected 51 subjects (body mass index: 27.4±5.0 kg/m2; age: 47.4±10.9 years) in 1st quartile as a control group and 45 subjects (body mass index: 27.1±2.8 kg/m2; age: 56.4±7.1 years) in 4th quartile as a low back pain group for the final analysis. Assessments of anthropometric characteristics and body composition (by whole-body dual-energy X-ray absorptiometry) were carried out and body composition was evaluated as absolute and relative values. No difference in body mass index between the two groups was detected and waist hip ratio and percentage of trunk fat mass per weight in low back pain group was significantly greater than those in the control group. While low back pain was significantly related to abdominal fat related variables including waist, waist hip ratio and percentage of trunk fat mass per weight, it was not linked to other variables such as weight and body mass index. Abdominal fat accumulation may be a potential risk factor for low back pain in adult men.

Introduction

Low back pain (LBP) is one of the most prevalent musculoskeletal conditions (Andersson, 1999). Almost all people experience at least one episode of LBP during their life time (Andersson, 1999). It is not a fatal condition, but decreases quality of life by interfering with physical activity and social exchanges (Vincent, Heywood, Connelly, & Hurley, 2012; WHO, 1980). In addition, the direct medical and indirect costs of LBP are in the range of more than $50 billion per a year, and could be as high as $100 billion at the extreme in the United States (Frymoyer & Cats-Baril, 1991). Except for the United States, little is reported regarding the economic burden of LBP, but a huge amount is estimated in the other countries. Given these individual and economic impacts, the necessity of investigating the cause of LBP is extremely high.
For decades, body mass index (BMI) has been broadly adopted to evaluate obesity rate and a positive relation between increased BMI and increased incidence rate in musculoskeletal condition such as LBP has been reported (Lementowski & Zelicof, 2008). However, BMI is a measure of relative weight; fat mass and muscle mass are not distinguished. As age increases, body composition may change with a loss of muscle mass and an accumulation of fat mass without BMI change (Roubenoff & Rall, 1993). An accumulation of fat mass may be physical burden on the musculoskeletal system which is weakened by a loss of muscle mass (Beavers, Miller, Rejeski, Nicklas, & Kritchevsky, 2013; Kim et al., 2017b). That is why we should focus on body composition rather than BMI to identify the cause of LBP.
Based on this consideration, we performed a comparative study to explore whether BMI plays a major role in incidence of low back pain and more relevant causes of low back pain in body composition. For those two questions, we first compared BMI and body composition between the control and low back pain group. Secondly, we investigated the correlation among low back pain, anthropometric characteristics and body composition.

Methods

Study design and subjects

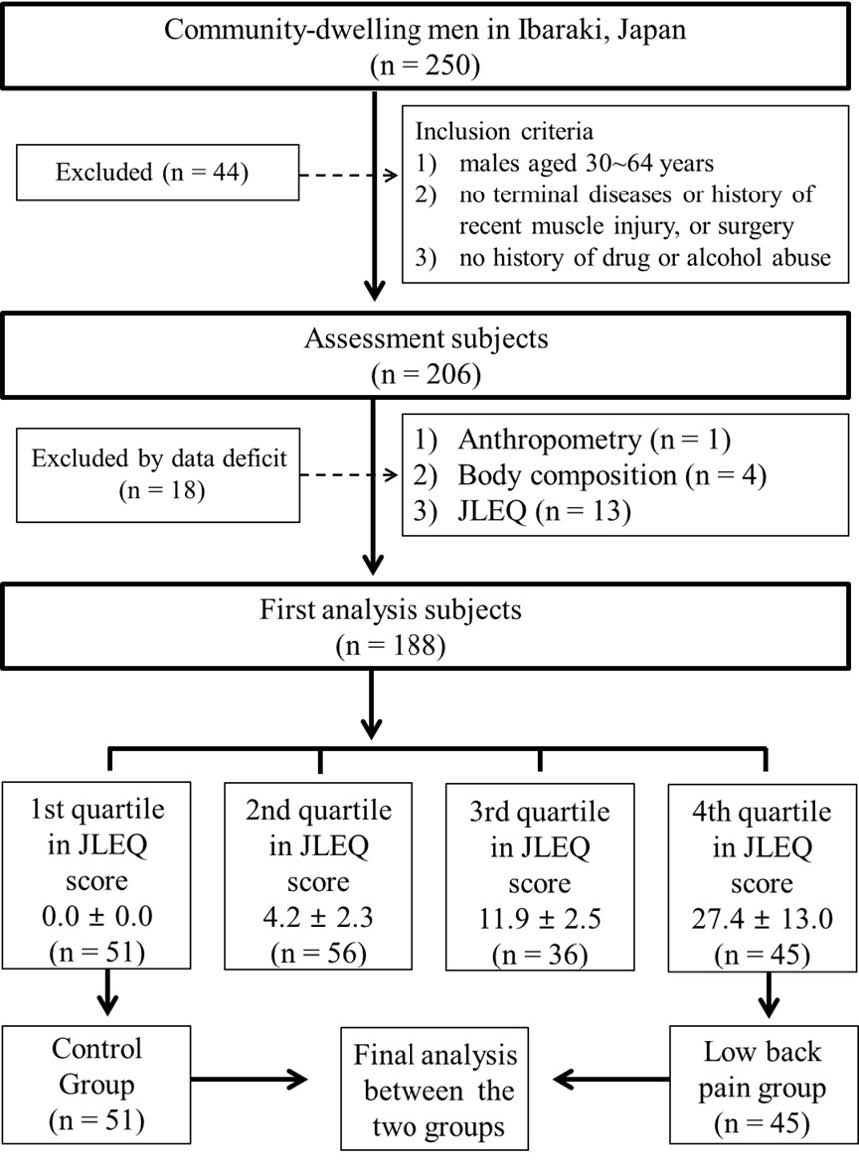
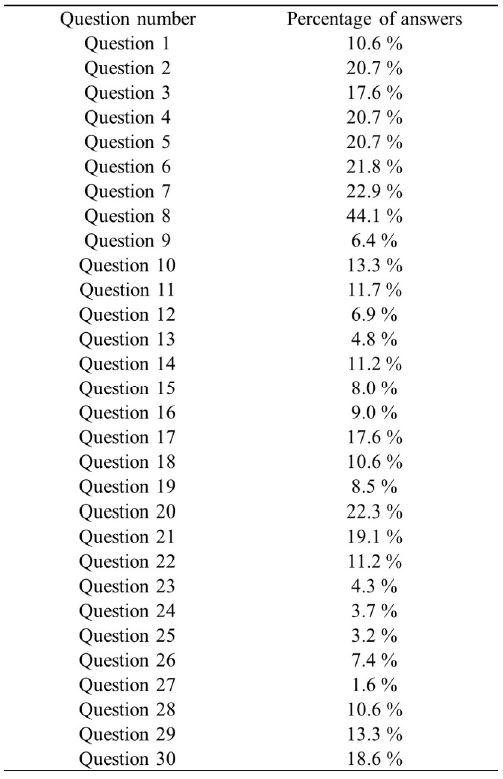
Figure 1 shows the flow chart of this study carried out at the University of Tsukuba (Tsukuba, Ibaraki, Japan). A total of 250 adult men were recruited from advertisement placed in local newspapers. Of the 250 initial subjects, 44 subjects were excluded according to the study inclusion criteria which were as follows: 1) males aged 30~64 years; 2) no terminal diseases or history of recent muscle injury, or surgery; and 3) no history of drug or alcohol abuse. After assessments, 18 subjects were excluded due to following reasons: anthropometry data deficit (n=1), body composition data deficit (n=4) and Japan Low back Pain Evaluation Questionnaire (JLEQ) data deficit (n=13). 188 subjects were includeed for the first analysis and divided into quartiles based on the scores of JLEQ. The 1st quartile (pain score: 0.0±0.0), 2nd quartile (pain score: 4.2±2.3), 3rd quartile (pain score: 11.9±2.5) and 4th quartile (pain score: 27.4±13.0) were 51 subjects, 56 subjects, 36 subjects and 45 subjects, respectively. We selected 51 subjects in 1st quartile as a control group and 45 subjects in 4th quartile as a low back pain group for the final analysis. The percentage of answers in JLEQ was presented in Figure 2. All subjects provided informed written consent as approved by the institutional review board. This study was carried out in accordance with the guidelines proposed in the Declaration of Helsinki, and the study protocol was reviewed and approved by the ethics committee of the University of Tsukuba,Japan.
Figure 1.

Flow chart of this study

IJASS_2019_v31n1_25_f001.jpg
Figure 2.

Percentage of answers in the Japan low back pain evaluation questionnaire

IJASS_2019_v31n1_25_f002.jpg

Anthropometry and body composition

Height and body weight were assessed to the nearest 0.1cm or 0.1kg, respectively, with subjects wearing light garments. BMI was computed as the weight divided by the height squared (kg/m2). Waist and hip circumstances were assessed to the nearest 0.1cm using a glass fiber tape. To calculate waist hip ratio (WHR), waist circumstance was divided by hip circumstance. Body composition was assessed by whole-​body dual energy x-ray absorptiometry (DEXA; QDR 4500, Hologic Inc., Bedford, MA). To assess body composition, the subjects were positioned in a supine position with the arms held against the sides of the body. Hologic software was employed to analyze the assessments, yielding estimates of fat, lean, and bone tissue mass (in kilograms). Extended analyses were used to divide the body composition results into arms, legs, and trunk, yielding data on lean and fat mass for each body region. We evaluated body composition in the each body region as absolute and relative values. For absolute values in the each body region, we summed lean or fat mass in the both arms or legs, respectively and fat and lean mass in the trunk were adopted as it is. With respect to relative values, absolute values in each body region’s lean or fat mass were divided by weight, and the results were multiplied by 100%. It is the easiest method for evaluation of regional body composition to assess absolute lean and fat mass in each body region. However, considering the positive association among weight, lean and fat mass, a group which has greater weight is likely to have greater lean and fat mass in each body region. To evaluate the quality of regional body composition, relative evaluation of body composition in each body region was performed in this study.

Evaluation of low back pain

The Japan Low back Pain Evaluation Questionnaire (JLEQ) was used to evaluate low back pain. It is a self-administered, disease-specific measure, and consists of 30-items, including 7 questions regarding LBP in the last few days, 17 questions regarding the problems in daily activity because of LBP in the last few days, and 6 questions regarding general health status in the last month. These 30 items in the 3 domains are ranked depending on a 5-point scale from no impairment (0point) to serious impairment (4 points) and then added to produce a total score (maximum 120 points). The validity and reliability of JLEQ were verified by comparison with the Roland-Morris Disability Questionnaire.

Statistics

The data was analyzed with SPSS software (version 20.0; IBM, Inc., Armonk, USA). To determine whether data had normal distribution, Kolmogorov-Smirnov test was employed. The independent-sample t-test and Mann-Whitney U test were employed for normally and abnormally distributed data, respectively. Partial correlation adjusted for age and height was used to determine the association among pain score, anthropometric characteristics and body composition. The data was expressed as the means±standard deviation or as the means±standard error. Cohen’s d was employed to calculate the effect size. p<0.05 was considered statistically significant.

Results

Table 1 contains characteristics of subjects in the anthropometric analysis and the differences between the two groups. There were no significant differences in weight, BMI, waist, hip between the two groups. Height in the low back pain group was significantly smaller than that in control group (p<0.01). With regard to Age and WHR, the values in the low back pain group were significantly greater than those in the control group (p< 0.001 for both).
Table 1.

Characteristics of subjects in the anthropometric analysis and the differences between the two groups

Control groupa (n=51) Low back pain groupa (n=45) Mean differenceb (95% CI) p Effect
size
Age (year) 47.41±10.93 56.38±7.07 -8.97±1.91(-12.75, -5.18) <0.001 0.975
Height (cm) 171.30±6.29 167.90±3.95 0.03±0.01(0.01, 0.06) <0.01 0.647
Weight (kg)* 80.61±16.81 76.50±7.90 4.10±2.63(-1.14, 9.35) 0.364 0.313
BMI (kg/m2) 27.41±4.99 27.14±2.80 0.26±0.84(-1.41, 1.93) 0.755 0.067
Waist (cm) 97.37±10.50 100.71±9.40 -3.34±2.04(-7.40, 0.72) 0.106 0.335
Hip (cm)* 99.87±8.48 97.97±4.86 1.90±1.39(-0.86, 4.67) 0.719 0.275
Waist hip ratio 0.97±0.04 1.03±0.07 -0.05±0.01(-0.08, -0.03) <0.001 1.052

aValues are mean ± standard deviation or bmean ± standard error; *Mann-Whitney U test was employed. Abbreviations: CI = Confidence interval; BMI = body mass index

Characteristics of subjects in the body composition analysis and the differences between the two groups are presented in Table 2. Except for percentage of trunk fat mass per weight (% trunk fat mass/weight), leg lean mass and percentage of leg lean mass per weight (% leg lean mass/weight), there were no significant differences in any of the other variables between the two groups. % trunk fat mass/weight in the low back pain group was significantly greater than that of the control group (p<0.05), but the opposite results were found in leg lean mass and % leg lean mass/weight (p<0.01 and p<0.05, respectively).
Table 2.

Characteristics of subjects in the body composition analysis and the differences between the two groups

Control groupa (n=51) Low back pain groupa (n=45) Mean differenceb (95% CI) p Effect
size
Whole body lean mass (kg)* 62.69±9.47 59.10±4.96 3.59±1.52(0.57, 6.61) 0.074 0.475
Whole body fat mass (kg)* 18.91±8.41 18.39±4.07 0.51±1.32(-2.13, 3.15) 0.652 0.079
Trunk lean mass (kg)* 31.00±4.83 29.45±3.28 1.56±0.83(-0.10, 3.21) 0.168 0.375
% trunk lean mass/weight (%) 38.82±2.96 38.51±1.90 0.30±0.51(-0.72, 1.32) 0.558 0.125
Trunk fat mass (kg)* 9.31±5.07 9.55±2.10 -0.24±0.78(-1.79, 1.31) 0.079 0.062
% trunk fat mass/weight (%) 11.08±3.40 12.41±2.05 -1.33±0.58(-2.49, -0.17) <0.05 0.474
Arm lean mass (kg) 6.81±1.15 6.73±0.68 0.07±0.20(-0.32, 0.46) 0.706 0.085
% arm lean mass/weight (%) 8.53±0.94 8.84±0.84 -0.31±0.18(-0.67, 0.05) 0.090 0.348
Arm fat mass (kg)* 2.23±0.90 2.27±0.61 -0.04±0.16(-0.35, 0.27) 0.361 0.052
% arm fat mass/weight (%) 2.70±0.64 2.97±0.50 -0.23±0.12(-0.46, 0.01) 0.058 0.470
Leg lean mass (kg)* 20.45±3.52 18.68±1.33 1.77±0.53(0.70, 2.83) <0.01 0.665
% leg lean mass/weight (%) 25.58±2.24 24.55±1.76 1.03±0.42(0.21, 1.86) <0.05 0.511
Leg fat mass (kg)* 6.23±2.62 5.48±1.73 0.75±0.45(-0.14, 1.64) 0.115 0.338
% leg fat mass/weight (%) 7.57±1.86 7.08±1.64 0.5±0.36(-0.22, 1.21) 0.172 0.279

aValues are mean ± standard deviation or bmean ± standard error; *Mann Whitney U test was employed. Abbreviations: CI = confidence interval; % trunk lean mass/weight = percentage of trunk lean mass per weight; % trunk fat mass/weight = percentage of trunk fat mass per weight; % arm lean mass/weight = percentage of arm lean mass per weight; % arm fat mass/weight = percentage of arm fat mass per weight; % leg lean mass/weight = percentage of leg lean mass per weight; % leg fat mass/weight = percentage of leg fat mass per weight

Table 3 shows partial correlation between pain score and characteristics of anthropometry and body composition adjusted for age and height. Significant correlations were detected in waist (r=0.205, p=0.047), waist hip ratio (r=0.449, p=0.001) and % trunk fat mass/​weight (r=0.217, p=0.036), but no significant correlations were found in any of the other variables.
Table 3.

Partial correlation between pain score and characteristics of anthropometry and body composition adjusted for age and height

Pain score
Weight BMI Waist Hip Waist hip
ratio
Whole body
lean mass
Whole body
fat mass
Trunk lean
mass
% trunk lean
mass/weight
Trunk fat
mass
r 0.001 -0.001 0.205 -0.069 0.449 -0.088 0.083 -0.073 -0.148 0.119
p 0.995 0.991 0.047 0.507 0.001 0.398 0.425 0.487 0.153 0.255
Pain score
% trunk fat
mass/weight
Arm lean
mass
% arm lean
mass/weight
Arm fat
mass
% arm fat
mass/weight
Leg lean
mass
% leg lean
mass/weight
Leg fat
mass
% leg fat
mass/weight
r 0.217 -0.039 -0.051 0.073 0.118 -0.110 -0.169 0.010 0.001
p 0.036 0.711 0.626 0.485 0.258 0.290 0.104 0.924 0.990

Abbreviations: % trunk lean mass/weight = percentage of trunk lean mass per weight; % trunk fat mass/weight = percentage of trunk fat mass per weight; % arm lean mass/weight = percentage of arm lean mass per weight; % arm fat mass/weight = percentage of arm fat mass per weight; % leg lean mass/weight = percentage of leg lean mass per weight; % leg fat mass/weight = percentage of leg fat mass per weight

Discussion

The purposes of this study were twofold: (a) to examine role of body mass index in incidence of low back pain and (b) to investigate more relevant causes of low back pain in body composition. The major findings in this study were that no difference in BMI between the two groups was detected and WHR in the low back pain group is greater than that in the control group. % trunk fat mass/weight in low back pain group was significantly greater than that in the control group, but the opposite results were found in leg lean mass and % leg lean mass/weight. Low back pain was significantly related to waist, WHR and % trunk fat mass/​weight. Overall these findings suggest that abdominal fat accumulation may be a potential risk factor for low back pain in adult men.
There were existing studies which reported a positive association BMI and LBP. Representatively, Melissas et al. (2005) reported that after significant decrease in BMI, low back pain was significantly decreased (Melissas et al., 2005). However, Leboeuf-Yde et al. (1999) reported a positive association between BMI and LBP was not found in studies of monozygotic twins who were in different body weight classification (Leboeuf-Yde, Kyvik, & Bruun, 1999). This report indicates that BMI alone cannot identify a positive association between obesity and LBP. Additionally, the findings in this study regarding weight and BMI suggest that BMI alone or weight alone cannot explain a positive association with LBP. In addition, a significant difference in waist hip ratio which is broadly used to assess central obesity between the two groups was detected in this study, meaning that central obesity may affect the low back (Bigaard et al., 2005; Janssen, Katzmarzyk, & Ross, 2004). Depending on the report in the existing study and findings in this study, it is suggested that evaluating regional body composition is necessary to reveal a risk factor for low back pain.
It was reported that trunk and leg lean mass per weight were significantly lower in women with low back pain compared to the control group (Toda, Segal, Toda, Morimoto, & Ogawa, 2000). In this study, we detected that % trunk fat mass/weight in low back pain group is significantly greater than that in the control group and leg lean mass and % leg lean mass/weight in low back pain group were significantly less than that in the control group. Relatively low leg lean mass per weight in the low back pain group is consistent between both studies. The reason why low leg lean mass per weight is linked to low back pain is assumed as follows: low leg lean mass per weight indicates a loss of muscle mass in leg and the leg with a loss of muscle mass may make it harder to sustain a heavy upper body (Kim, Tsujimoto, So, & Tanaka, 2015; Kim et al., 2017a; Vincent et al., 2012). The condition may cause knee pain and physical inactivity, and those may induce negative change of body composition in trunk (Kim et al., 2015; Kim et al., 2017a; Vincent et al., 2012).
For trunk, the finding in the existing study indicates low relative lean mass causes LBP, but the finding in this study indicates high relative fat mass causes LBP (Lementowski & Zelicof, 2008; Vincent et al., 2012). With inadequate low relative lean mass, less absorption of physical burden on weight-bearing joints occurs, and it is insufficient to endure increased physical burden. From this perspective, the importance of lean mass cannot be denied. However, recent reports have emphasized the importance of fat mass as follows: fat mass change is more significant predictor of change of physical function than lean mass change (Beavers et al., 2013; Kim et al., 2017b). People with excessive abdominal fat possess a higher risk of degenerative disorders such as LBP (Toda et al., 2000). Additionally, the results by partial correlation analysis in this study indicated that abdominal fat related variables including waist, WHR and % trunk fat mass/​weight are significantly linked to LBP. Thus, it is recognized that abdominal fat accumulation is a more significant risk factor for LBP.
This comparative study has a few limitations. First of all is that we could not directly assess abdominal fat area by using a CT or MRI. To confirm the conclusion of this study, direct assessment in abdominal fat area is recommended. The second limitation is lack of information of subjects. The characteristics of subjects including physical activity levels, LBP duration and occupation can affect LBP. Because of it, collecting those information is recommended. The third limitation is the applicability of the conclusion from this study. Only middle-aged men were selected for this study, which was because incidence rates in obesity and low back pain is higher than other gender and age group. Accordingly, a research on a wide range of gender and age groups is needed.
In conclusion, no difference in BMI between the two groups was detected and waist hip ratio and % trunk fat mass/weight in low back pain group is significantly greater than those in control group. While Low back pain was significantly related to abdominal fat related variables including waist, WHR and % trunk fat mass/​weight, it was not linked to other variables such as weight and BMI. Thus, it is suggested that abdominal fat accumulation may be a potential risk factor for low back pain in adult men.

Acknowledgements

This work was supported by the National Research Foundation of Korea grant funded by the Ministry of Education(No. NRF-2017R1A6A3A01077087).

Conflict of Interest

The authors declare no conflicts of interest.

References

1. Andersson, G. B. (1999). Epidemiological features of chronic low-back pain. Lancet , 354(9178), 581-​585. DOI: 10.1016/s0140-6736(99)01312-4.
crossref
2. Beavers, K. M., Miller, M. E., Rejeski, W. J., Nicklas, B. J., et al, & Kritchevsky, S. B. (2013). Fat mass loss predicts gain in physical function with intentional weight loss in older adults. The Journals of Gerontology, Series A: Biological Sciences and Medical Sciences , 68(1), 80-86. DOI: 10.1093/gerona/gls092.
crossref
3. Bigaard, J., Frederiksen, K., Tjonneland, A., Thomsen, B. L., Overvad, K., Heitmann, B. L., et al, & Sorensen, T. I. (2005). Waist circumference and body composition in relation to all-cause mortality in middle-aged men and women. International Journal of Obesity , 29(7), 778-784. DOI: 10.1038/sj.ijo.0802976.
crossref pdf
4. Frymoyer, J. W., et al, & Cats-Baril, W. L. (1991). An overview of the incidences and costs of low back pain. The Orthopedic clinics of North America , 22(2), 263-271.
crossref
5. Janssen, I., Katzmarzyk, P. T., et al, & Ross, R. (2004). Waist circumference and not body mass index explains obesity-related health risk. The American Journal of Clinical Nutrition , 79(3), 379-384. DOI: 10.1093/ajcn/79.3.379.
crossref
6. Kim, B., Tsujimoto, T., So, R., et al, & Tanaka, K. (2015). Changes in lower extremity muscle mass and muscle strength after weight loss in obese men: A prospective study. Obesity Research and Clinical Practice , 9(4), 365-373. DOI: 10.1016/j.orcp.2014.12.002.
crossref
7. . Kim, B., Tsujimoto, T., So, R., Zhao, X., Oh, S., et al, & Tanaka, K. (2017a). Changes in muscle strength after diet-​induced weight reduction in adult men with obesity: A prospective study. Diabetes, Metabolic Syndrome and Obesity , 10, 187-194.
crossref pdf
8. Kim, B., Tsujimoto, T., So, R., Zhao, X., Oh, S., et al, & Tanaka, K. (2017b). Weight reduction does not induce an undesirable decrease in muscle mass, muscle strength, or physical performance in men with obesity: A pilot study. The Journal of Exercise Nutrition and Biochemistry , 21(4), 37-44. DOI: 10.20463/jenb.2017.0029.
crossref
9. Leboeuf-Yde, C., Kyvik, K. O., et al, & Bruun, N. H. (1999). Low back pain and lifestyle Part II: Obesity. information from a population-based sample of 29,424 twin subjects. Spine , 24(8), discussion 783-774.
crossref
10. Lementowski, P. W., et al, & Zelicof, S. B. (2008). Obesity and osteoarthritis. American Journal of Orthopedics , 37​(3), 148-151.
11. Melissas, J., Kontakis, G., Volakakis, E., Tsepetis, T., Alegakis, A., et al, & Hadjipavlou, A. (2005). The effect of surgical weight reduction on functional status in morbidly obese patients with low back pain. Obesity Surgery , 15(3), 378-381. DOI: 10.1381/0960892053576703.
crossref pdf
12. Roubenoff, R., et al, & Rall, L. C. (1993). Humoral mediation of changing body composition during aging and chronic inflammation. Nutrition Reviews , 51(1), 1-11. DOI: 10.1111/j.1753-4887.1993.tb03045.x.
crossref
13. Toda, Y., Segal, N., Toda, T., Morimoto, T., et al, & Ogawa, R. (2000). Lean body mass and body fat distribution in participants with chronic low back pain. Archives of Internal Medicine , 160(21), 3265-3269. DOI: 10.1001/archinte.160.21.3265.
crossref
14. Vincent, H. K., Heywood, K., Connelly, J., et al, & Hurley, R. W. (2012). Obesity and weight loss in the treatment and prevention of osteoarthritis. Physical Medicine and Rehabilitation , 4(5 Suppl), S59-67.
crossref pdf
15. WHO. (1980). International classification of impairments, disabilities, and handicaps. Geneva, Switzerland.WHO. 1980; International classification of impairments, disabilities, and handicaps Geneva, Switzerland,
TOOLS
METRICS Graph View
  • 5 Crossref
  •  0 Scopus
  • 886 View
  • 4 Download
Related articles


ABOUT
BROWSE ARTICLES
EDITORIAL POLICY
FOR CONTRIBUTORS
Editorial Office
Korea Institute of Sport Science, 727 Hwarang-lo, Nowon-gu, Seoul 01794, Korea                         Privacy Policy
Tel: +82-2-970-9570    Fax: +82-2-970-9651    E-mail: publ@kspo.or.kr                

Copyright © 2024 by Korea Institute of Sport Science.

Close layer
prev next