Validating Athletes’ Subjective Performance Scale: A Rasch Model Analysis
Article information
Abstract
This study aimed to validate the athletes’ subjective performance scale (ASPS) and examine its optimal categorization measuring Korean university athletes using the Rasch model. A six-item ASPS with ten response categories was administered to 201 Korean university athletes participating in team sport events. The Rash measurement program, Winsteps (version 4.6.2.1), was used to perform Rasch analysis. The results showed that the model was a good fit for the data. The Wright-Andrich map indicated ceiling and floor effects, as ASPS items were unable to measure individuals with logits beyond 3 or below −2.5. Furthermore, the reliability of item separation and person separation demonstrated acceptable confidence. Lastly, the findings indicated that the ASPS, which utilized a 10-category rating scale, was problematic due to disordered thresholds. The exploratory analysis revealed that both six and seven-category rating scales appeared to comply with the effective classification criteria, but further research is needed for confirmatory analysis. Previous research has explored the relationships between psychometric factors and subjective performance; however, this study offers valuable insights into optimal categorization and introduces an innovative approach to measuring athletes’ subjective performance. To assess subjective sport performance satisfaction, the authors propose employing a six-category rating scale, which this study found to be reliable and valid in relation to construct.
Introduction
Measuring athletes’ performance is critical in both measurement and coaching research in sport. There are three types of performance measures: self-reported, objective, and observed reports (Eom & Kim, 2002; Nahum, 2019). With recent technological advancements, various objective report methods have been developed (Aughey, 2011; Cardinale & Varley, 2017; De Fazio et al., 2023). While objective reports are accurate for measuring individual abilities in individual sport events, team sport such as football or basketball are open-skill activities that involve a variety of performance factors, and evaluating and measuring player performance is limited due to the complex movements that occur organically in game situations (Eom & Kim, 2002). Observed evaluation is generally based on coaches’ observations. This measurement method is highly susceptible to personal biases, limited human memory capacity, and players’ fame, which can contaminate and limit specific evaluations and feedback (Franks & Goodman, 1984).
Simultaneously, efforts have been made to measure athletes’ various characteristics through self-assessment (Balaguer et al., 2002; Blecharz et al., 2015; Nicholls et al., 2012; Pensgaard & Duda, 2003; Pensgaard & Ursin, 1998). Notably, the subjective performance satisfaction scale, which evaluates players’ performance, has the advantage of being a relative measure that can be compared among players regardless of their position and of being able to measure individual changes in athletic performance (within subjects) (Terry, 1995). Additionally, a systematic literature review by Saw et al. (2016) provided evidence that subjective performance rating is more sensitive than objective measures in assessing the athletes’ performance.
As subjective performance measurement becomes increasingly essential, researchers have studied to develop measurement tools (Nahum et al., 2016; Nahum, 2019; Pensgaard & Duda, 2003). Although the initial tool for measuring subjective performance was developed by Pensgaard and Duda (2003), it was criticized for consisting of only one item, which did not consider various factors. Subsequently, Nahum et al. (2016) developed the Athlete’s Subjective Performance Scale (ASPS) for team sport events, which includes the item from Pensgaard & Duda (2003) and five additional items. ASPS has been translated into English and Indian languages and has been shown to have reliable validity and reliability.
However, the ASPS, like many other instruments, was constructed and validated by conventional approaches based on classical test theory (CTT) as a psychometric method, posing several challenges from a measurement perspective (Bond & Fox, 2015). Firstly, the unique characteristics of items vary depending on the level of the participant group, and the level of participants also changes depending on the item’s characteristics (Petrillo et al., 2015). Secondly, the categorization of the rating scale was determined by past developers’ knowledge without scientific evidence (Kim et al., 2022). Third, calculating a total score from data collected without ensuring equal intervals between response categories is inappropriate for determining a participant’s level (Zhu, 1996).
Based on an advanced measurement theory (i.e., item response theory), the Rasch model was proposed as a more valid and reliable measure to overcome these limitations (Rasch 1960; Wright & Linacre, 1989). The Rasch model measures the probability of a participant responding to a specific item based on the difference between the person’s ability and the item’s difficulty. Then, the probability is transformed into a logit score with a linear measurement scale, allowing for a direct comparison of the estimated person’s ability and item difficulty. Furthermore, the Rasch model is based on the concept of invariance, meaning that the item characteristics do not change based on the characteristics of the participant group, and person’s ability remains constant across different tests (Bond et al., 2020). One of the main advantages of the Rasch model is the ability to handle missing data and estimate scores for individuals who have not completed all items on the test (Linacre, 2004). Another advantage is that the model provides a way to test the assumption of unidimensionality, which means that the test items measure a single latent trait (Fischer, 1997).
The ASPS used for team sports athletes has primarily been used to examine the relationships with other psychological variables in previous literature (Akbar et al., 2022; Bukhari et al., 2021). However, there has been little research on the measurement tool since its initial development. Specifically, most studies have used Western athletes as research subjects without considering cultural context, and there is a lack of research on Eastern athletes. Considering that various team sport disciplines in Eastern culture receive much interest from fans, we have identified the necessity of reassessing the functionality of ASPS through the application of the Rasch model. Therefore, this study aims to examine whether the ASPS is a valid tool for assessing the subjective sport performance of Korean university team sport athletes by applying the Rasch model. This research is essential to fill the gap in the literature and contribute to understanding the effectiveness of the ASPS for team sport athletes.
Methods
Procedures and Participants
After getting approval from the Institutional Review Board regarding the research procedures and questions, an online survey link was created using Google Forms, a free online survey tool. An email containing a link to the survey was sent to all the potential participants, and they were informed that their participation was entirely voluntary. Data were collected from a group of 289 college athletes, and 201 athletes attending team events were selected as the study sample, which meets the standard minimum requirement of 200 to perform a Rasch analysis (Kang et al., 2007). This sample consisted of 201 respondents (males = 161 and females = 40) with an average age of 19.81 (SD = 1.43) years. Participants were selected as university elite athletes registered with the Korean Sports and Olympic Committee. 56 percent of participants were ball sport players, 21 percent of those were water sport players, and 16 percent were combat sport players. Table 1 demonstrated demographic characteristics in the study.
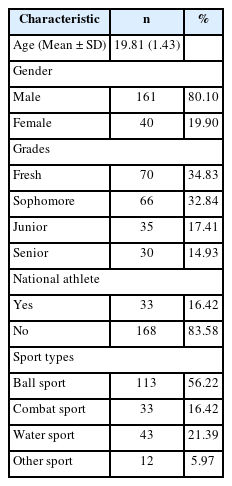
Characteristics of participants
ASPS
The ASPS (Nahum et al., 2016) was used to measure the athletes’ subjective performance in team sports. This scale consists of six items scored on a 10-point Likert scale ranging from 1 (not at all satisfied) to 10 (fully satisfied). To adapt the ASPS for use in Korea, a combined technique involving the back-translation method and bilingual approach was employed (Brislin, 1970; Jones et al., 2001). The process involved the participation of two Koreans who had resided in the United States for over 10 years and two Americans proficient in Korean. Firstly, two bilingual translators who had lived in the US translated the original ASPS from English to Korean. This initial translation ensured an accurate representation of the scale in the target language. Next, the translated version was independently translated from Korean to English by two bilingual translators proficient in Korean but blind to the original English version. This back-translation step assessed the equivalence between the original and translated versions. Following the back-translation, four translators reviewed the original and back-translated versions. Lastly, they compared and discussed discrepancies or inconsistencies to ensure the conceptual and linguistic equivalence between the two versions.
Data Analysis
The Rash measurement program, Winsteps (version 4.6.2.1), was used to perform Rasch analysis. A two-facet Rasch rating scale model was estimated for the study, which includes the item parameter (the difficulty of ASPS items) and the person parameter (individually determined level of the subjective performance satisfaction) in logits.
First, to evaluate the model-data fit, both Infit and Outfit statistics were examined. Infit and outfit are measures of the information-weighted mean square residuals between observed and expected responses in the Rasch model. The outfit is more sensitive to outlier results than Infit. A value close to 1 for both statistics indicates a proper model-data fit. A misfit occurs if the Infit and Outfit statistics fall outside the range of 0.5 to 1.5. Values greater than 1.5 show inconsistent responses, while values less than 0.5 indicate little response variation. The threshold statistics for both Infit and Outfit were found to be between 0.5 and 1.5 (Linacre, 2002b).
Second, the study investigated the dimensionality and local independence of the data using residual-based statistics, which are commonly used to assess the fit between the data and the model (Aryadoust & Raquel, 2019). Rasch principal component analysis of residuals was used to evaluate the eigenvalue of the first contrast and ensure unidimensionality for a given construct. A violation of the unidimensionality assumption is indicated by an eigenvalue that is much greater than 2.0 (Linacre, 2021). Local independence was assessed using Yen’s Q3 index, which is estimated by the correlation among the raw residuals of each item. In Rasch analysis, values higher than 0.7 suggest that items are locally dependent. Christensen et al. (2017) suggested this method for Rasch analysis.
Third, Wright-Andrich map, which is a graphical representation of the distributions of person measures and item measures on the latent trait, was examined. The distribution of items (or response categories) generated from difficulty scores should ideally align with the distribution of person ability scores to indicate that the instrument is well-suited for measuring subjective performance satisfaction among college athletes. Measurement gaps arise when the distributions of persons and items do not align, resulting in imprecise measurements at certain points on the scale. These gaps can occur anywhere along the latent continuum but are commonly observed as either floor effects (a lack of easy items to cover the bottom of the person distribution) or ceiling effects (a lack of difficult items to cover the top of the person distribution).
Fourth, ASPS items difficulty was estimated during the Rasch calibration process. The higher the logit score means that it is less likely to satisfy with ASPS items. The item separation index was examined to assess how well the items were distributed along the measurement scale, with a value higher than 2.0 considered acceptable (Bond et al., 2020). The separation reliability was also evaluated to determine the degree of confidence in replicating item placements across different samples, with a score close to 1.0 indicating a reliable measure for the items (Fisher, 1992).
The fifth step involved estimating a person’s level of athletes’ subjective performance, with higher scores indicating better subjective performance. Person separation index and reliability were also performed to assess how well people were spread along the measurement scale and the reproducibility of their responses to another set of items measuring the same construct. A higher person separation index (>2.0) indicates better spread (Bond et al., 2020), while reliability of 1.00 indicates high confidence (Wright & Masters, 1982).
Sixth, the function of the rating scale was performed to investigate the appropriateness of the existing ASPS’ 10-point response categories. The Rasch rating scale model provides several measures to assess the effectiveness of a measure and its category functions (Zhu & Kang, 1998). Thus, the following criteria were used to assess ASPS optimal categorization (Linacre, 2002a): (1) there are at least ten observations of each category; (2) the average ability of individuals who respond to a category advance with the category; (3) outfit mean-squares less than 2.0; (4) step difficulties advance, which means each category is likely to be chosen in proper order.
Lastly, after evaluating the function of the ten-point scale version of the ASPS, an exploratory analysis was conducted to identify an effective categorization structure. This was done by collapsing or dropping categories based on the criteria if the function of the original ten-point response categories did not meet the abovementioned criteria.
Results
Model Data Fit
The results presented in Table 2 indicated that the infit and outfit values for six items were within the acceptable range of 0.5 to 1.5 logits, with values ranging from .73 to 1.45 for infit and from .73 to 1.44 for outfit. These findings suggest that the Rasch model is a good fit for the data.

Model data fit and item difficulty of the ASPS
Unidimensionality and Local Independence
The Rasch principal component analysis of standardized residuals demonstrated a satisfactory eigenvalue of 1.70, indicating minimal unexplained variance in the first contrast. This finding, combined with the acceptable infit and outfit values, provides evidence supporting the unidimensional structure of the ASPS. Additionally, all ASPS items are locally independent, as none of the standardized residual correlations between the items exceeded 0.7.
Item-person Map with the Andrich Thresholds
The item-person map with the Andrich thresholds is a visual representation of the difficulty of items and persons’ ability in a measurement scale for polytomous items, where the person’s measures are on the left side (“#” represents six people, while each “.” represents one single person), and the item difficulties are on the right side (see Figure 1). The average of the person measures is denoted by ‘M’ on the left side of the center line, while the mean of the item logits is denoted by ‘M’ on the right side. ‘S’ and ‘T’ denote one and two standard deviations from the means. For example, Q3.8 means any person with logits higher than one would have a higher ability to choose scoring category eight on item 3. The map shows ceiling and floor effects, as no ASPS items can correctly measure individuals with logits higher than 3 or lower than −2.5. Furthermore, there is a need to add items that can adequately measure players with logits between −0.5 and 0. Finally, as persons’ ability increases, the categories of selected items should also increase. However, it was found that the order was reversed in some cases. Furthermore, the item separation index of 2.31 suggests good variability of the ASPS items along the measurement scale. The separation reliability of .84 indicates a high level of confidence in replicating the item placement within measurement error for other samples. The person separation index of 2.67 suggests that the ASPS may be sensitive to distinguishing between athletes of different levels. Additionally, the reliability of person separation was .88, indicating a high level of confidence in replicating the placement of individuals within the measurement error. Figure 1 also illustrates that the subjects and items are well separated.

Item-Person map with the Andrich thresholds of the ASPS
Item Difficulty of the ASPS
Table 2 illustrates the estimated difficulty levels of each ASPS item. A higher logit score for an item indicates that athletes are less likely to be satisfied with their performance. The ASPS difficulty levels ranged from −.14 to .29, with Item 4 (“To what extent did you contribute to improving the performance of the players around you this week”) being the least difficult and Item 3 (“To what extent were your capabilities truly reflected this week”) being the most difficult.
Person Ability of the ASPS
The Rasch analysis was used to evaluate an individual’s level of subjective players’ performance, with higher logit scores indicating higher levels of subjective performance. On average, individuals scored a level of .15 logits (SD = 1.76), with estimates ranging from −4.98 to 4.99 logits.
Function of the Rating Scale
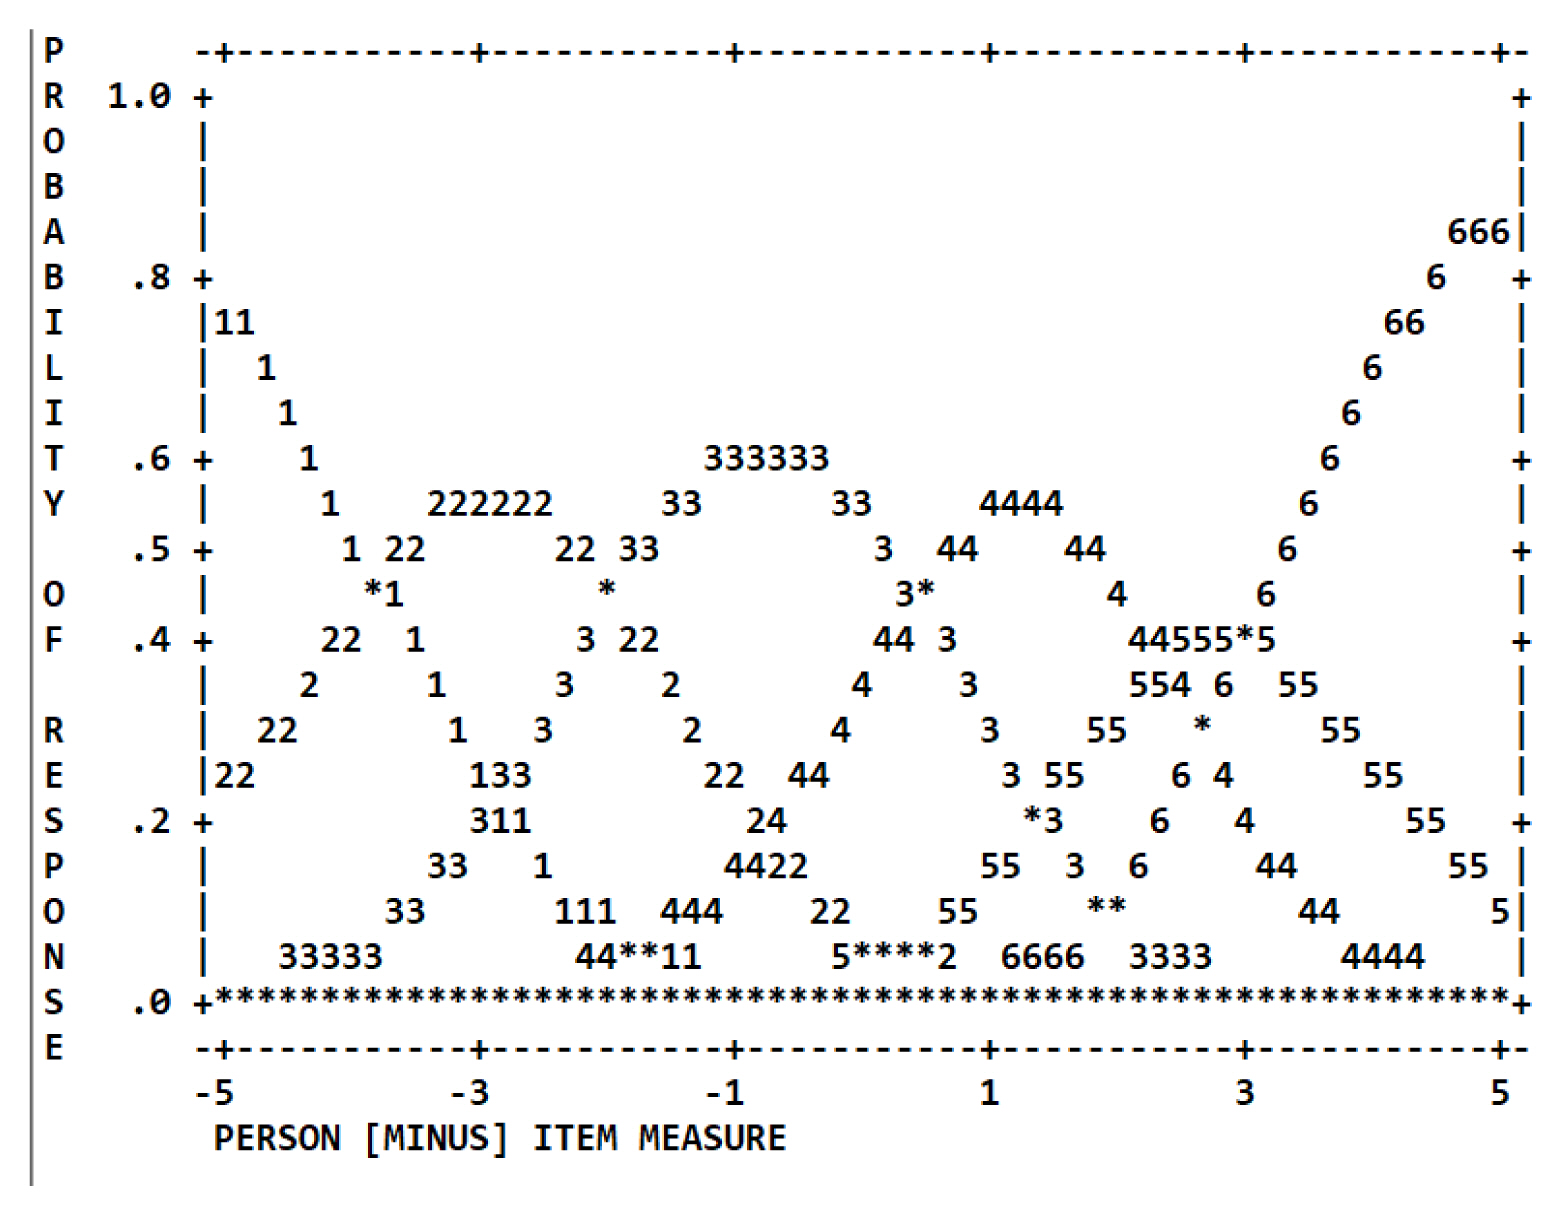
Table 3 summarizes the 10-category rating scale used in the ASPS, with each category selected at least 10 times (ranging from 50 to 255). The outfit statistics for Categories 1–10 were within the acceptable range of .74 to 1.89, indicating no significant misfit. However, the average thresholds and logit measures were disordered and did not increase monotonically as the category number increased. Figure 2 also shows the category probability curves for each ASPS rating scale, indicating that higher levels of subjective performance satisfaction did not necessarily correspond to a higher category on the ASPS. Overall, the 10-category rating scale in the ASPS was found to be functioning poorly. Thus, exploratory analysis was conducted to identify an effective categorization structure by dropping categories.
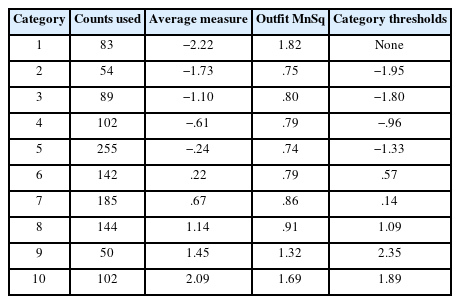
Summary of rating scale function
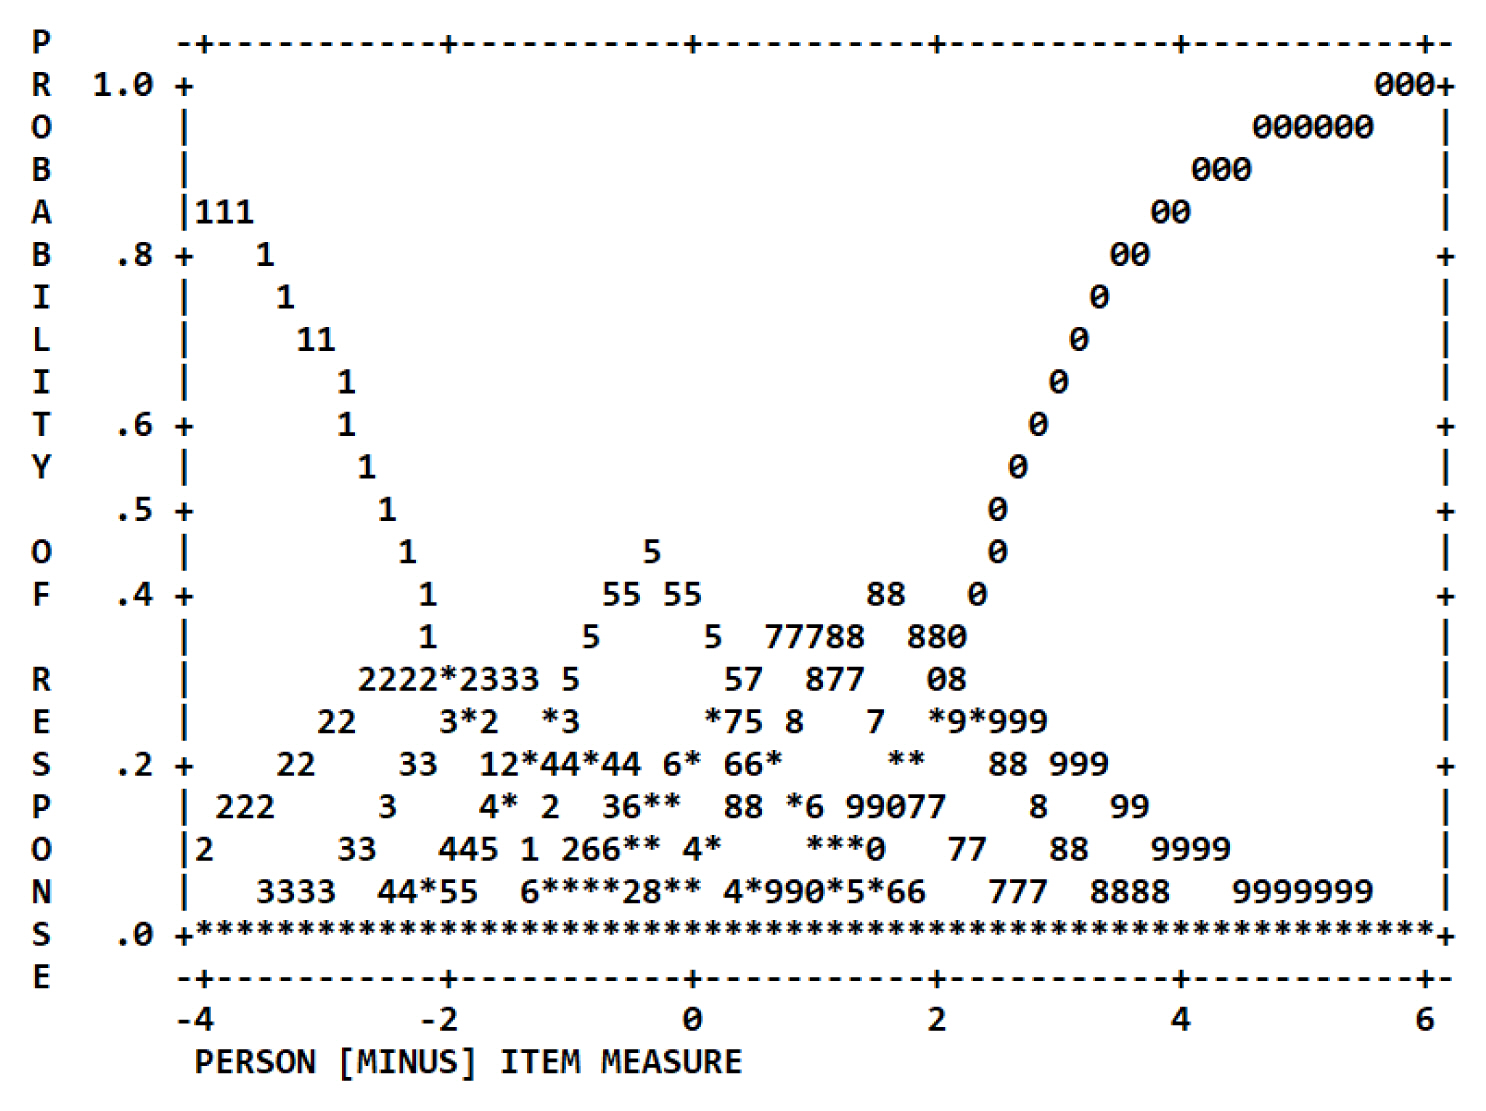
Category probability curve for the ASPS
Rating Scale Diagnostic (Exploratory Analysis)
According to Linacre (2002), disordered thresholds in a measurement instrument indicate that the concept being measured is not well-defined in the respondents’ minds. This means that disordered thresholds in the ASPS may make the resulting measures less interpretable. In such cases, combining or omitting categories can help better understand the issue (Kang et al., 2021; Linacre, 1999). Therefore, it is necessary to perform an exploratory analysis to determine an optimal categorization of the ASPS to improve its efficiency and validity. To perform exploratory analysis, 13 sets of categorizations, ranging from a six-rating scale to a nine-rating scale, were made based on the threshold index. Table 4 indicates the results of an exploratory analysis to identify the optimal categorization structure for the ASPS. Three combinations of categorizations (i.e., 1223344566; 1233344566; and 1223345677) demonstrated ordered category threshold estimates and met all the criteria of the rating scale function. These combinations corresponded to six and seven-rating scales, as shown in Table 4. Among them, we demonstrated category probability curves with the following categorization (i.e., 1223344566), which yielded the highest separation of people and the largest clearly defined probability domain (see Figure 3).
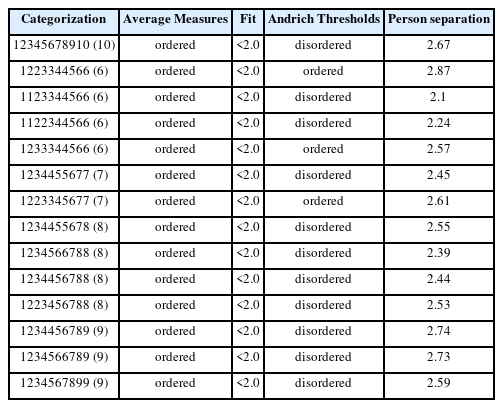
Exploratory analysis for effective categorization structure
Category probability curve for the modified ASPS
Discussion
The purpose of this study was to analyze the model-data fit, item difficulty, and persons’ ability of the ASPS, as well as the rating scale function, using the Rash model to determine its validity. Specifically, the study aimed to verify the validity of the ASPS for university athletes in Korea by considering the cultural context. As a result of the model data fit test with Korean university players participating in team sport events, it was found that the infit and outfit values for six items were within the criteria range of 0.5 to 1.5 logits. Furthermore, the basic assumptions of item response theory, including unidimensionality and local independence, were also satisfied. Consequently, the data was deemed suitable for applying the Rasch model. These results provide evidence that the ASPS is a consistent single-factor scale for college athletes in Korea.
Next, the study compared the item difficulty and persons’ ability on the same linear logit scale. Among the ASPS items, items 3 and 6 were found to have high difficulty, meaning they were more challenging for players to respond “fully satisfied” about the item. On the other hand, item 4 was the lowest level of difficulty. These findings suggest that item 4 was the easiest for players to answer “fully satisfied” compared to other items in the ASPS. The reason Korean university athletes find it difficult to answer items 3 and 6 as “fully satisfied” compared to other questions can be explained by several factors. For item 3, athletes may feel that their capabilities were not fully reflected during the week due to external factors such as a lack of opportunity to perform or internal factors such as physical or mental limitations. For item 6, athletes may be hesitant to judge their coach’s satisfaction with their performance, as they may not have direct communication with the coach or may be uncertain about the coach’s evaluation criteria. Additionally, cultural context can also play a role in shaping athletes’ responses (Nisbett & Masuda, 2003), as expressing high levels of personal satisfaction or evaluation of others may not be typical in Eastern culture.
As a result of examining whether the ASPS, composed of 10-point scales, functioned properly in Korean college athletes participating in team events, it was found that the original 10-point response categories of the ASPS were not functioning as expected. These options were disordered and did not accurately represent the different degrees of the measured trait. According to Zhu and Kang (1998), each response option should have clearly defined boundaries. Additionally, Linacre (2002a) stated that disordered thresholds suggest that the concept being measured is not well-defined in the participants’ minds. This means that the disordered threshold of the ASPS may make it difficult to interpret the results accurately. The disorder may have resulted from the close similarity of categories, as there appeared to be minimal variation in how respondents used them. To address this, a combination of category collapsing and Rasch analysis was used to determine the optimal categorization of the instrument. Exploratory analysis showed that six and seven-rating scales met the required criteria.
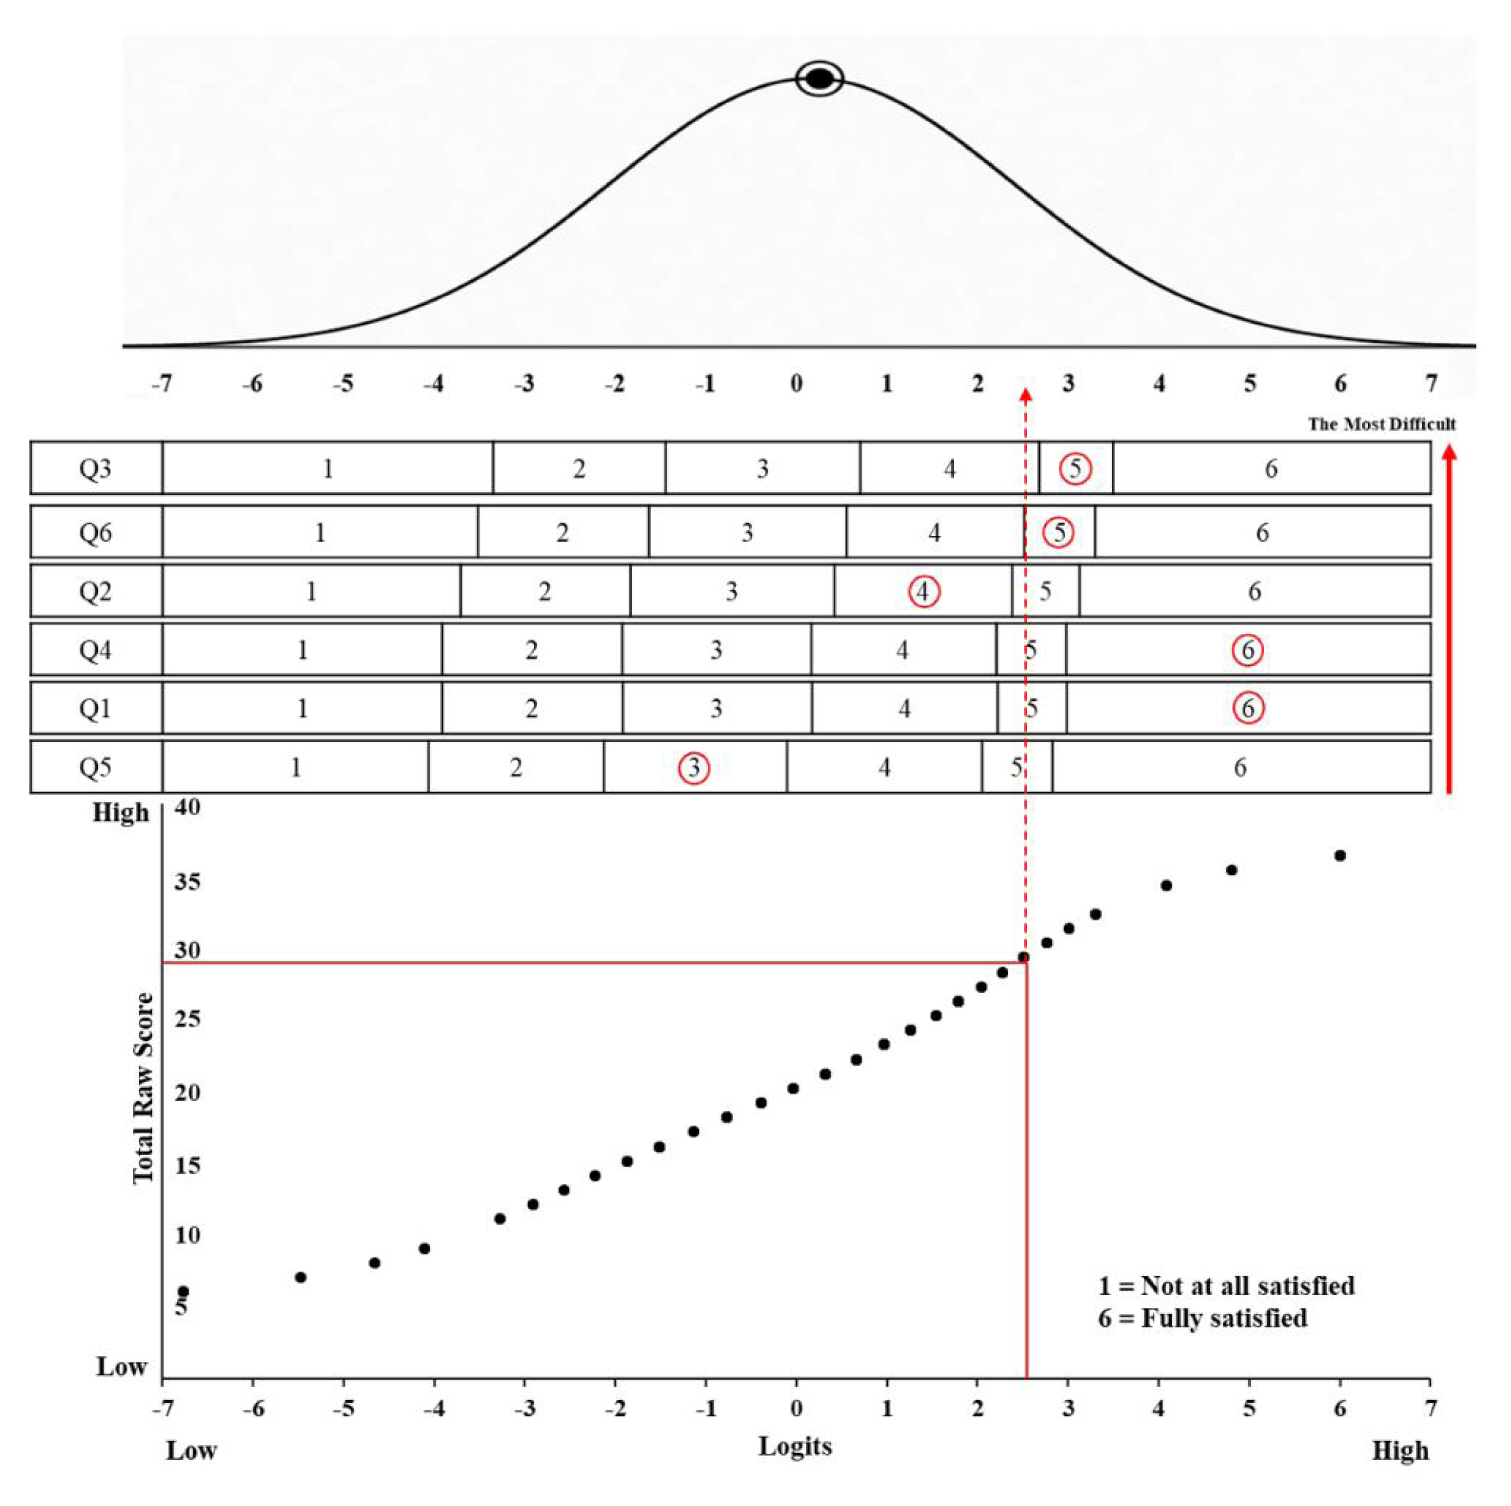
A proposed diagnostic scoring and reporting sheet (Zhu et al., 2001)
The Rasch model may also provide information on athletes’ subjective athletic performance in sport environments. For instance, we can provide a diagnostic scoring and reporting sheet to player A (male, no national team experience) who participated in a combat team event. Specifically, the relationship was graphed between the athlete’s total raw score (29) on the ASPS and the logit score (2.51). Next, a vertical line was drawn upward to compare the individual’s selected category value (circular number) with the expected value from the Rasch model for each item. Lastly, the individual’s score was compared to the mean ability value (logit) to confirm subjective athletic performance between the individual and the group.
First, the results indicated that the subjective performance satisfaction of player A, randomly selected, was higher (2.51) than the average of Korean university players (0.39). Second, the observed and expected values were the same in item 6. Third, item 1, item 3 and item 4 revealed higher observed values than expected values, while item 2 and item 5 showed lower observed values than expected values. Mainly, item 5 (“How satisfied are you with your performance at the toughest moments this week”) showed the largest difference between observed and expected values. Although the subjective performance satisfaction was much higher than the players’ average satisfaction, it was found that player A was not satisfied with his performance in difficult situations. Therefore, these results may allow coaches to understand why player A is dissatisfied with his performance under certain circumstances (e.g., psychological pressure or technical defect).
The current study provides significant implications. First, using Rasch calibration analysis, we demonstrated that the ASPS, based on CTT and widely used in Western cultures, showed problems with scale function when applied to Korean college athletes. Second, the diagnostic scoring and reporting sheet based on the logit score can be practically applied in sport fields to compare the subjective sport performance differences between individuals and groups. iii. Despite the fruitful implications of this study, there are some limitations. First, there has been no prior research applying the Rasch model to Asian populations to analyze the reliability and validity of the ASPS. Therefore, there was insufficient data to compare the results of this study directly. Second, Rasch calibration and optimal categorization of the ASPS have not been studied in Western cultures. According to Nisbett and Masuda (2003), Western cultures emphasize individual performance, while Eastern cultures place more importance on the group. Hence, future research is needed to conduct DIF analysis to confirm whether the ASPS functions differently depending on whether it is used for Eastern or Western athletes by collecting data from Western athletes.
Notes
Author Contribution
1. Study concept and design: Seungbak Lee, Minsoo Kang
2. Acquisition of data: Minsoo Jeon, Hyo Jun Yun
3. Analysis and interpretation of data: Seungbak Lee, Minsoo Kang
4. Drafting of the manuscript: Seungbak Lee, Minsoo Jeon, Hyo Jun Yun
5. Critical revision of the manuscript for important intellectual content: Seungbak Lee, Minsoo Kang
6. Administrative, technical, and material support: Seungbak Lee, Minsoo Jeon, Hyo Jun Yun
7. Study supervision: Minsoo Kang