


Introduction
The factors affecting sports performance are divided into two main factors, genetic and environmental. Genetic factors are congenital from birth, and environmental factors accumulate throughout growth (Davids et al., 2007). Depending on the characteristics of each sport, various studies are being conducted on factors that affect performance. For instance, East African athletes, such as Ethiopian and Kenyan, were demonstrated to have more advantageous genetic characteristics to win a marathon race (Onywera, 2009). The current world record for marathon is 2:01:39 set by Eliud Kipchoge in the 2018 Berlin Marathon (Hoogkamer et al., 2019). The record is close to a sub-2-h that has been considered a human limit, raising interest in marathon records around the world (Joyner et al., 2011; Hunter et al., 2015). For the women’s marathon, the world record is 2:14:04, set by Brigid Kosgei in the 2019 Chicago Marathon. Both Kipchoge and Kosgei are Kenyan. In addition to genetic factors, various environmental factors, such as the quantity and quality of training, the influence of coaches and parents, and the social atmosphere also affect the athlete’s physiological, technical, tactical, psychological, and social characteristics reflected in their athletic performance (Bangsbo, 2015). Since a marathon is a road race that lasts more than two hours, many factors contribute to athletes’ performance (Kim et al., 2010). These factors include body composition (Zouhal et al., 2011), physical abilities, such as cardiopulmonary functions and lactate threshold (Noble et al., 1979; Skiba & JonesEli, 2011), environmental factors, such as temperature and humidity (Knechtle et al., 2018), training (Hamstra-Wright et al., 2013), psychological factors (Sin et al., 2015), and strategies such as pace control (Diaz et al., 2018; Diaz et al., 2019). East African athletes show excellent performance in marathons because factors such as walking-oriented living conditions, high VO2max from lifelong running, high hematocrit levels, traditional diets, body shapes, favorable muscle fibers and enzymes, and economic motivation (Wilber & Pitsiladis, 2012; Marc et al., 2014), in addition to genetic predisposition, have positively affected them.
For women’s marathon, 76% of the top 100 athletes in 2019 were East African. There were 46 Ethiopians and 30 Kenyan, which was far more than others. What is noteworthy is that the Japanese athletes also had good performance in the marathon. Japan had 7 athletes in the top 100 in 2019 (World Athletics, 2021). This confirms that Japanese marathoners perform better than athletes from other East Asian countries despite the similarity in physique and geographical background. While many studies have been interested in East African athletes’ excellent performance, not many studies have investigated why certain countries’ athletes, including the Japanese, who are of different races and environments, are superior to others.
A comparative analysis of the marathon performance of Korea and Japan showed a significant difference in the marathon performance of Korean and Japanese marathoners (Kim et al., 2013). Reasons for Japan’s excellent marathon performance include the introduction of a world-class coach’s training method for long-distance races, a system to foster coaches, and the hosting of local mid- to long-distance competition to improve the speed of athletes. However, these factors are the results of a long period of effort, and there are limitations to accepting them within a short period. Kim et al. (2013) noted that Japanese athletes broke records in prestigious overseas marathon competitions and actively participated in major international competitions. They went on to suggest that Korean athletes should be more active in competing for best records in the most competitive levels in order to improve their performance (Kim et al., 2013).
In general, there are two major types of marathon competitions: record competitions and rank competitions. Record competitions can include larger marathon categories (GL, A, B, and C) where athletes compete with the goal of achieving a personal or world record time. Record competitions are generally more competitive as they attract elite athletes from around the world. Although achieving a high rank is important, setting their best record is also a strong incentive. Rank competitions can include smaller marathon categories (E and F) where athletes compete with the goal of achieving a certain rank or qualifying for the next competition. The prizes for these types of regional and national competitions are mostly awarded based on rank. Due to the emphasis on the final rank, athletes have less of an incentive to make a personal best record compared to achieving the best rank. Also, the level of competitiveness is limited since international participation is excluded.
Many professionals in track and field have also argued that the most realistic method to improving marathon performance is participation in record competitions. While many studies have put forth information on how to improve marathon performance, it is hard to find a study that reveals the importance of record competition through participation in international competitions. There is little objective and scientific evidence or relevant research to support such a claim. Therefore, the purpose of the current study was to investigate the effects of record competition on marathon performance.
Methods
Ethical Approval
This study was approved by the Institutional Review Board of Yonsei University, Korea (Republic of), with a waiver of the requirement for informed consent of the participants as the study involved the analysis of publicly available data.
Subjects
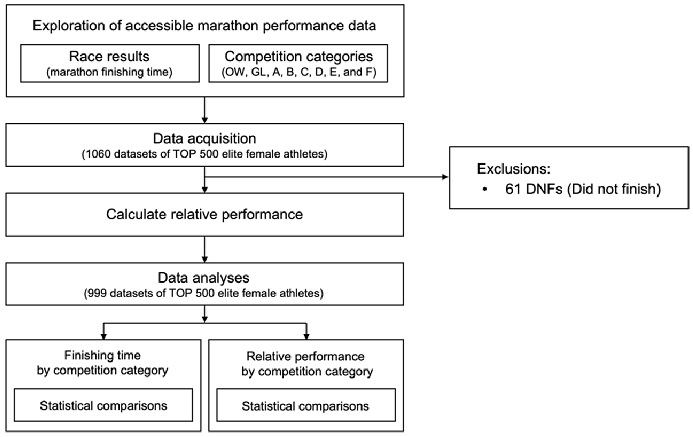
The top 500 female athletes in 2019 were selected from the World Athletics website. The subjects consisted of 135 Ethiopian (27.0%), 99 Kenan (19.8%), 47 Japanese (9.4%), 44 American (8.8%), 13 British (2.6%), 11 Chinese (2.2%), 11 Canadian (2.2%), and others (28.0%). These subjects participated in a total of 1,060 competitions.
Methodology
We obtained the top 500 female marathoners’ performances in 2019 from the World Athletics home page (http://www.worldathletics.org) (World Athletics, 2021). All athletes’ race results from 2019 and the categories of competitions they participated in were analyzed. From the published information, we obtained data on the names, nationalities, categories of competition, and race times. The top 500 athletes were then divided according to their marathon performance times into the following 5 groups: Top 100, top 101-200, top 201-300, top 301-400, and top 401-500. This was done to analyze differences in performance groups for each category and was based on prior marathon research studies that also used the same grouping of 100 athletes. (Hunter et al., 2015; Nikolaidis et al., 2017; Rodrigo et al., 2021). This grouping also followed a common method used in the field of sports science of dividing the total into quintiles (Ballard et al., 2015). Depending on the competition’s characteristics (e.g., international or domestic, size, the competitiveness of the participating athletes etc.), all competitions approved by World Athletics were given one of the following categories: OW, GL, A, B, C, D, E, and F (World Athletics, 2021). OW includes Olympic games and world championships. GL includes IAAF gold label marathons (e.g., Boston Marathon, Berlin Marathon, Chicago Marathon, London Marathon, etc.) and area senior outdoor championships (e.g., European athletics championships, etc.). A includes major games (all-African, Asian, Commonwealth, Pan American) and IAAF silver label marathons. B includes IAAF bronze label marathons, regional games championships, and national championships. C includes IAAF world athletics series, area third-tier championships, and other regional games and championships. D includes other regional international championships, games and cups, and area fourth-tier championships. E includes other international marathons, and F consists of national competitions. DNF (did not finish) data, where the athletes participated in the race but did not finish, were excluded from the analyses.
Statistical Analysis
Data are presented as means (± standard deviation). The race results were translated into ‘seconds’ before statistical analyses were performed. One-way ANOVA was used to analyze the difference in performance by category of competition. To make comparisons of relative performance, each athlete’s performance was divided by their season’s best performance record. This statistical method was based on a prior study that divided athletes’ performance by the gender-specific world-class performance standard to compensate for differences between men and women (Deaner et al., 2011). The average records of each category of competitions were analyzed. Finally, a t-test was done to compare the differences in records of the same athletes by categories of competition. Statistical significance of the mean differences was set at a = 0.05 (Hopkins et al., 2009). The analyses were conducted using SPSS (v25, IBM) and Graph-Pad Prism software (v9, GraphPad software).
Results
Distribution of participation
The categorical distribution of competitions was organized in such a manner to highlight the number of participants in each type of competition using both absolute values and relative percentages. For the top 500 female marathon athletes, 33 (3.30%) out of a total of 999 competitions they competed in were OW, 485 (48.55%) were GL, 88 (8.81%) were A, 164 (16.42%) were B, 11 (1.10%) were C, 173 (17.32%) were E, and 45 (4.50%) were F. None of the top 500 athletes participated in D. For the top 100 athletes, 6 (3.24%) out of a total of 185 competitions they competed in were OW, 152 (82.16%) were GL, 5 (2.70%) were A, 10 (5.41%) were B, 9 (4.86%) were E, and 3 (1.62%) were F. For the top 101-200 athletes, 5 (2.31%) out of a total 216 competitions they competed in were OW, 119 (55.09%) were GL, 26 (12.04%) were A, 35 (16.20%) were B, 1 (0.46%) were C, 29 (13.43%) were E, and 1 (0.46%) were F. For the top 201-300 athletes, 5 (4.31%) out of a total of 209 competitions they participated in were OW, 70 (33.49%) were GL, 22 (10.53%) were A, 42 (20.10%) were B, 5 (2.39%) were C, 54 (25.84%) were E, and 7 (3.35%) were F. For the top 301-400 athletes, 4 (1.97%) out of a total of 203 competitions they participated in were OW, 75 (36.95%) were GL, 22 (10.84%) were A, 45 (22.17%) were B, 4 (1.97%) were C, 40 (19.70%) were E, and 13 (6.40%) were F. For the top 401-500 athletes, 9 (4.81%) out of a total of 187 competitions they competed in were OW, 69 (36.90%) were GL, 13 (6.95%) were A, 32 (17.11%) were B, 1 (0.53%) were C, 41 (21.93%) were E, and 22 (11.76%) were F.
The average marathon finishing times of the top 500 female marathoners in each competition category
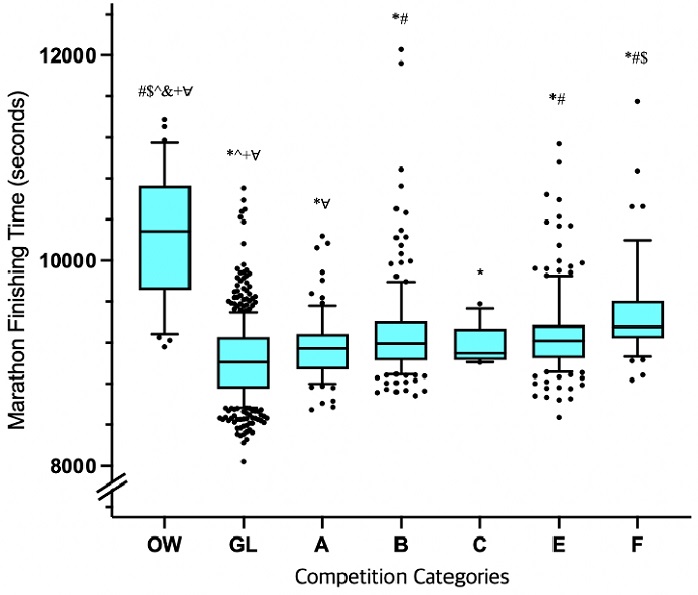
The average marathon finishing times of the top 500 female athletes in each category are shown in Figure 2. The average finishing time in GL was the fastest [2:30:26 (± 00:06:29)]. From A to F, the average finishing time tended to increase from 2:32:38 (± 00:05:24) to 2:38:17 (± 00:08:27). The average finishing time in OW was the slowest [2:50:36 (± 00:10:48)]. The difference in the average records across each category was statistically significant (p<.05).
Figure 2.
Box plot comparing marathon finishing time of top 500 female athletes of each category in 2019.
Boxes indicate the 25th and 75th percentiles. Whiskers indicate 10th and 90th percentiles with the middle horizontal line representing the mean. The outliers are indicated by black dots. Of the total 999 race results, 33 were OW, 485 were GL, 88 were A, 164 were B, 11 were C, 173 were E, and 45 were F. OW includes Olympic games and world championships, GL includes IAAF gold label marathons and area senior outdoor championships, A includes major games and IAAF silver label marathons, B includes IAAF bronze label marathons, C includes IAAF world athletics series and area third tier championships, E includes other international marathons, and F includes national competitions. *Significantly different from OW, P < 0.05; #significantly different from GL, P < 0.05; $significantly different from A, P < 0.05; ^significantly different from B, P < 0.05; &significantly different from C, P < 0.05; +significantly different from E, P < 0.05; ∀significantly different from F, P < 0.05.
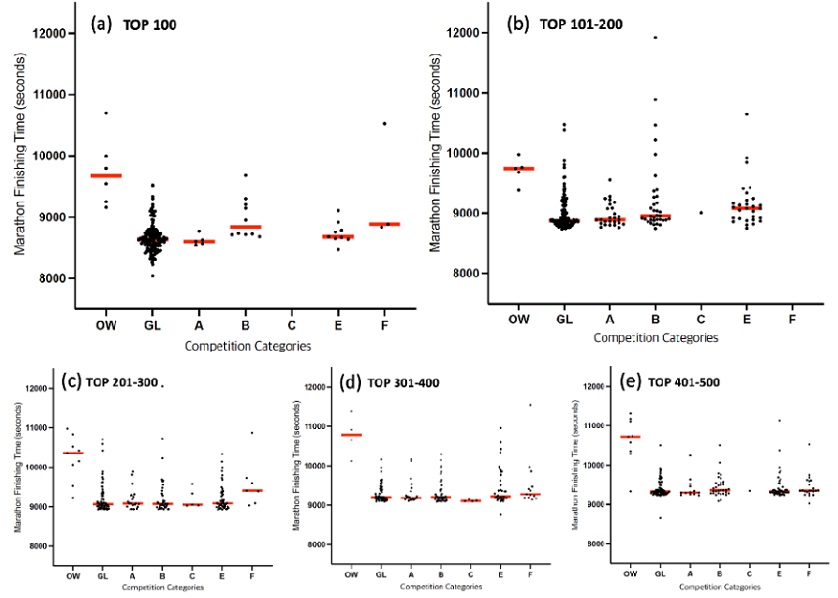
In order to examine the overall distribution and average finishing times of the top 100, top 101-200, top 201-300, top 301-400, and top 401-500 athletes by competition category, the results are presented as scatter plots (Figure 3).
Figure 3.
Marathon finishing time of the top 100 (a), top 101-200 (b), top 201-300 (c), top 301-400 (d), and top 401-500 (e) female athletes in each category in 2019.
Race results are indicated by black dots with the red horizontal line representing the mean. OW includes Olympic games and world championships, GL includes IAAF gold label marathons and area senior outdoor championships, A includes major games and IAAF silver label marathons, B includes IAAF bronze label marathons, C includes IAAF world athletics series and area third tier championships, E includes other international marathons, and F includes national competitions.
The average relative performance of the top 500 female marathoners in each competition category
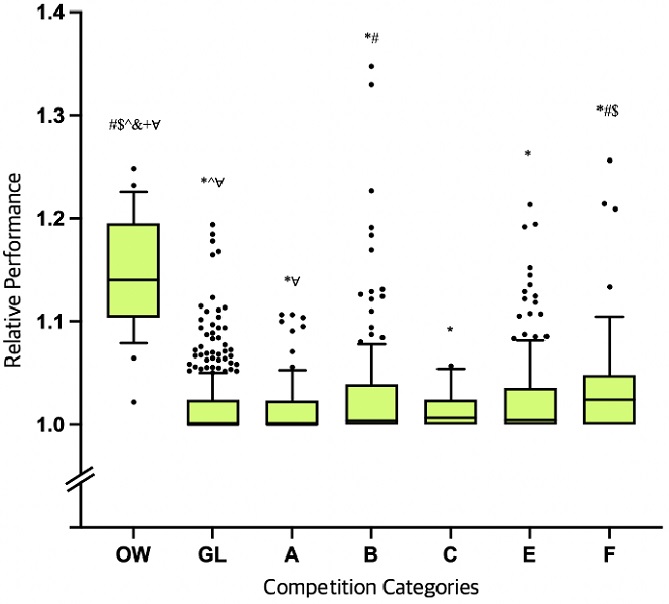
The average relative performances of the top 500 marathoners in each category are shown in Figure 4. The relative performance represents each athlete’s race finishing time divided by their season’s best performance record. The average relative performance in GL was 1.016 (± 0.029). From A to F, the average relative performance tended to increase from 1.016 (± 0.028) to 1.039 (± 0.059). The average relative performance in OW was the highest at 1.139 (± 0.054). The difference in the average relative performance of female marathoners across each category was statistically significant (p<.05).
Figure 4.
Box plot comparing the relative performance of the top 500 female athletes in each category in 2019.
The relative performance represents each athlete’s race finishing time divided by their season’s best performance record. Boxes indicate the 25th and 75th percentiles. Whiskers indicate 10th and 90th percentiles with the middle horizontal line representing the mean. The outliers are indicated by black dots. Of the total 999 race results, 33 were OW, 485 were GL, 88 were A, 164 were B, 11 were C, 173 were E, and 45 were F. OW includes Olympic games and world championships, GL includes IAAF gold label marathons and area senior outdoor championships, A includes major games and IAAF silver label marathons, B includes IAAF bronze label marathons, C includes IAAF world athletics series and area third tier championships, E includes other international marathons, and F includes national competitions. *Significantly different from OW, P < 0.05; #significantly different from GL, P < 0.05; $significantly different from A, P < 0.05; ^significantly different from B, P < 0.05; &significantly different from C, P < 0.05; +significantly different from E, P < 0.05; ∀significantly different from F, P < 0.05.
In order to examine the overall distribution and the relative performance of the top 100, top 101-200, top 201-300, top 301-400, and top 401-500 athletes by race category, the results are presented as scatter plots (Figure 5).
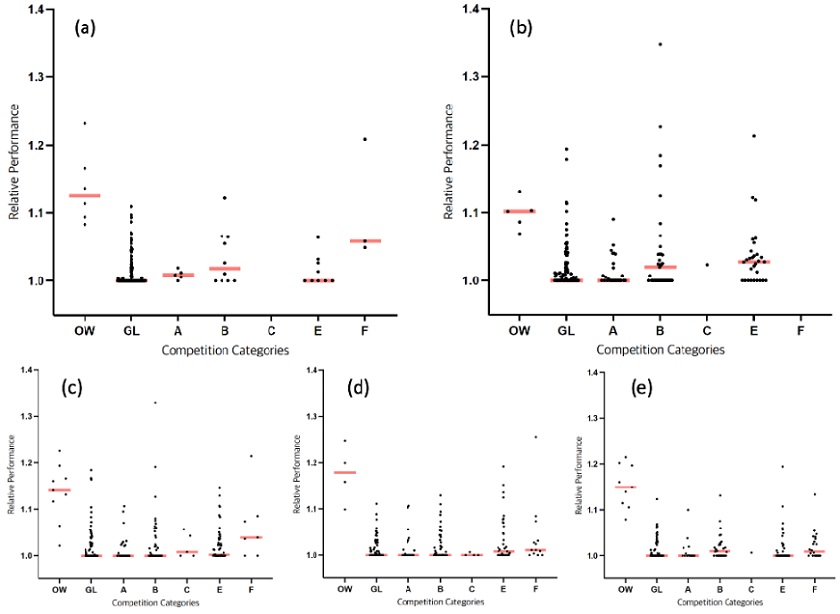
Figure 5.
Relative performance of the top 100 (a), top 101-200 (b), top 201-300 (c), top 301-400 (d), and top 401-500 (e) female marathon athletes in 2019.
The relative performance represents each athlete’s race finishing time divided by their season’s best performance record. Race results are indicated by black dots with the red horizontal line representing the mean. OW includes Olympic games and world championships, GL includes IAAF gold label marathons and area senior outdoor championships, A includes major games and IAAF silver label marathons, B includes IAAF bronze label marathons, C includes IAAF world athletics series and area third tier championships, E includes other international marathons, and F includes national competitions.
Discussion
The aim of this study was to examine the importance of record competition on the performance of female marathoners. To show this scientifically, performance records across competition categories were examined. The main findings were: (a) There were differences in marathon finishing times by race category (Figure 2), and athletes with better performances tended to participate in large international competitions. (b) When comparing the average finishing times of the participating athletes by category, those participating in the GL competitions were the fastest, while those participating in the OW competitions were the slowest (Figure 2, 3). (c) The relative performance of female marathoners who participated in large international competitions such as GL, A, B, and C, resulted in better relative performance compared to smaller international or domestic competitions, such as E and F (Figure 4, 5).
Our study is the first to analyze whether a runner’s marathon performance varies depending on whether an athlete participates in a competition for better records or better ranks. Previous studies have focused on other factors that affect marathon performance such as genetic influences (Puthucheary et al., 2011). In the case of marathons, prior studies have so far shown that 16 single nucleotide polymorphisms in 14 genes are related to performance (Moire t al., 2019). The specific determinants include internal factors such as physique, physical fitness and psychological variables, as well as external factors such as the coaching capacity, team management, support system, and type of competition in which the athletes participate (Kim et al., 2010). Experts have argued that among the various factors, one of the most realistic contributions to improving performance in a short period of time is to provide an environment in which athletes can compete for records. Therefore, despite the various factors that affect marathon performance, the present study focused on the importance of record competition. The goal of record competitions is to improve marathoners’ personal records by providing an environment where they compete with the best athletes who also serve as pacemakers. Such a condition is possible in international competitions, which are large and comprise a greater number of elite runners. Kongings and Hettinga (2018) further demonstrated the importance of external settings by observing how athletes tend to adjust their pace to the behavior of other contenders. While the exclusive participation of top athletes makes it a challenge to earn a medal, many athletes in return benefit from competitive pacemakers to achieve their personal best records. The absence of the need to perform to qualify for the next stage also contributes to improved performance in high-grade competitions. In lower-grade competitions, the main goal of athletes is to qualify for the next stage via finishing (Konings & Hettinga, 2018). Therefore, their central motivation is often to win the race, regardless of their record. In these rank competitions, such as the F category, athletes are awarded for the rank they achieve. As a result, athletes have less of an incentive to go beyond ranking among the top. Furthermore, competing in smaller and less competitive environments may improve the chances of achieving a higher rank, but can also hinder an athlete from reaching their highest level of performance.
Several studies have specifically focused on world records or personal best records of athletes (Maffetone et al., 2017; Renfree & St Clair Gibson, 2013), while others have analyzed the records of specific competitions, such as the Major Marathon events (e.g., Boston, New York, Berlin and Chicago) and World Championships. Conversely, for the present study, all race results of the subjects and all marathon events in which they participated were included in the analysis.
The subjects obtained for the present study confirmed that African athletes outperformed those from other countries (Hoogkamer et al., 2019; Joyner et al., 2011; Bangsbo, 2015). Among the top 500 athletes, 46.8% were East African, followed by Japanese athletes. This data is similar to that of Knechtle et al. (2017) who demonstrated the difference in performance between African and non-African runners in the World Marathon Majors races from 2000 to 2014 (Knechtle et al., 2017). One of the reasons that East African athletes show outstanding performance is because of the prize money. East African athletes showed a significantly higher participation rate in marathons hosted in countries other than East Africa, whereas athletes from Japan, the United States, Germany, and England participated more in GL marathons hosted in their own countries. This implies that hosting a large-scale international marathon in each country has an influence on athletes’ participation rate and their performance.
Taking a look at the average finishing time of competition categories, it is evident that the average times get slower from GL to F. This could be interpreted in two ways. In large-scale international marathons, participating athletes generally achieve faster average times than lower-level competitions because they are competing for records rather than ranks. Another interpretation is simply because better athletes participated in the large-scale marathons. A clear gap in performance capacity could exist between athletes that competed in major competitions who surpassed preliminary rounds for qualification and those that partook in smaller competitions with relatively lower qualification standards. Therefore, because a simple comparison between records by category of competition cannot fully explain the importance of record competition, we further analyzed the difference using relative records.
Practical Applications
Participating in large-scale, international competitions, where athletes compete for records, resulted in superior finishing times, with athletes often achieving their season’s best performances. While many variable factors can be considered for improving marathon performance, active participation in record competitions appears to be a relatively simple and immediate change that can be implemented among marathoners. Therefore, coaches can consider having their athletes compete in larger races, while other countries looking to improve their records and status in the marathon arena may also recruit coaches from nations recognized for outstanding marathon performances, such as Japan.
Several limitations of the study should be acknowledged. For one, only female marathoners were examined in the study, while other key factors, such as age and experience, were not accounted for. This reduces the generalizability of the results across genders, as well as age groups. Future research examining the importance of record competitions for male marathoners, as well as a comparison of its impact on male vs. female marathoners, need to be done to gain a better understanding. Since the effects of competing for ranks or records on marathon performance do not likely play a major role compared to other prominent factors such as genetics, it can be difficult to measure the extent of its impact; however, with more precise data analysis, these limitations can be addressed. Future performance analysis incorporating the body composition of athletes, their VO2max, the climate on the day of competition, and other factors affecting marathon performance can provide more robust support.
Conclusion
We studied the top 500 female athletes from various countries in 2019 according to the scale of the competition. The average finishing time in GL was the fastest, and from A to F, the average finishing time tended to increase. The average finishing time in OW was the slowest. In addition, athletes with superior performance often participated in large-scale international competitions (e.g., GL, A, B), and there was a clear tendency of achieving their season’s best performance in those competitions. The relative performance in OW was the worst. These results are interpreted to mean that 1) athletes with excellent performance tend to participate in large scale international competitions, and 2) marathon performance is enhanced when competing for records in large-scale competitions with athletes who have good records.
 PDF Links
 PubReader
 ePub Link
 Full text via DOI
 Download Citation
 Print
Print